Last updated: June 23, 2026
About Google Cloud Monitoring
Dash0 provides comprehensive monitoring for Google Cloud Platform (GCP) infrastructure, automatically collecting and visualizing metrics from Cloud Run services, Cloud Run jobs, Pub/Sub topics and subscriptions, and Cloud Storage buckets.
GCP infrastructure monitoring in Dash0 gives you visibility into resource utilization, performance, and health across your cloud environment without requiring manual instrumentation or configuration of individual services.
Supported Services
Dash0 monitors the following GCP services:
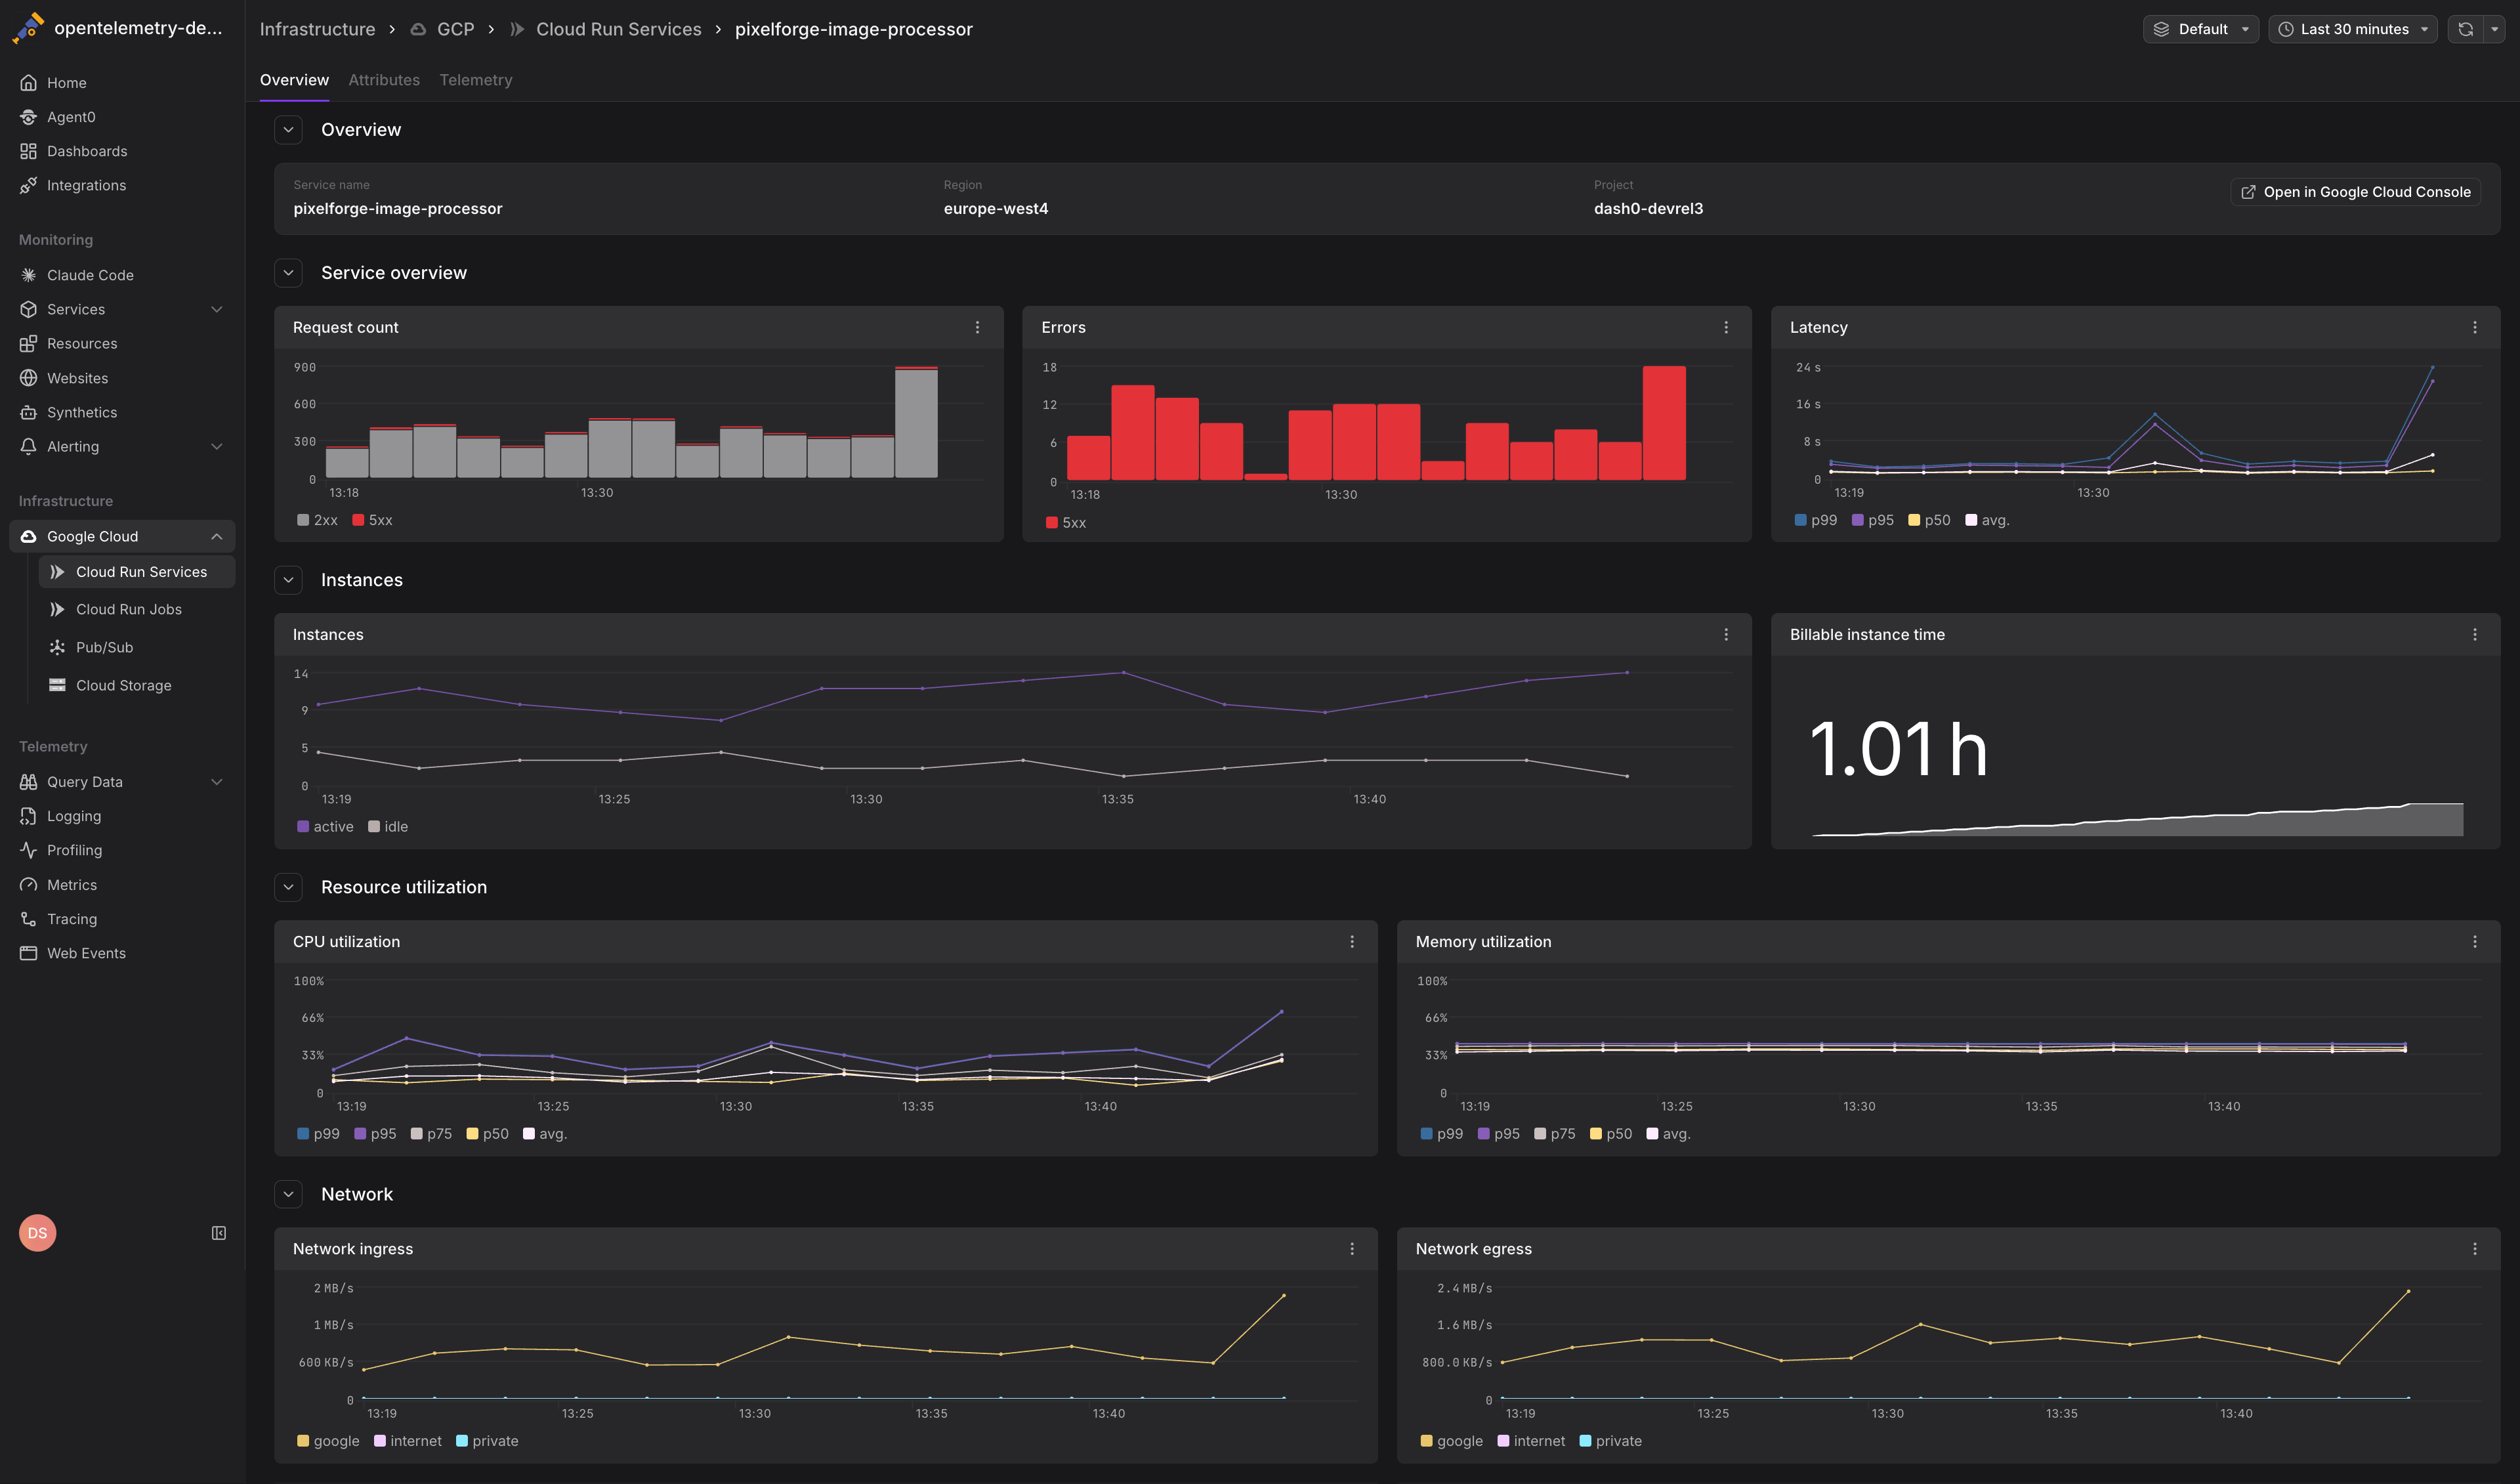
- Cloud Run Services: Track container instances, CPU and memory utilization, request rates, latency, and billable instance time across all revisions of your Cloud Run services.
- Cloud Run Jobs: Monitor job executions, task attempts, completion status, and resource consumption for batch workloads.
- Pub/Sub Topics & Subscriptions: Observe message throughput, publish and acknowledgment latency, backlog size, retention metrics, and subscription health.
- Cloud Storage: Track API request rates, network traffic, bucket size, and object counts over time.
- Cloud SQL: Monitor CPU, memory, and disk utilization, connection activity, and engine-specific performance for PostgreSQL, MySQL, and SQL Server instances.
How It Works
Dash0 integrates with Google Cloud Monitoring (formerly Stackdriver) to collect infrastructure metrics. The integration uses Application Default Credentials (ADC) for authentication and requires minimal permissions.
Once configured, metrics flow automatically from Cloud Monitoring into Dash0, where they're correlated with your application telemetry (traces, logs, and metrics from OpenTelemetry instrumentation). This unified view lets you connect infrastructure behavior to application performance.
For example, you can see how Cloud Run CPU utilization correlates with request latency spikes, or how Pub/Sub message backlogs correspond to downstream processing delays.
Getting Started
To start monitoring GCP infrastructure in Dash0:
- Connect your GCP project in Dash0 by granting the necessary permissions to the Dash0 service account.
- Configure which projects to monitor by selecting projects in the Dash0 integration settings.
Cloud Monitoring is enabled by default on most GCP projects. If you're unsure, check the APIs & Services page in the Google Cloud Console. If it is not enabled, Dash0 enables it for you.
For all the details, see Set Up Google Cloud Integration.
Metrics will begin flowing into Dash0 within minutes, appearing in the Infrastructure section of the navigation sidebar under Google Cloud.
Viewing GCP Metrics
Navigate to Infrastructure > Google Cloud in the Dash0 sidebar to access dedicated views for each service type. Each view provides:
- Service-specific metrics dashboards showing key performance indicators and resource utilization
- Time-series charts with customizable time ranges and granularity
- Resource listings with sortable and filterable tables
- Direct links to related resources for drilling into correlated application telemetry
You can also query GCP infrastructure metrics using PromQL in the Query Builder or create custom dashboards combining infrastructure and application metrics.
Next Steps
- Set Up Google Cloud Integration — Configure the GCP integration and permissions
- Monitor Cloud Run Services — Monitor Cloud Run service metrics
- Monitor Cloud Run Jobs — Track batch job executions
- Monitor Pub/Sub — Observe messaging infrastructure
- Monitor Cloud Storage — Monitor bucket usage and performance
- Monitor Cloud SQL — Monitor database instance health and performance