Last updated: June 23, 2026
Monitor Cloud Run Services
Dash0 automatically collects metrics for all Cloud Run services in your connected GCP projects, providing visibility into resource utilization, request performance, and infrastructure health.
Cloud Run metrics help you understand how your serverless containers are performing, identify scaling bottlenecks, and optimize resource allocation to reduce costs.
Viewing Cloud Run Metrics
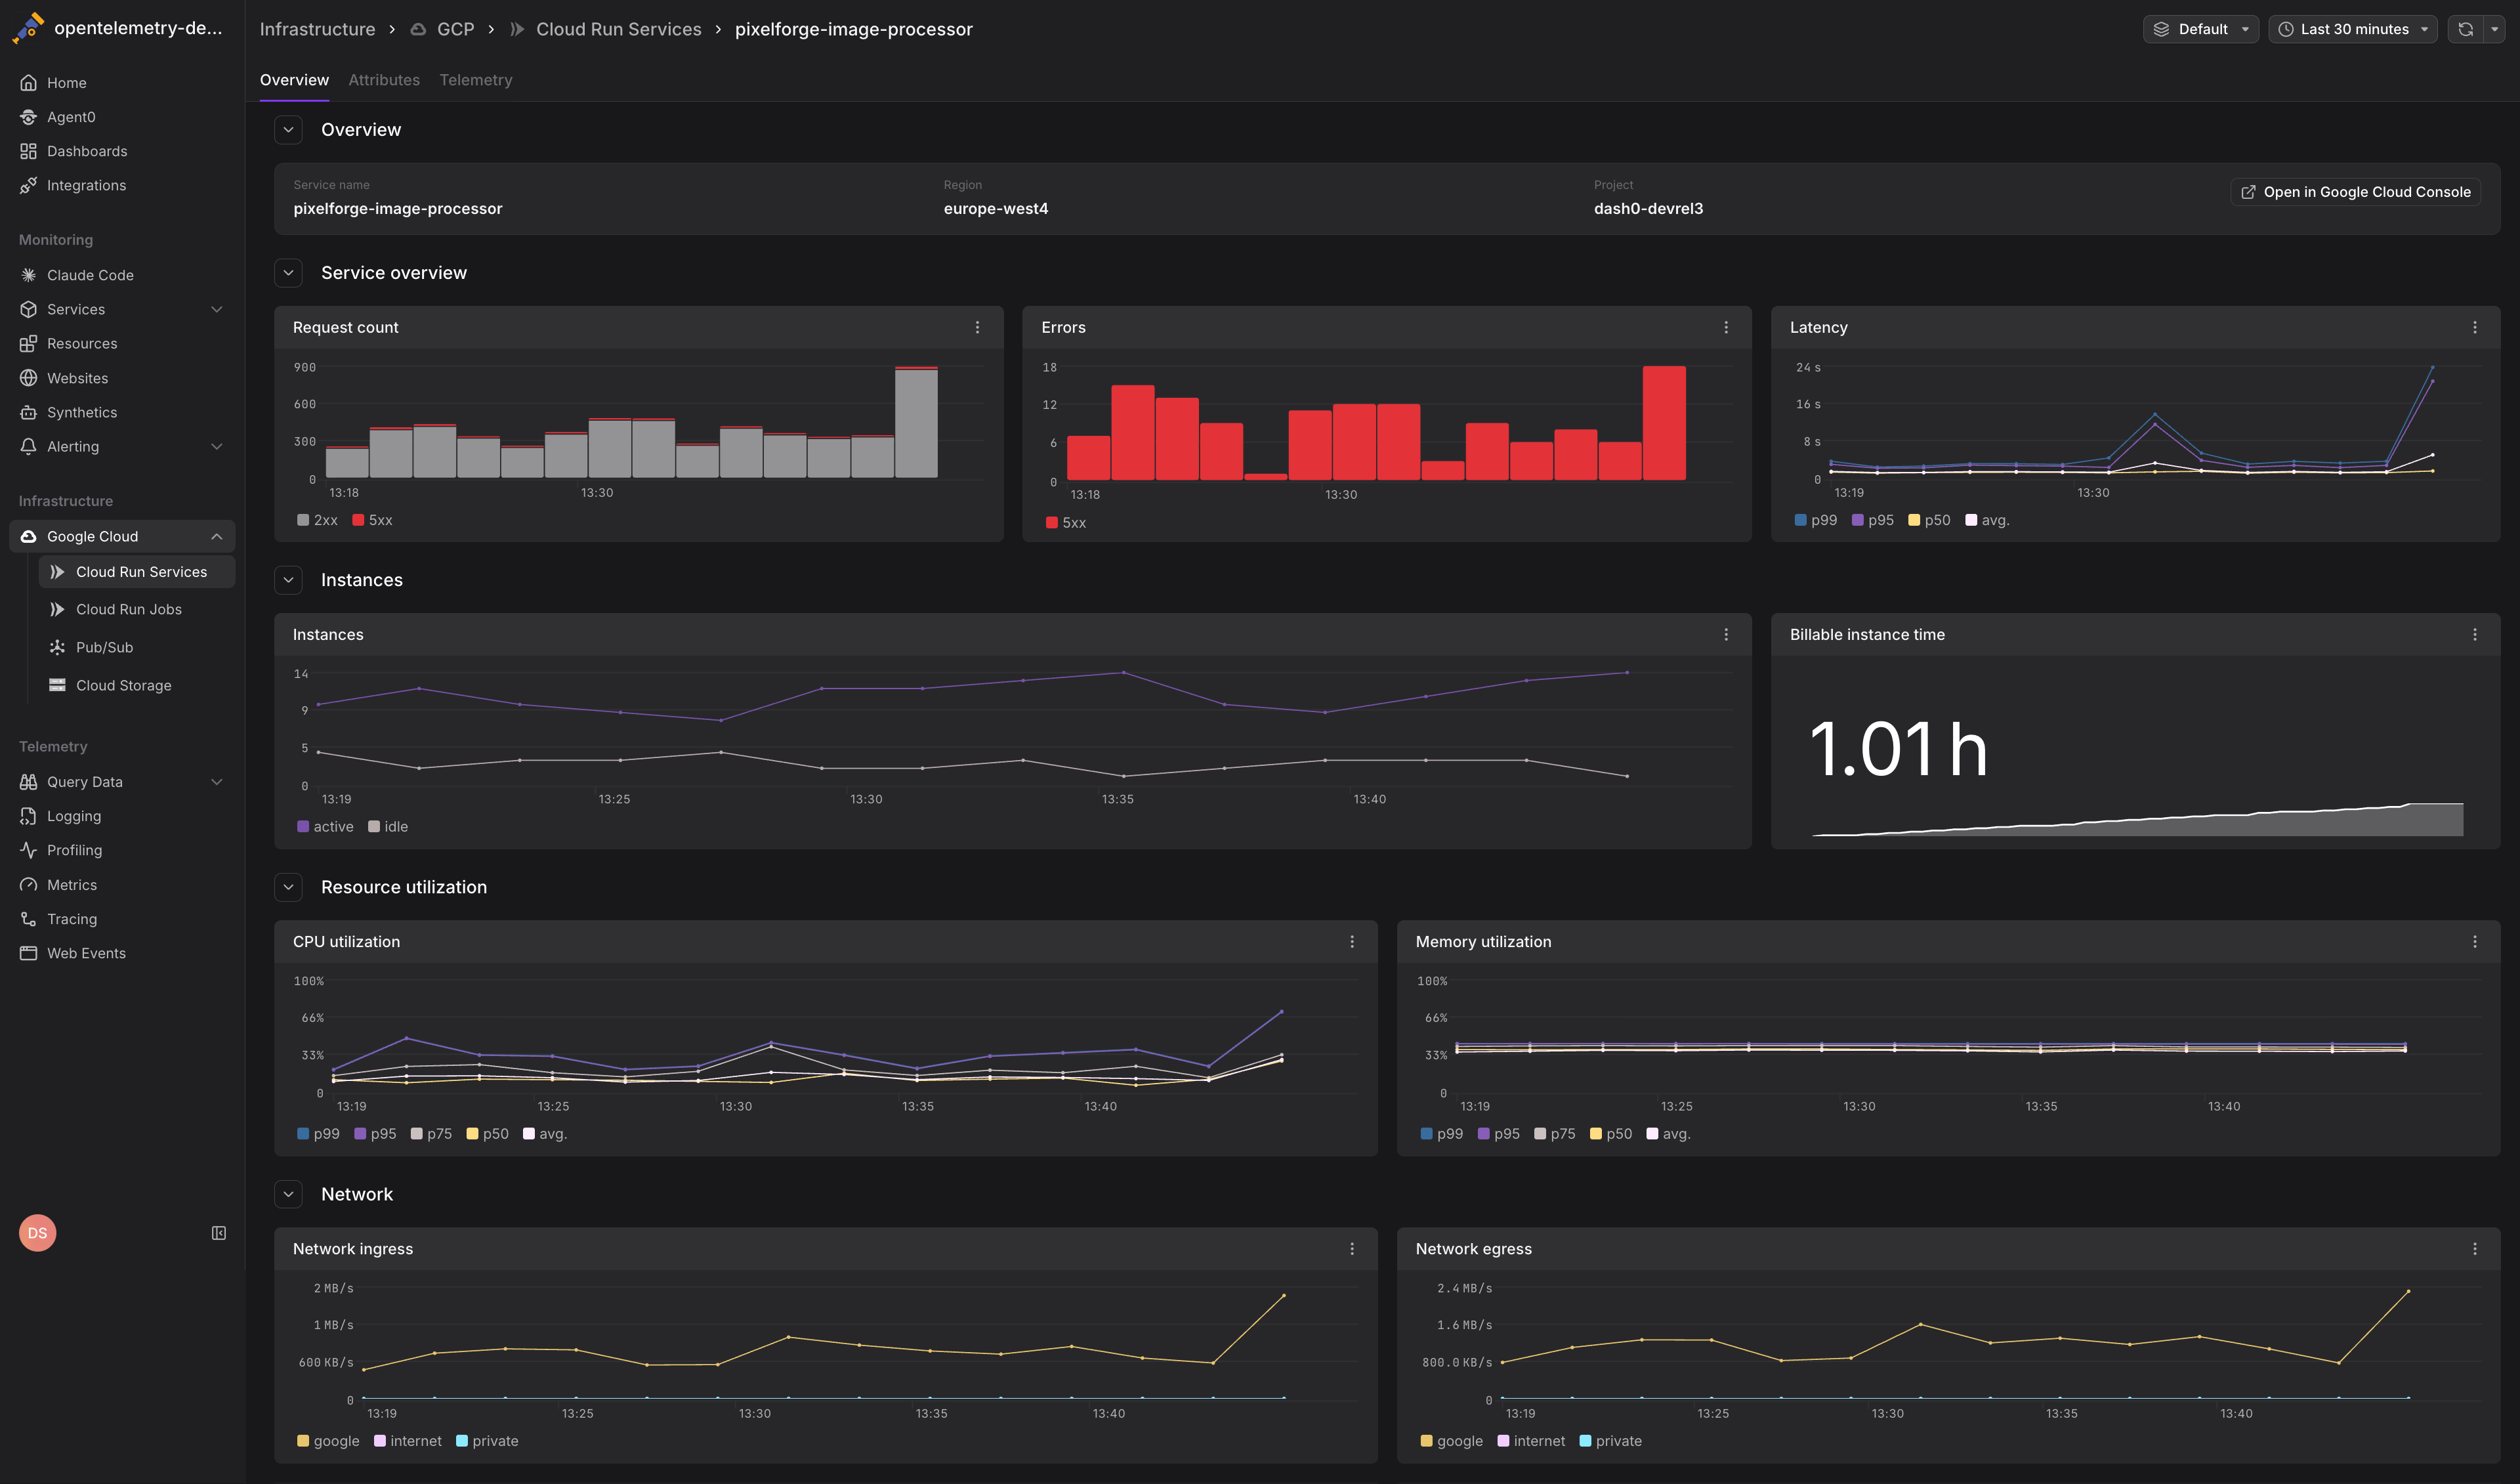
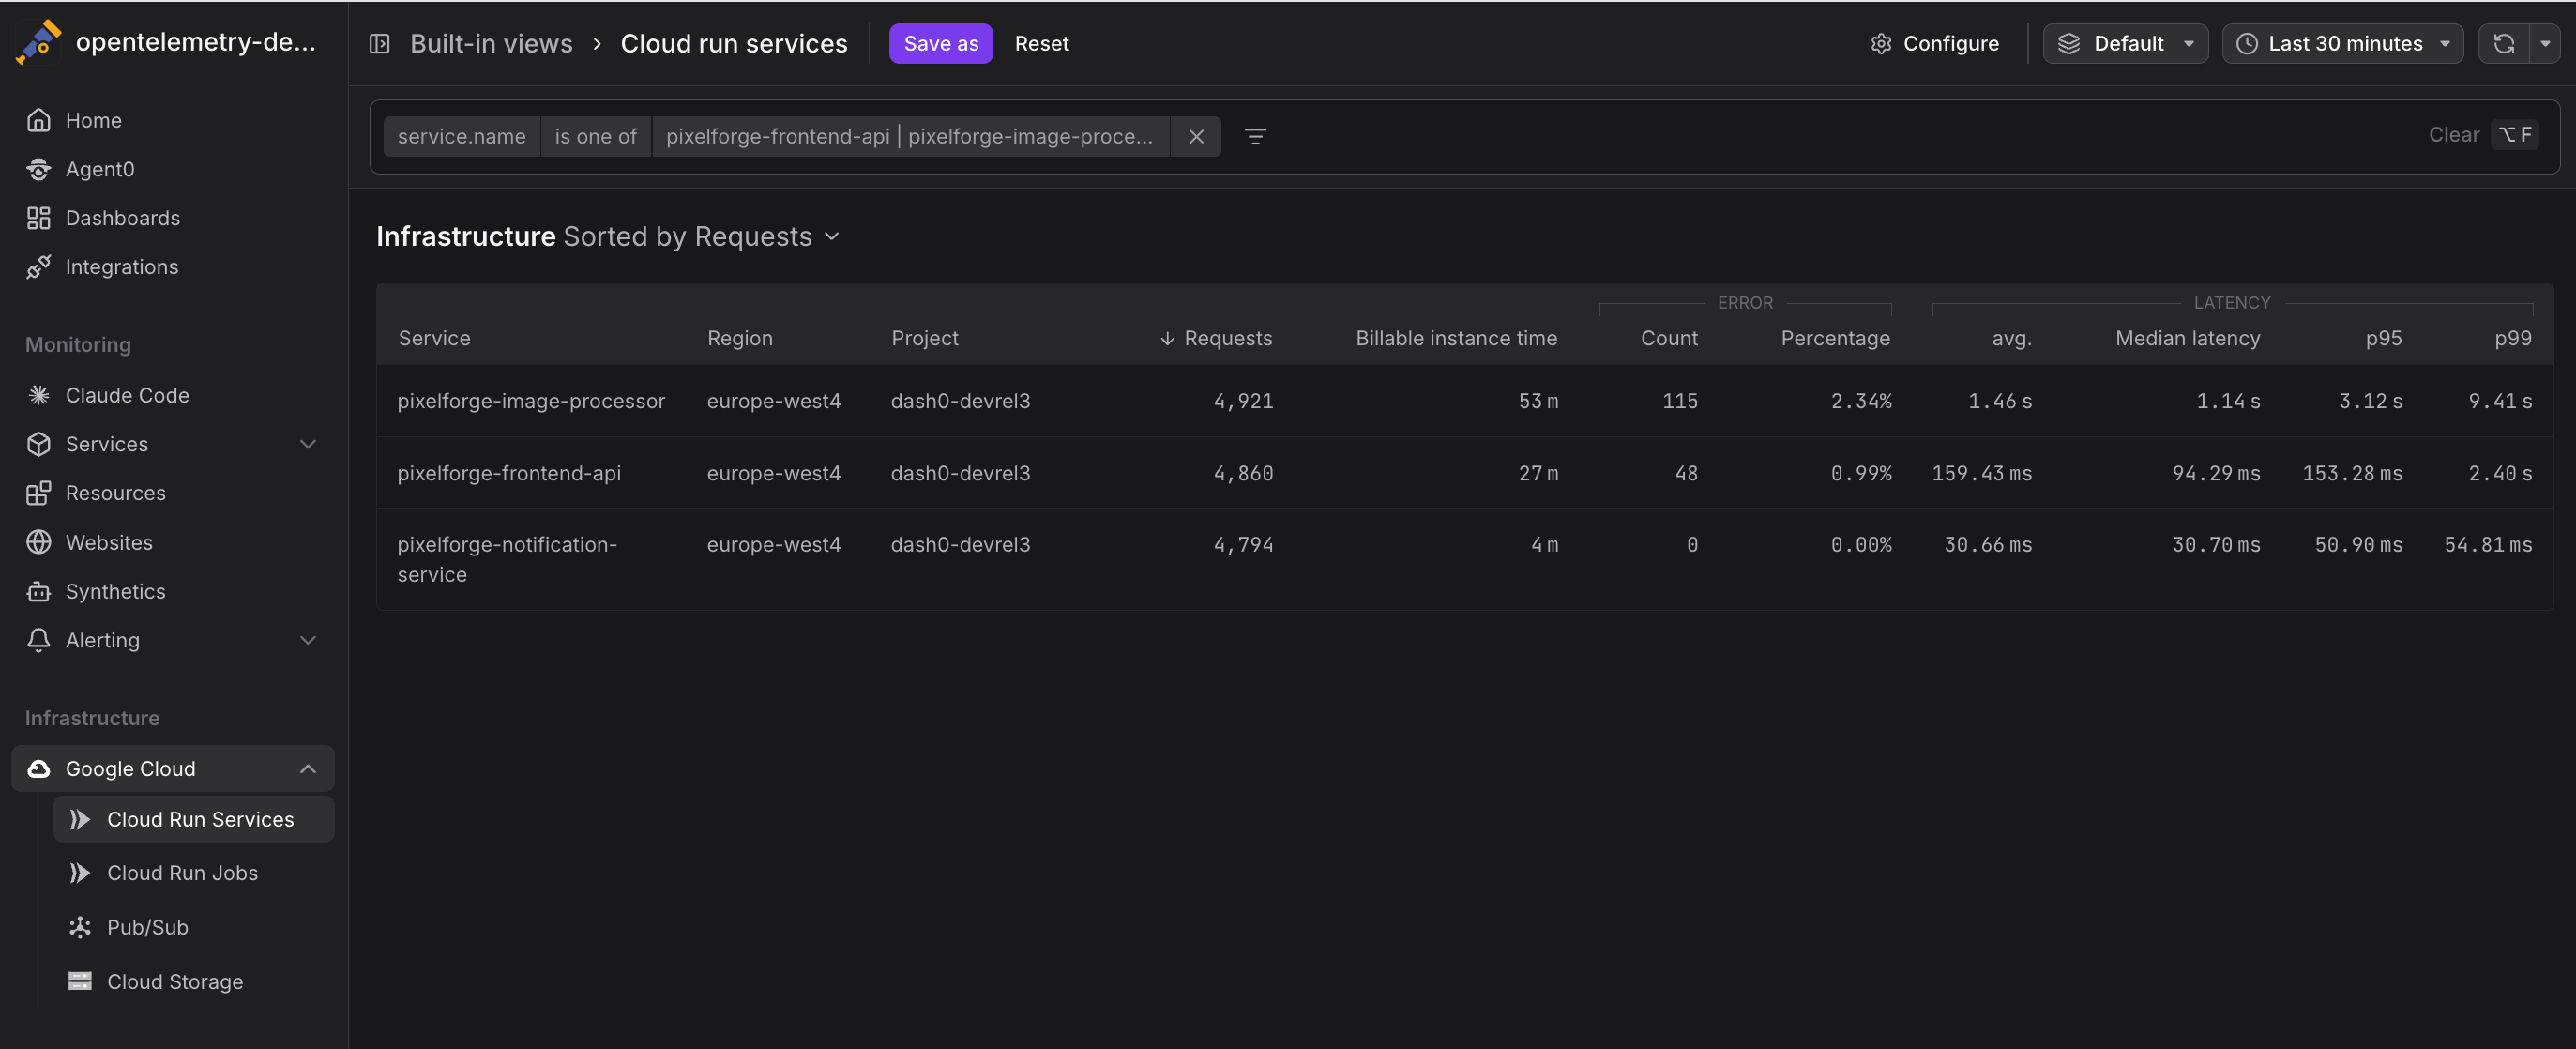
Navigate to Infrastructure > Google Cloud > Cloud Run to see all Cloud Run services across your connected projects. The view displays:
- Service name and region for each Cloud Run service
- Key performance indicators including request rate, error rate, and latency percentiles
- Resource utilization showing CPU and memory usage
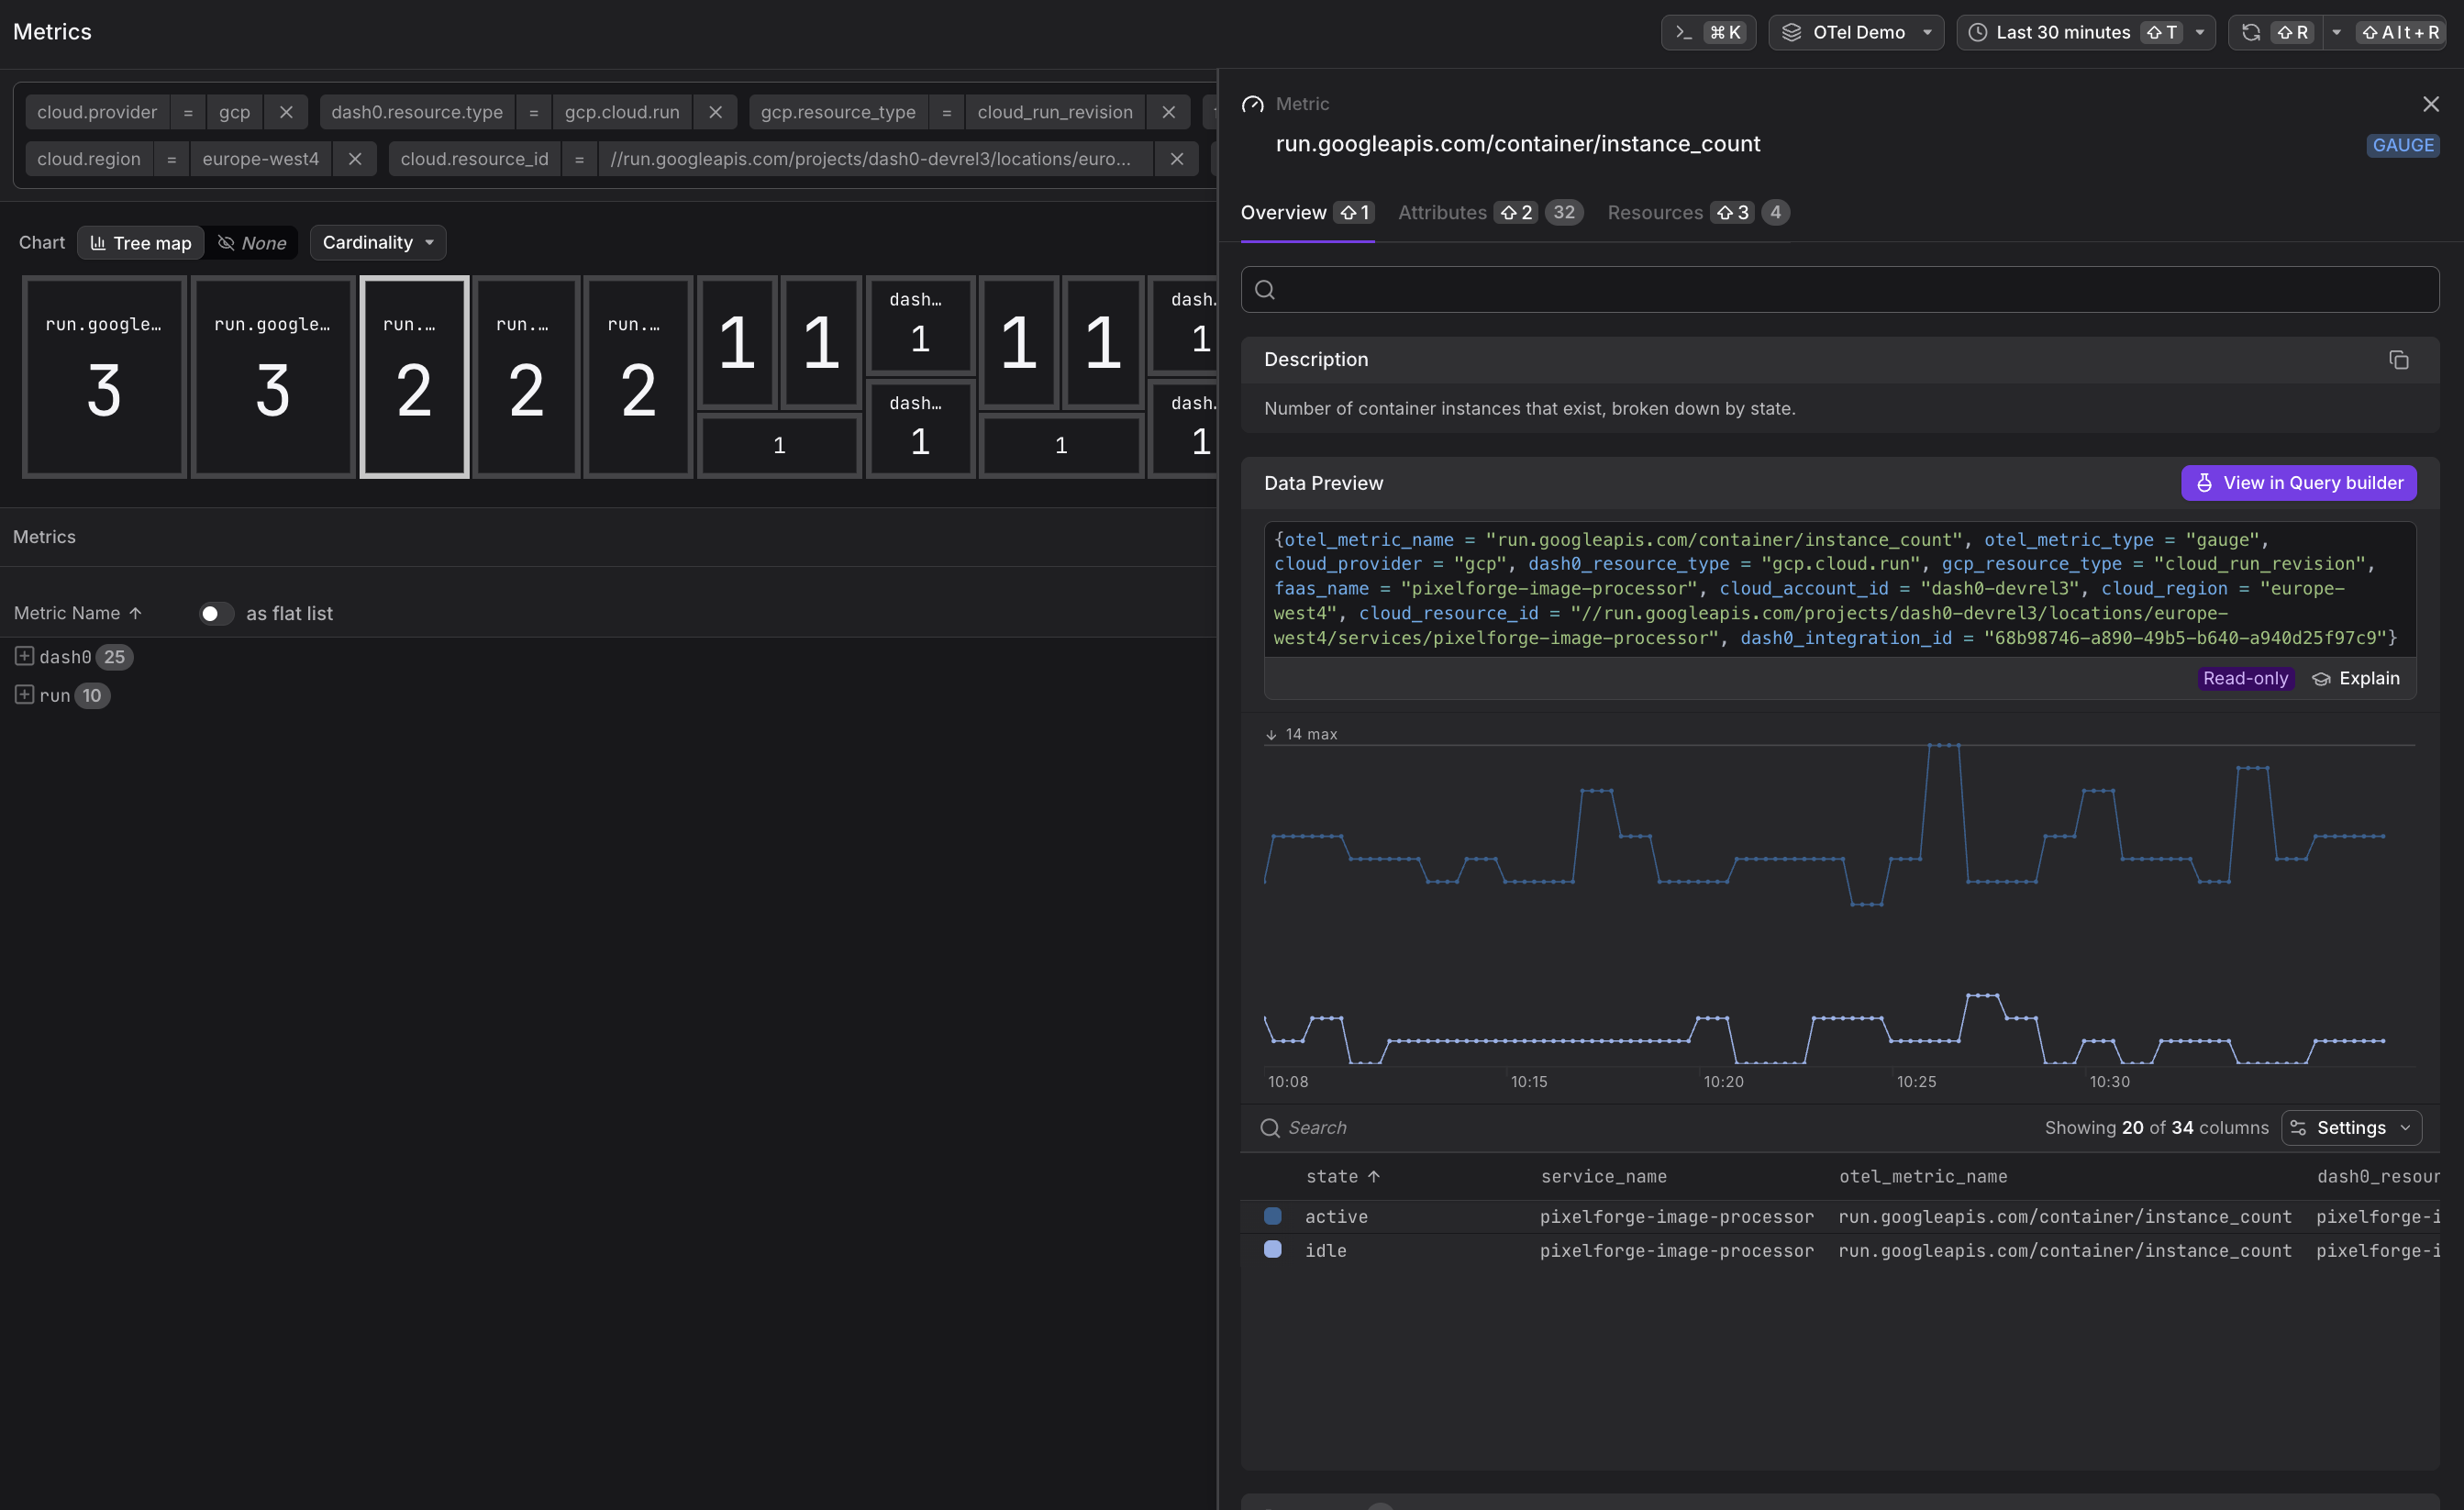
- Instance counts indicating current and maximum concurrency
Click any service to drill into detailed metrics and time-series charts.
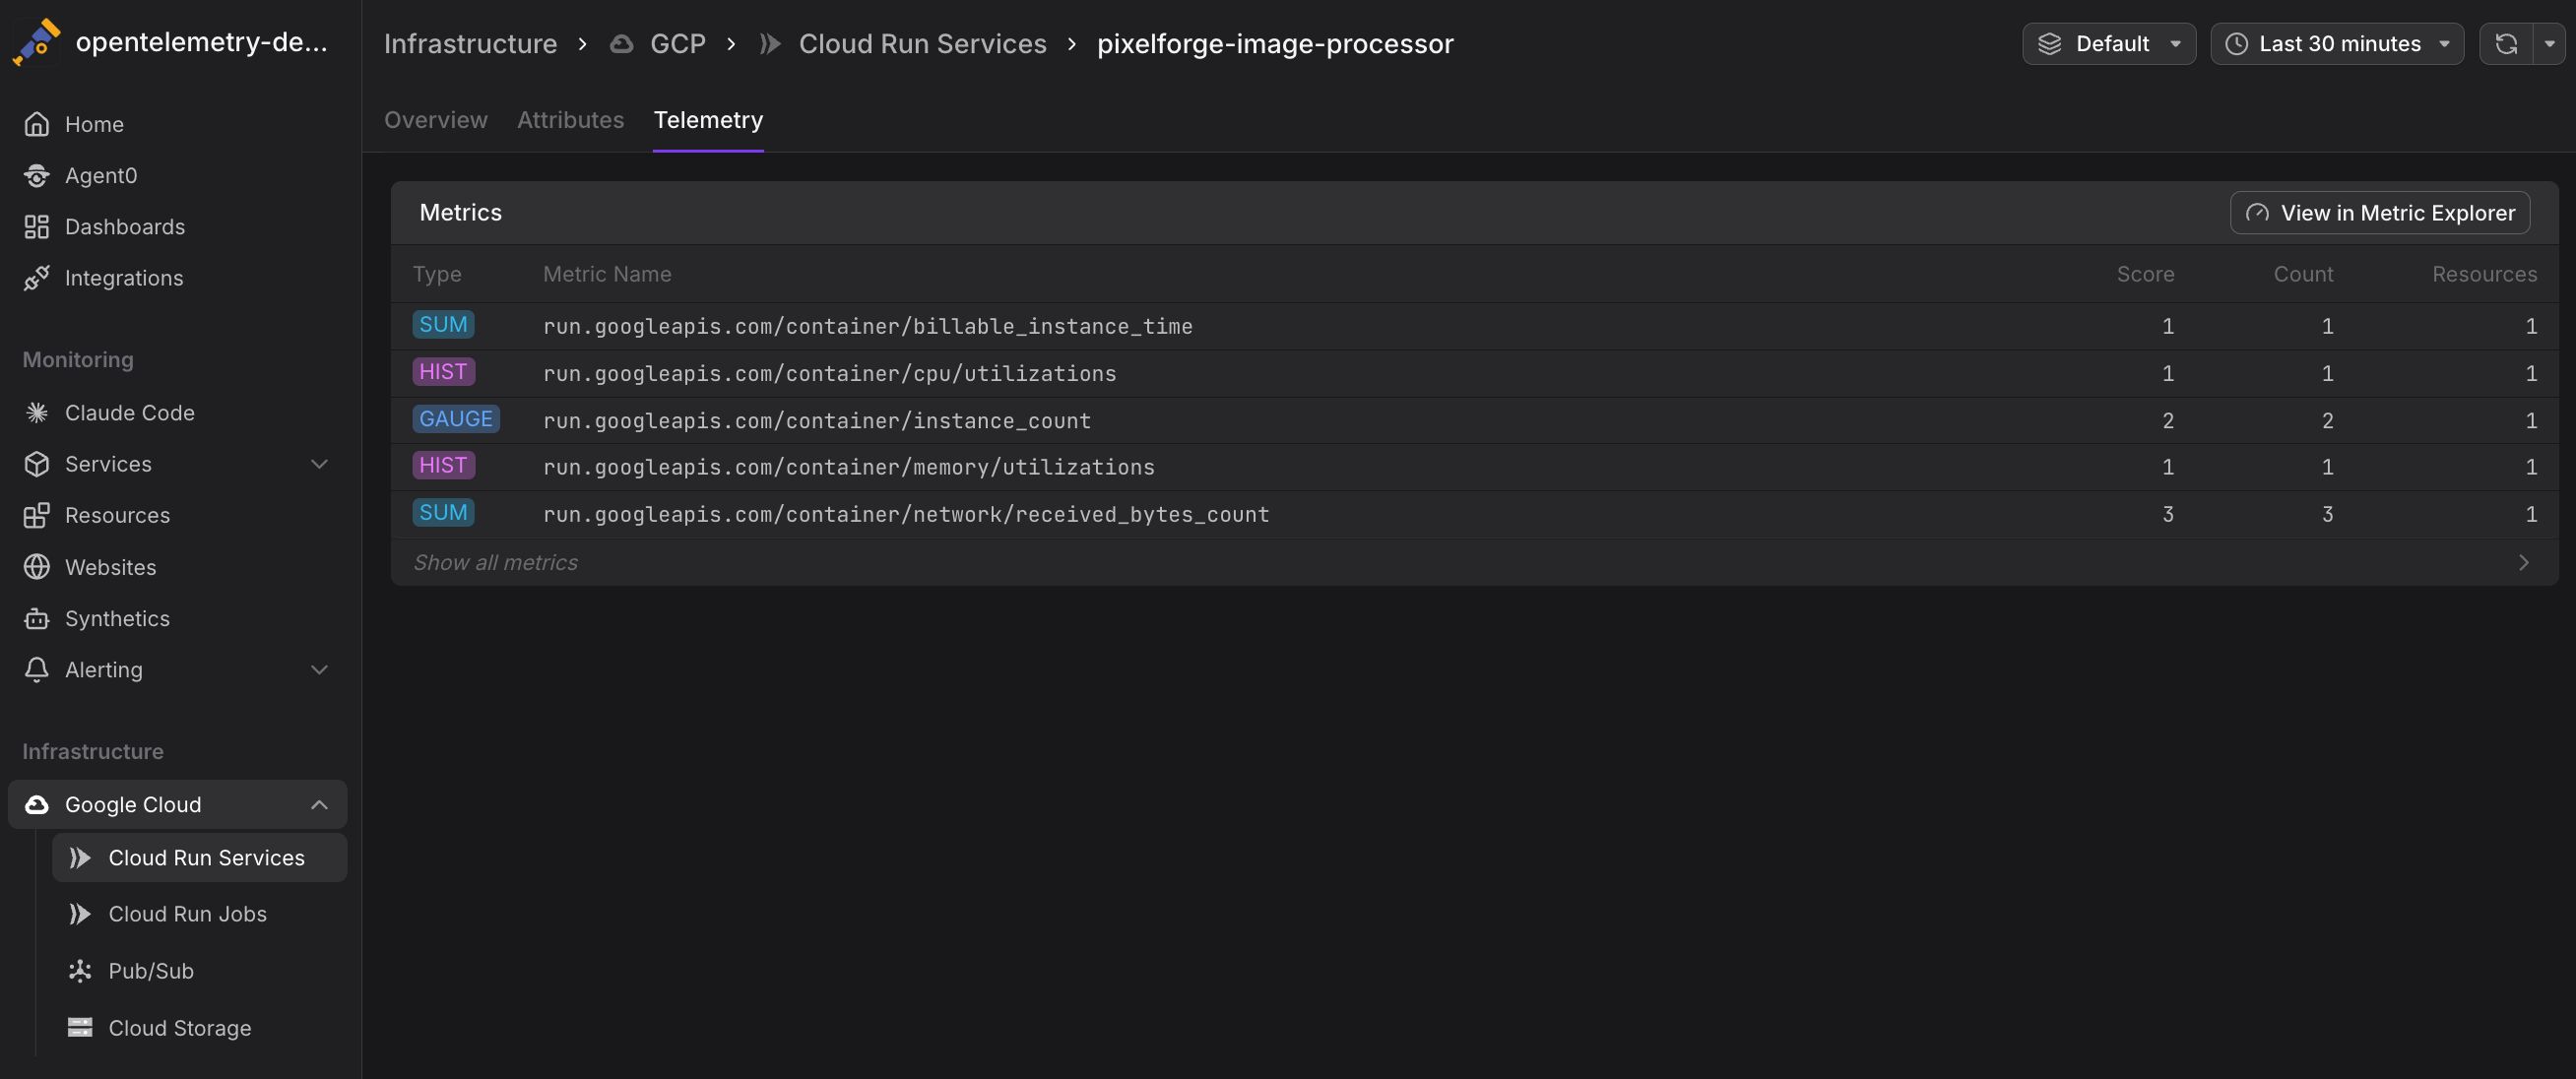
Available Metrics
Dash0 collects the following Cloud Run service metrics from Google Cloud Monitoring. Metrics are stored using their GCP Cloud Monitoring metric type names and can be queried using otel_metric_name in PromQL.
Request Metrics
run.googleapis.com/request_count— Total number of requests receivedrun.googleapis.com/request_latencies— Request latency distribution (histogram)
Resource Utilization
-
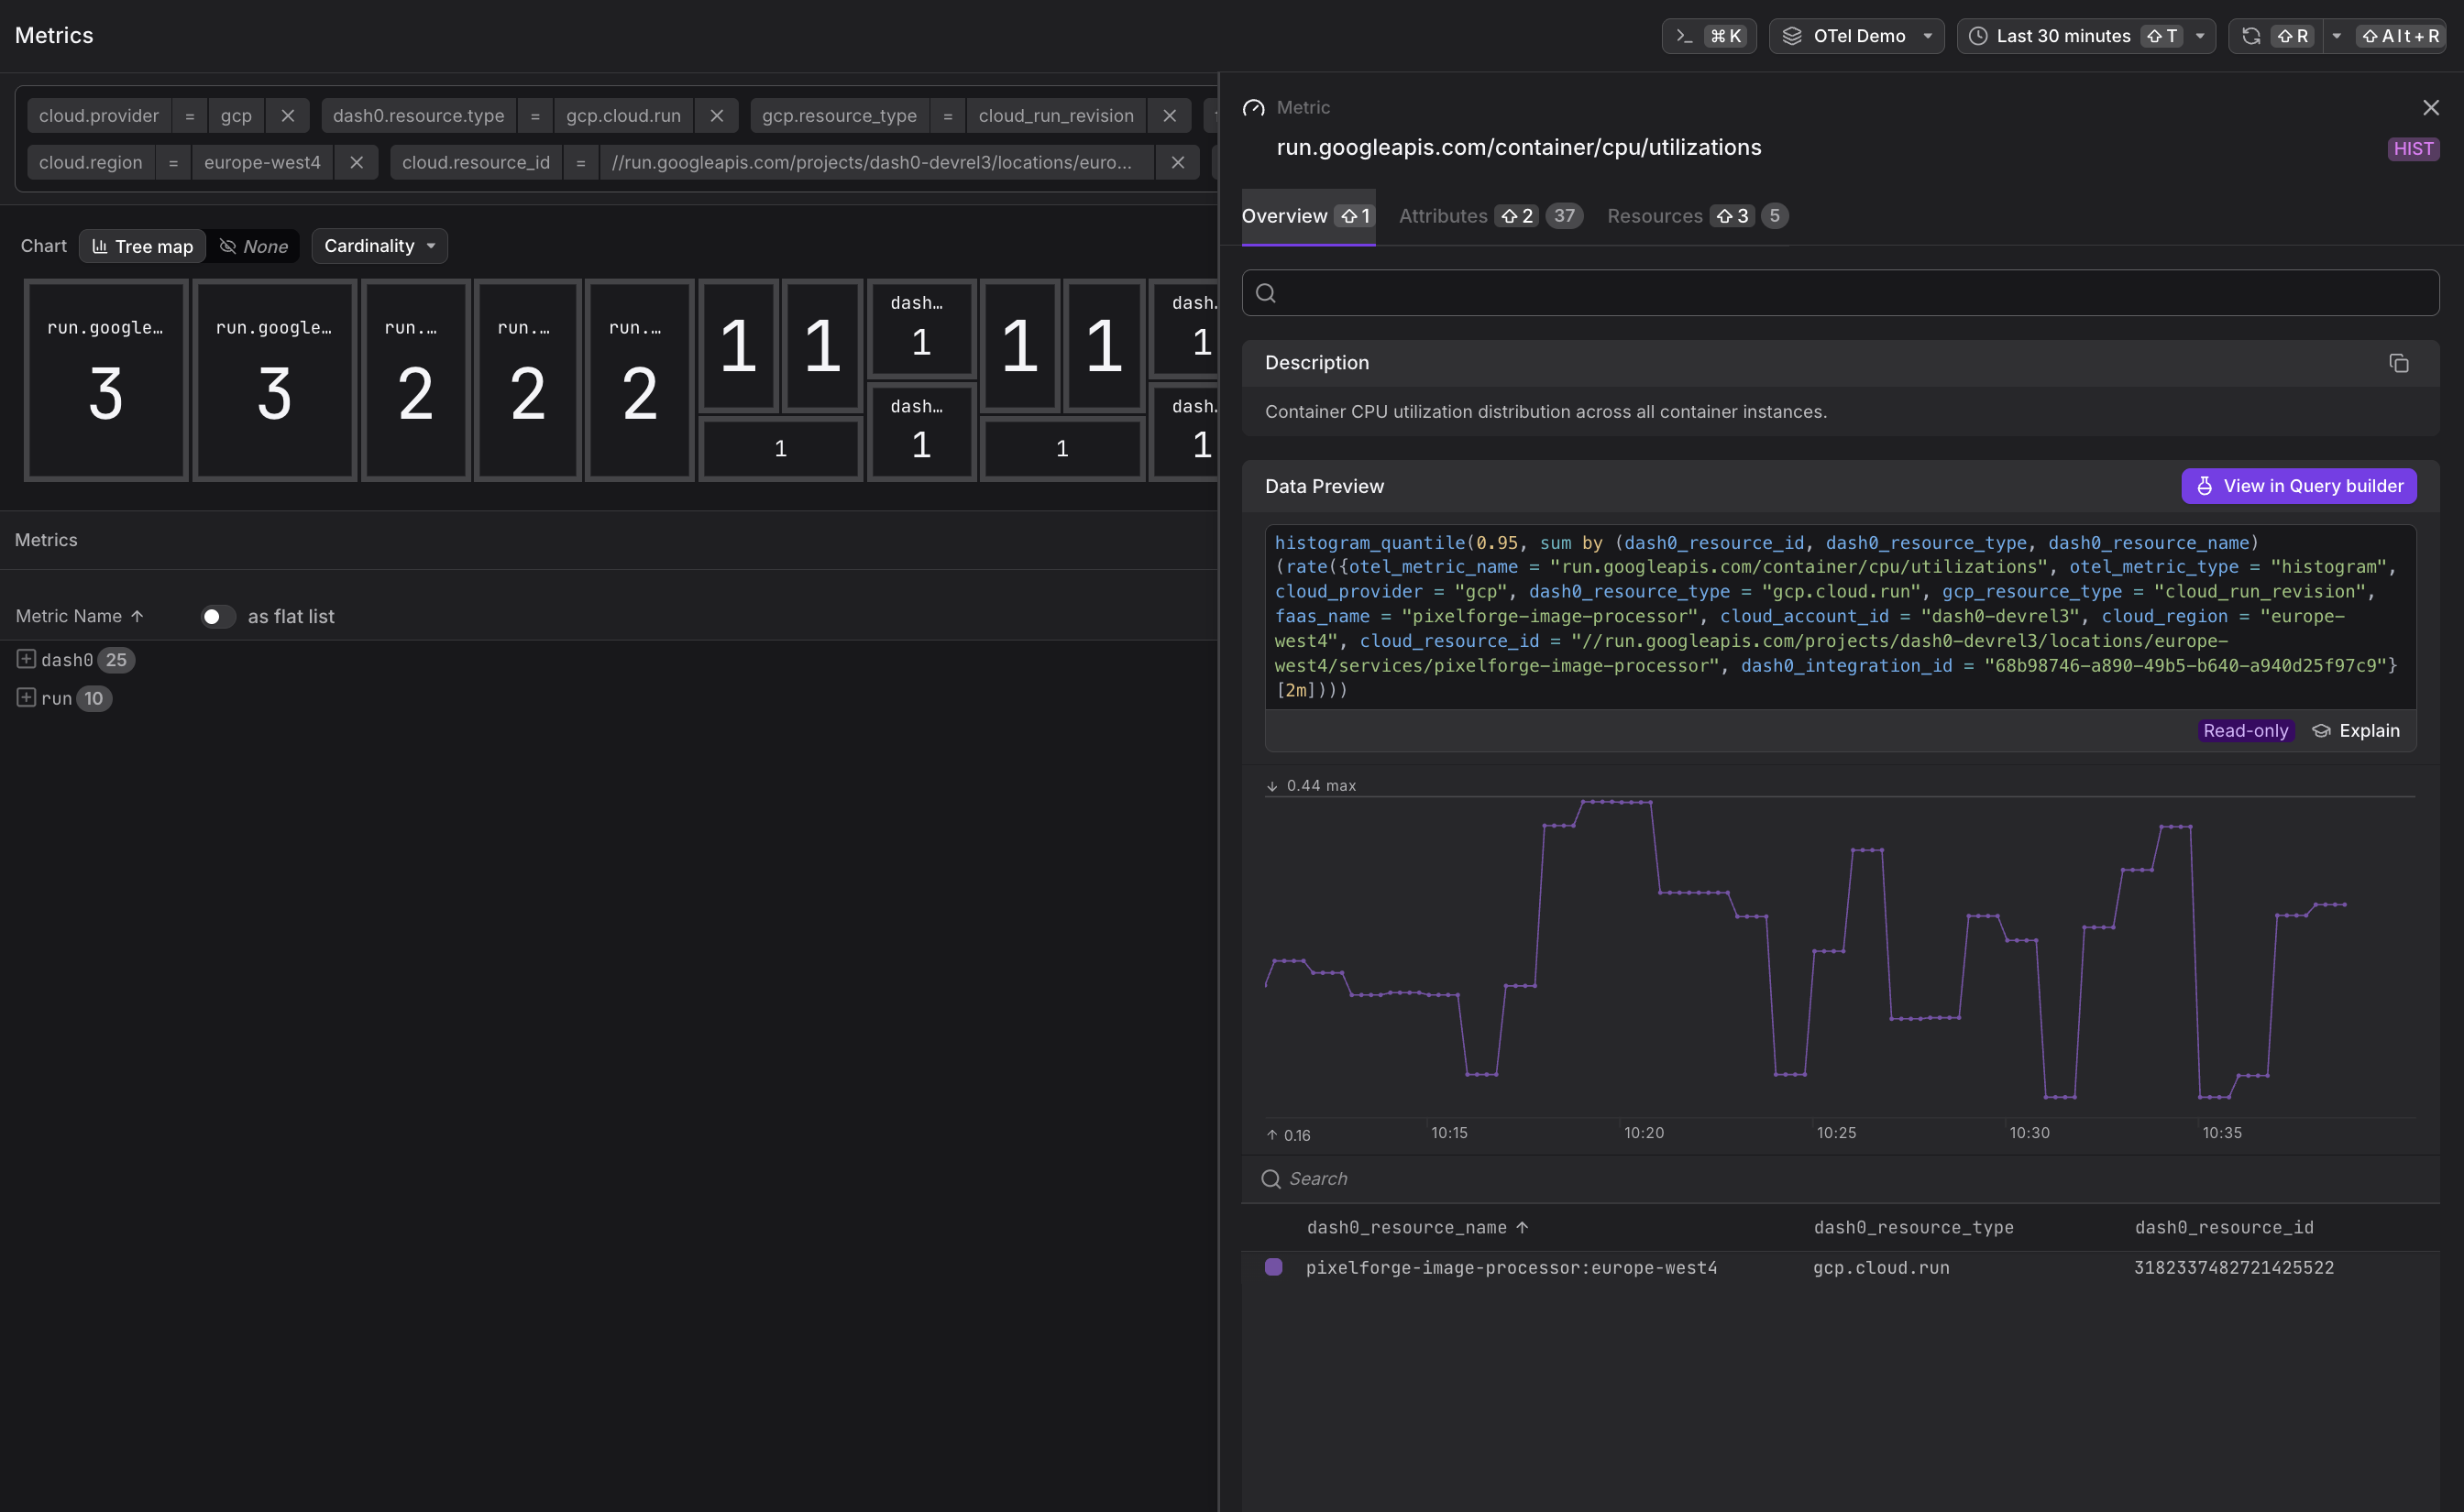
run.googleapis.com/container/cpu/utilizations— CPU utilization distribution (histogram)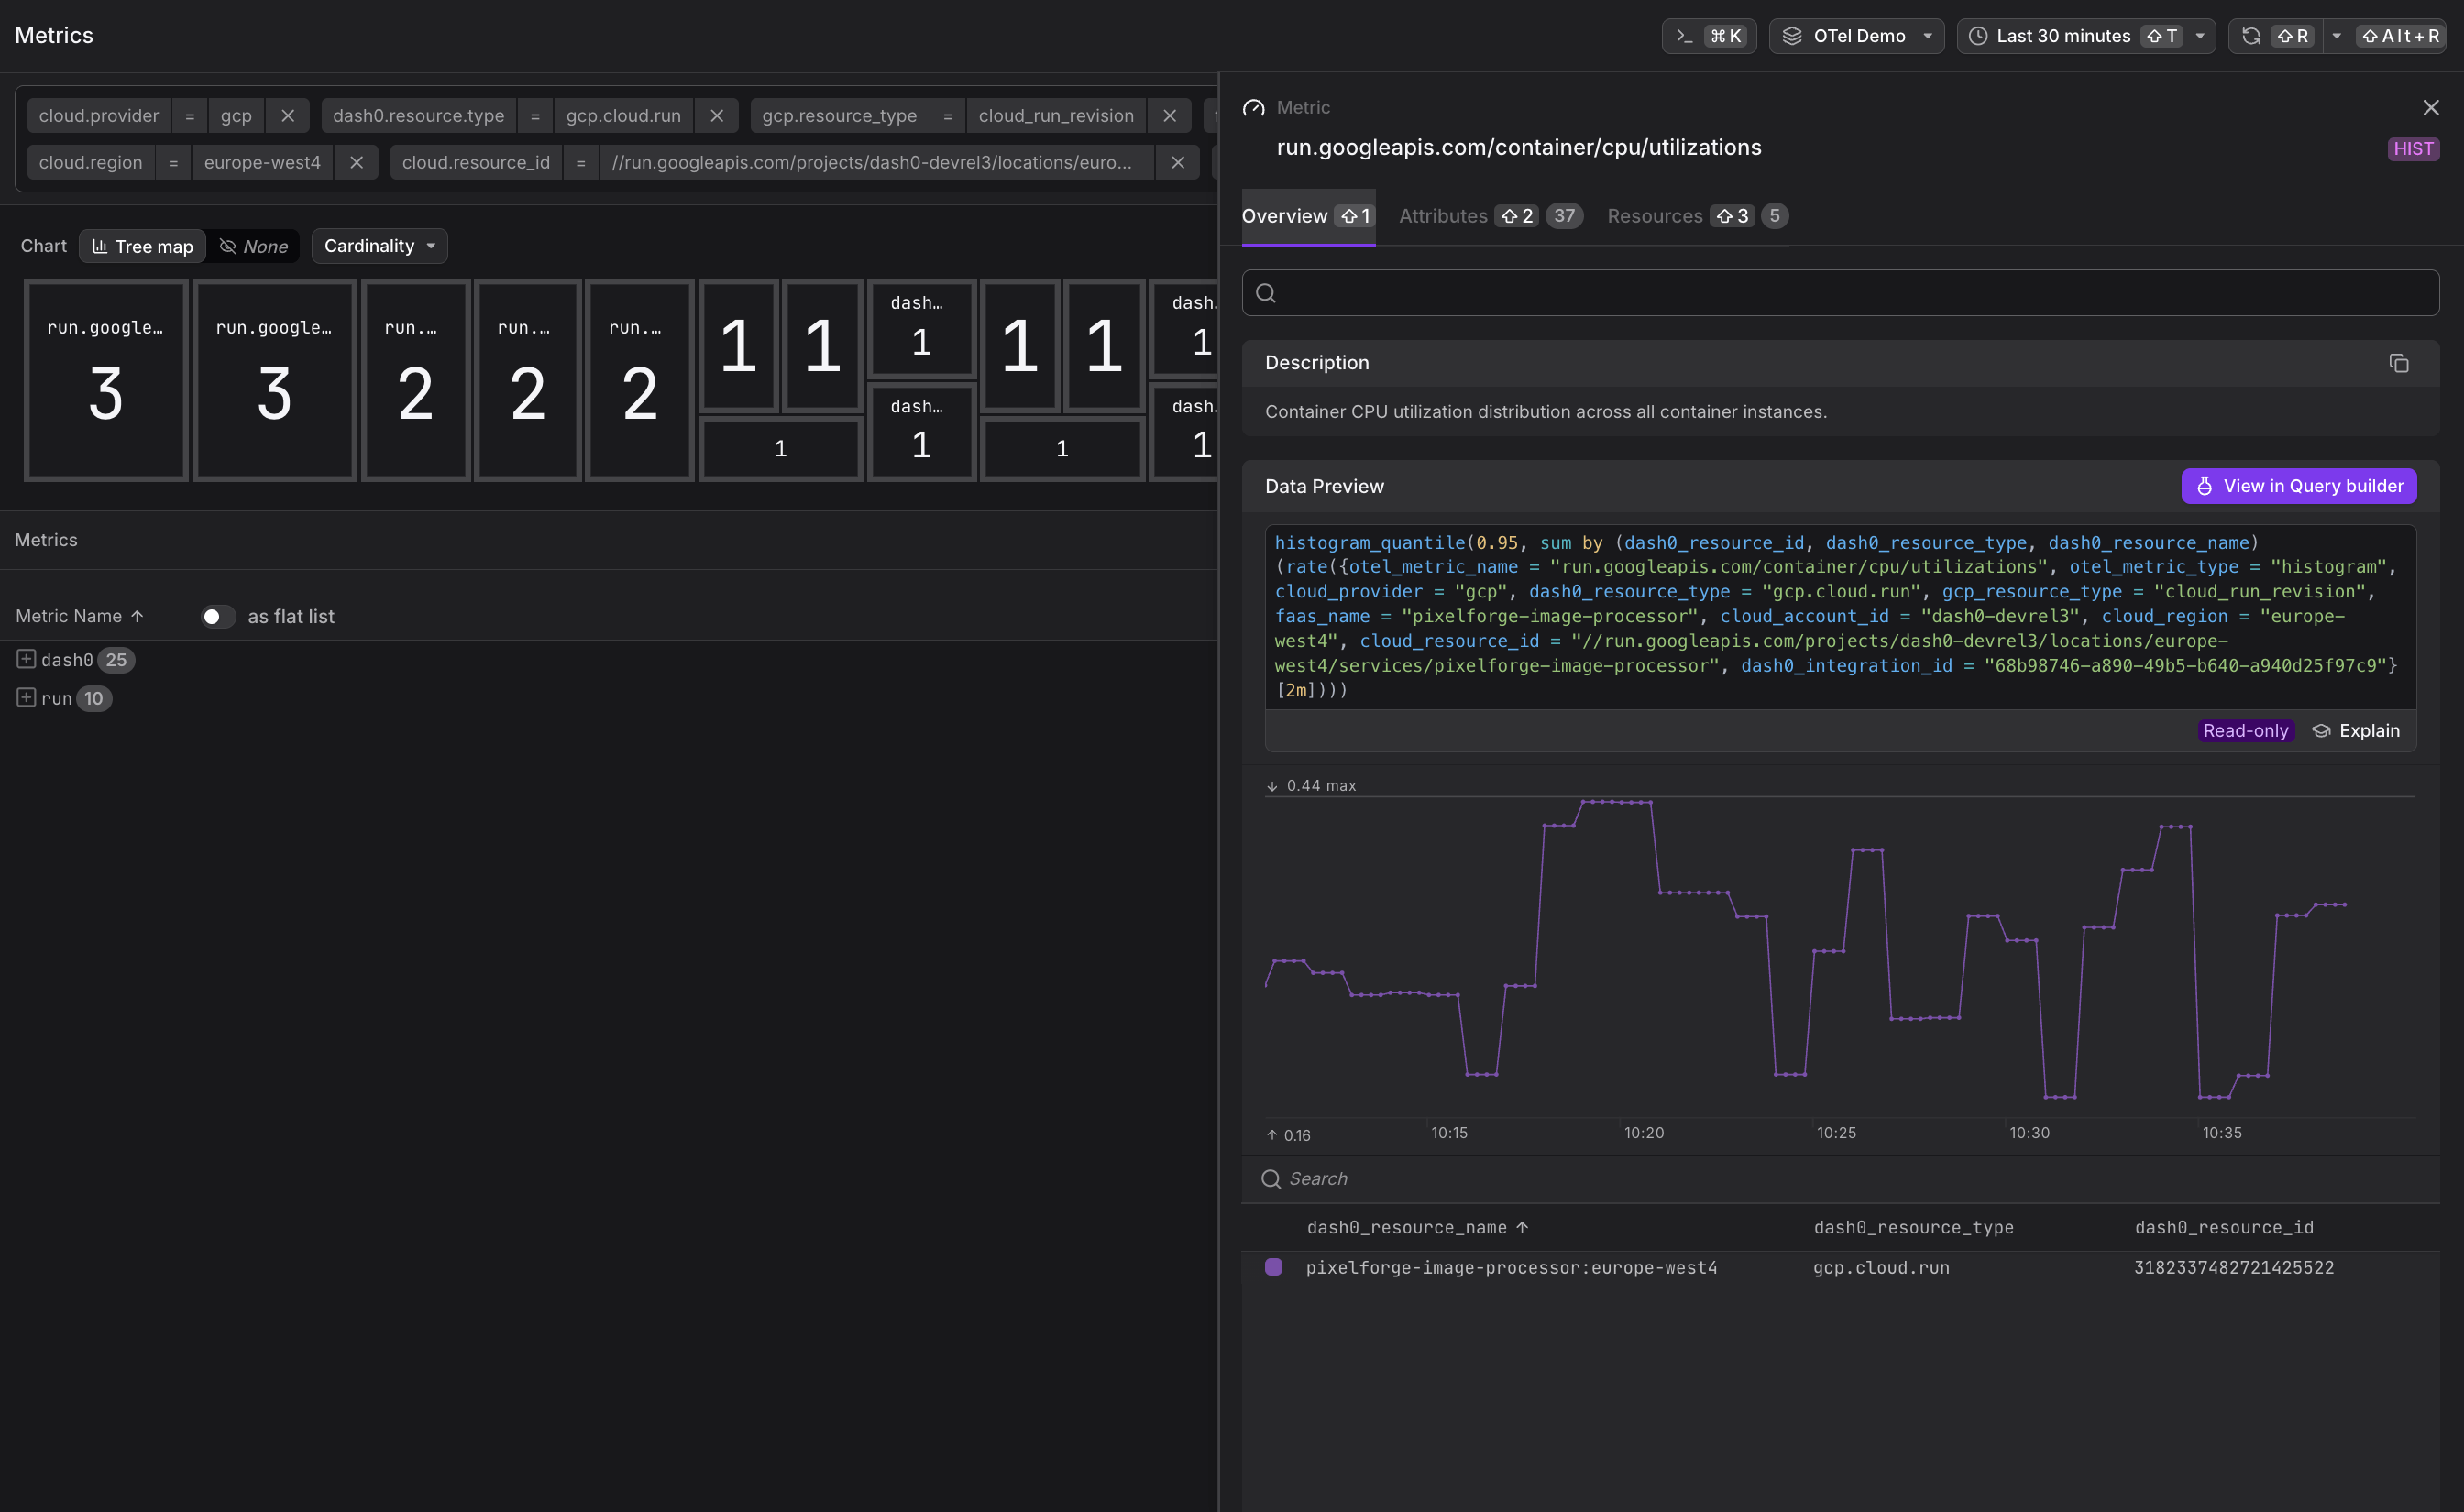
-
run.googleapis.com/container/memory/utilizations— Memory utilization distribution (histogram)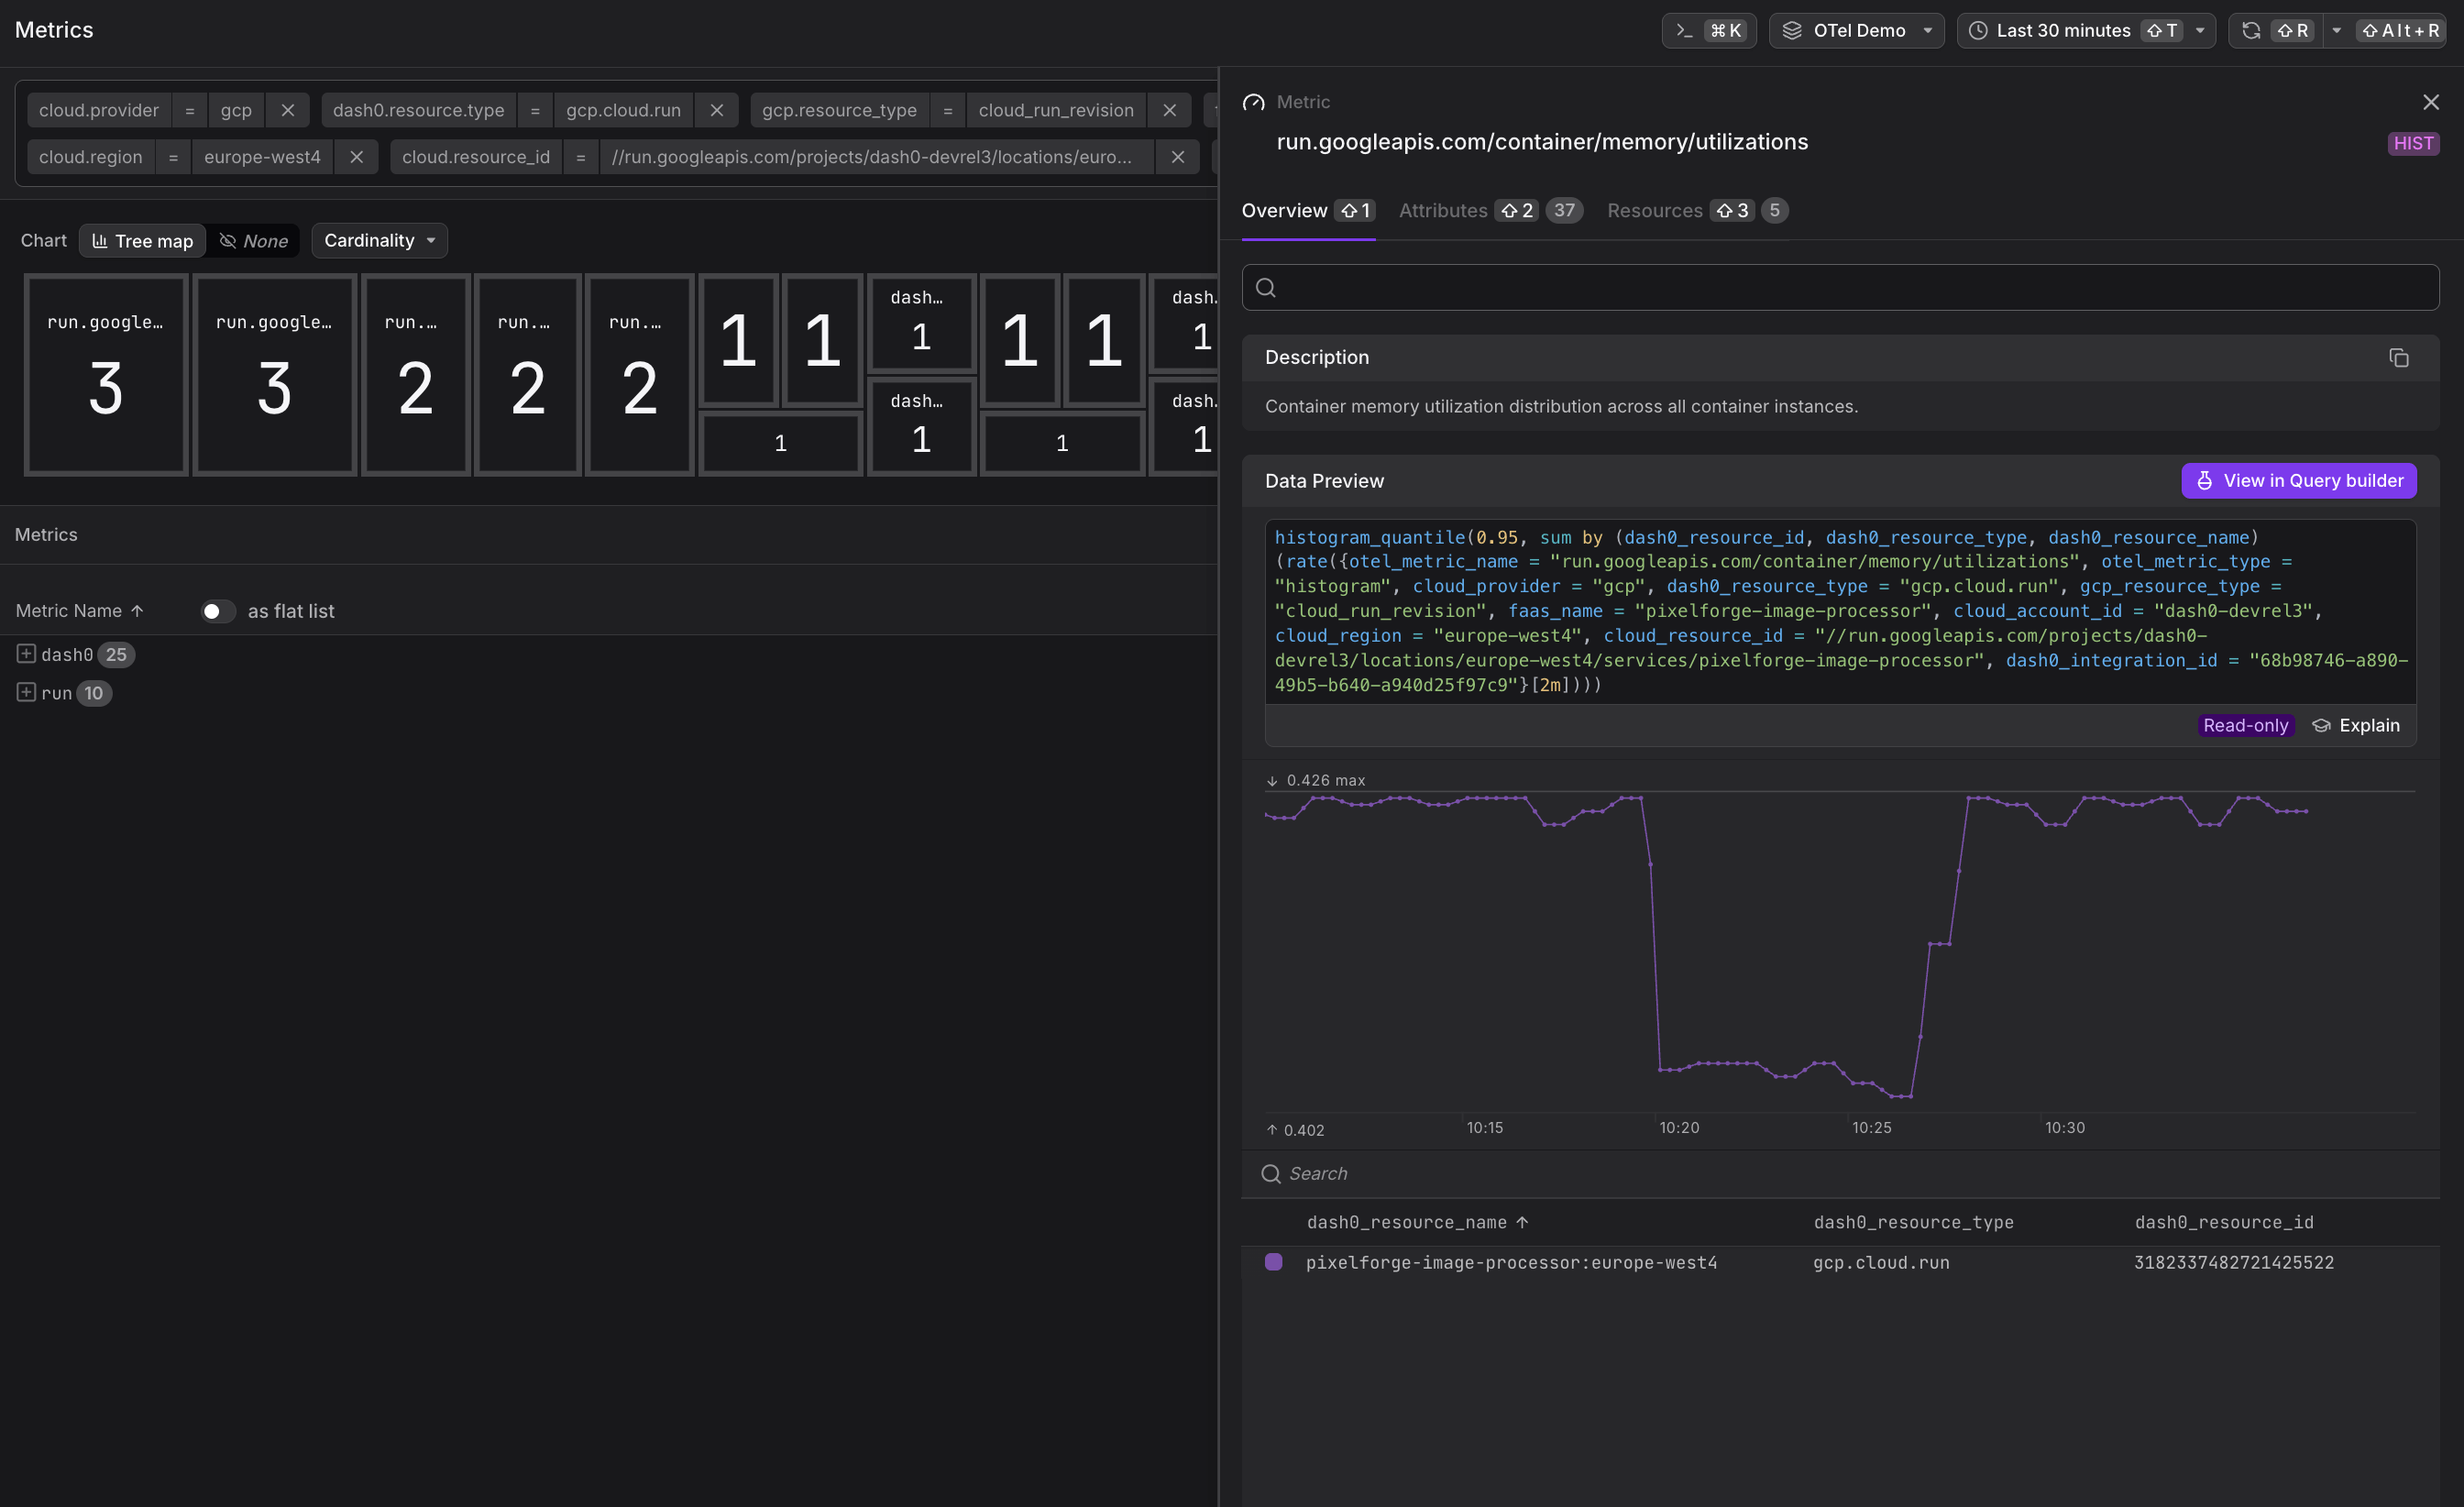

Instance and Concurrency
-
run.googleapis.com/container/instance_count— Current number of running container instances
-
run.googleapis.com/container/max_request_concurrencies— Maximum concurrent requests per instance (histogram)
Network and Cost
-
run.googleapis.com/container/network/sent_bytes_count— Network egress bytes -
run.googleapis.com/container/network/received_bytes_count— Network ingress bytes -
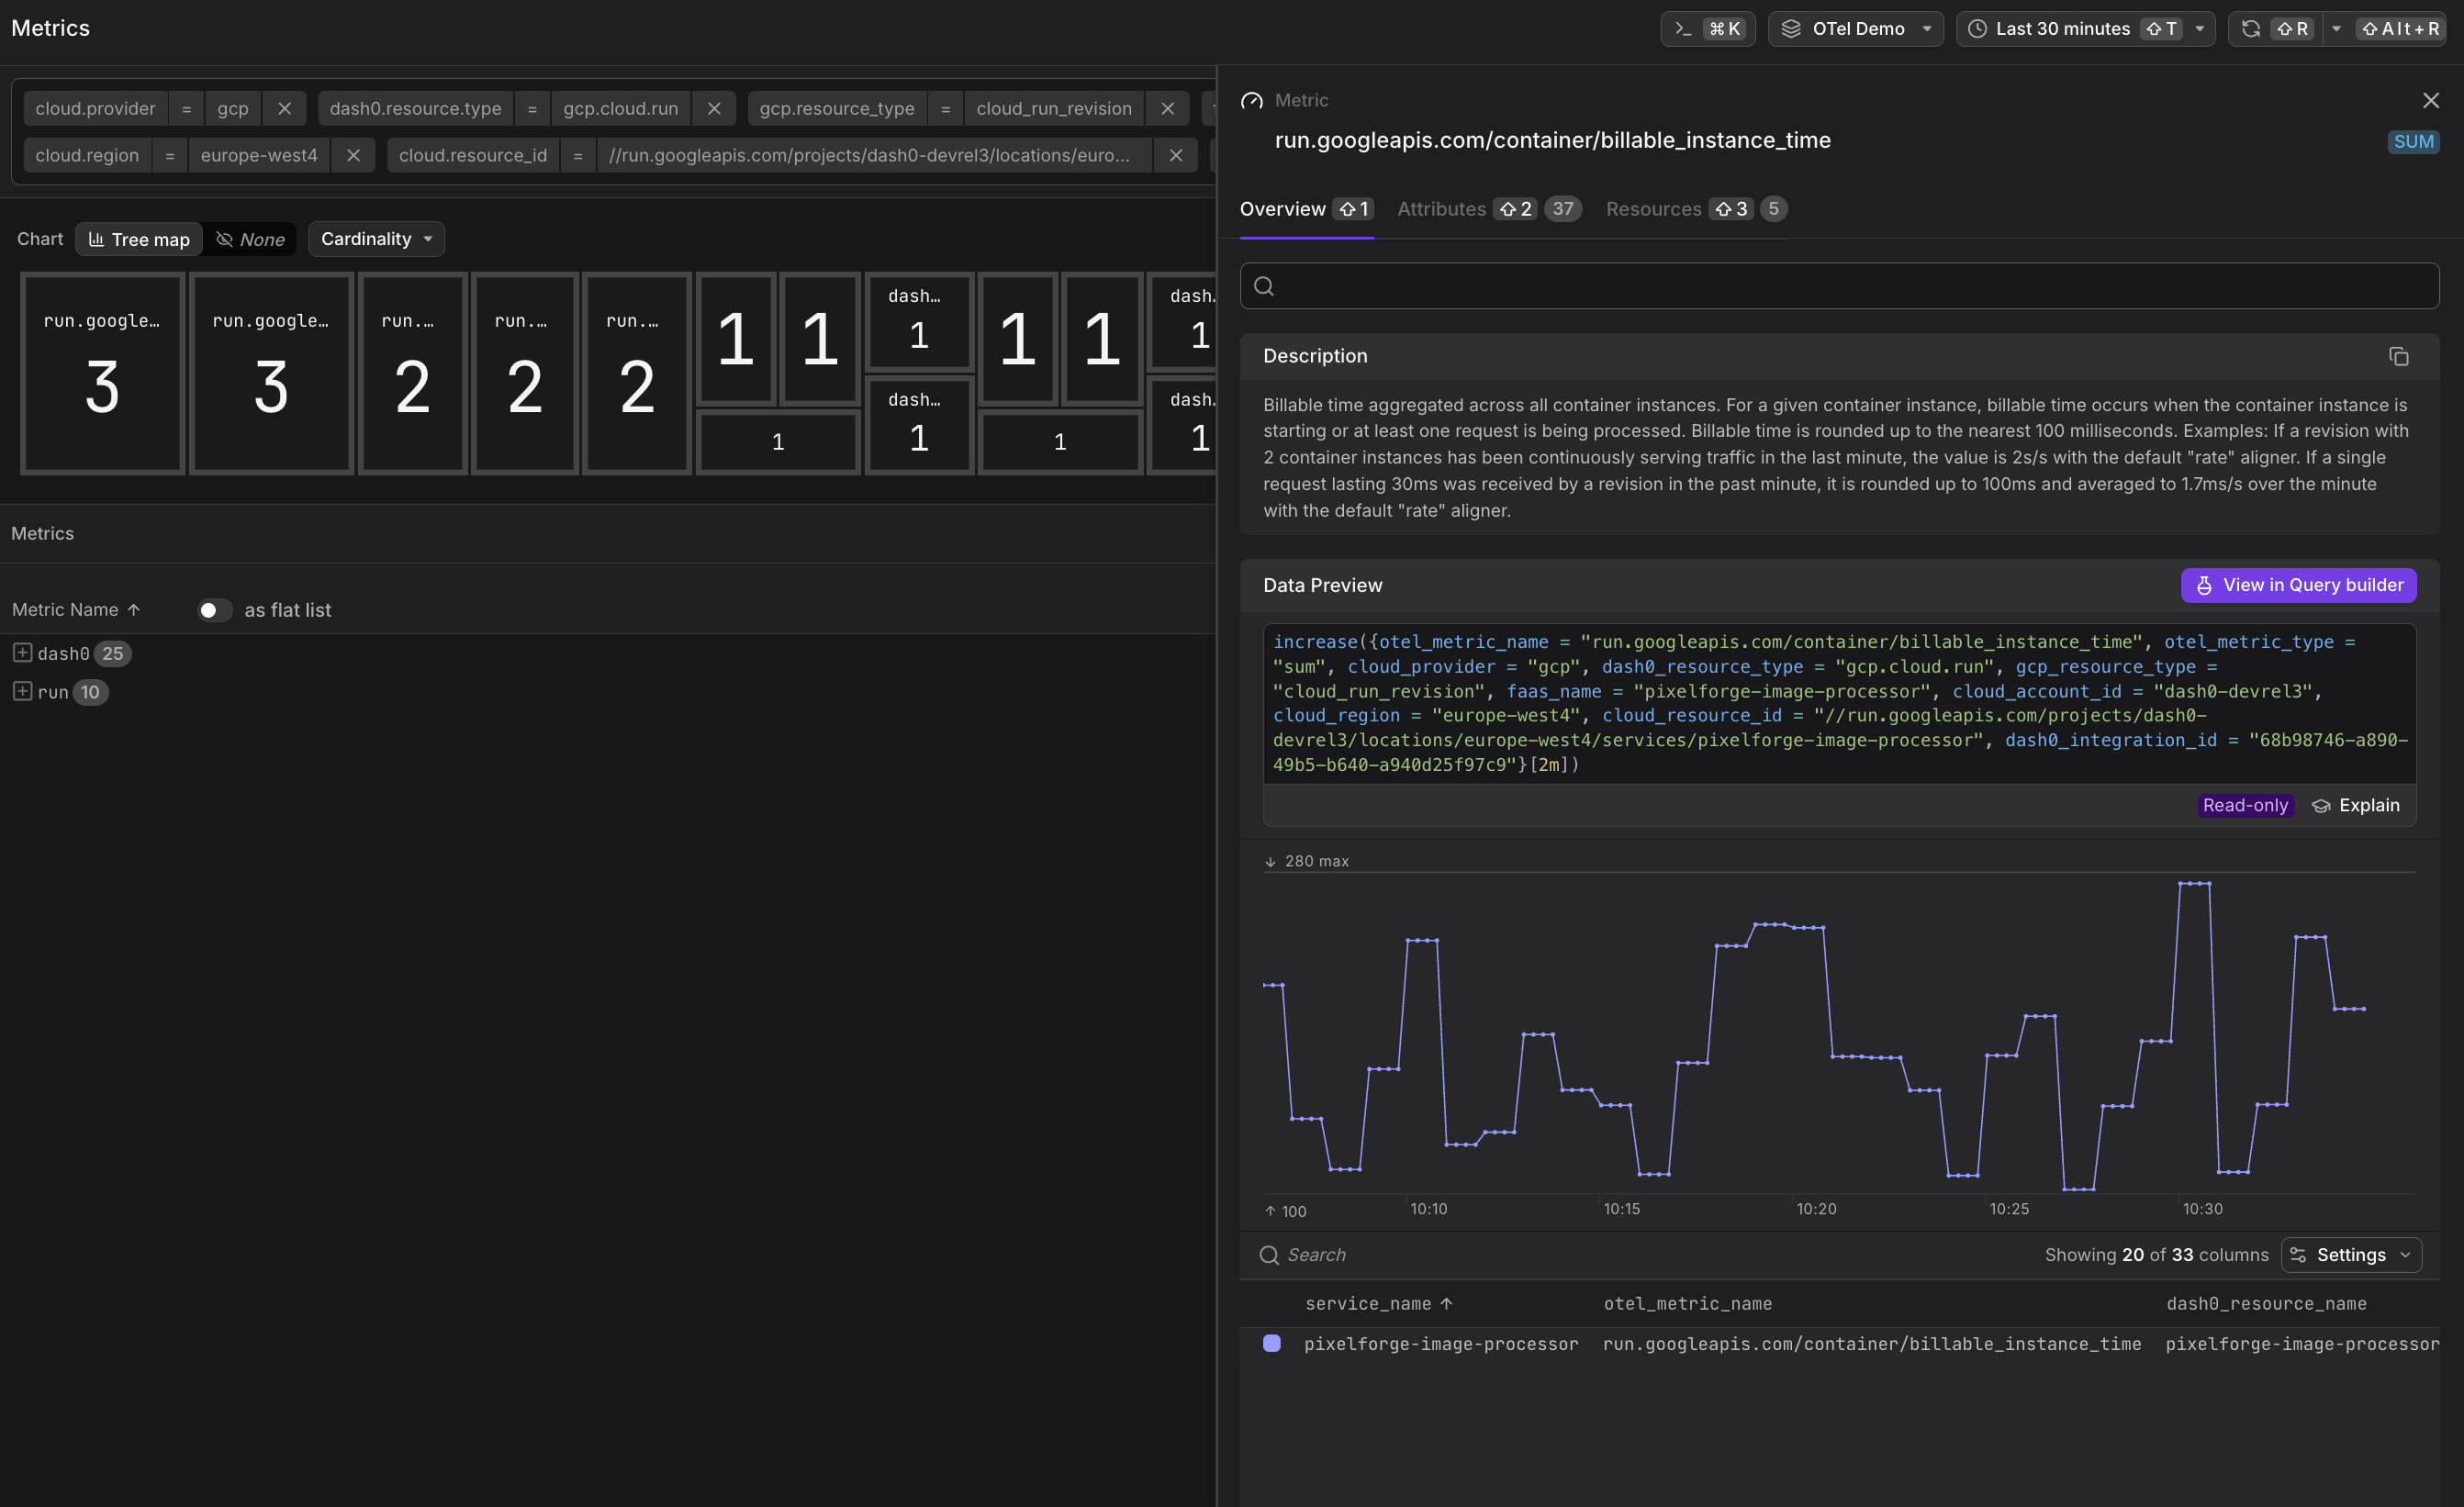
run.googleapis.com/container/billable_instance_time— Billable instance time (used for cost calculation)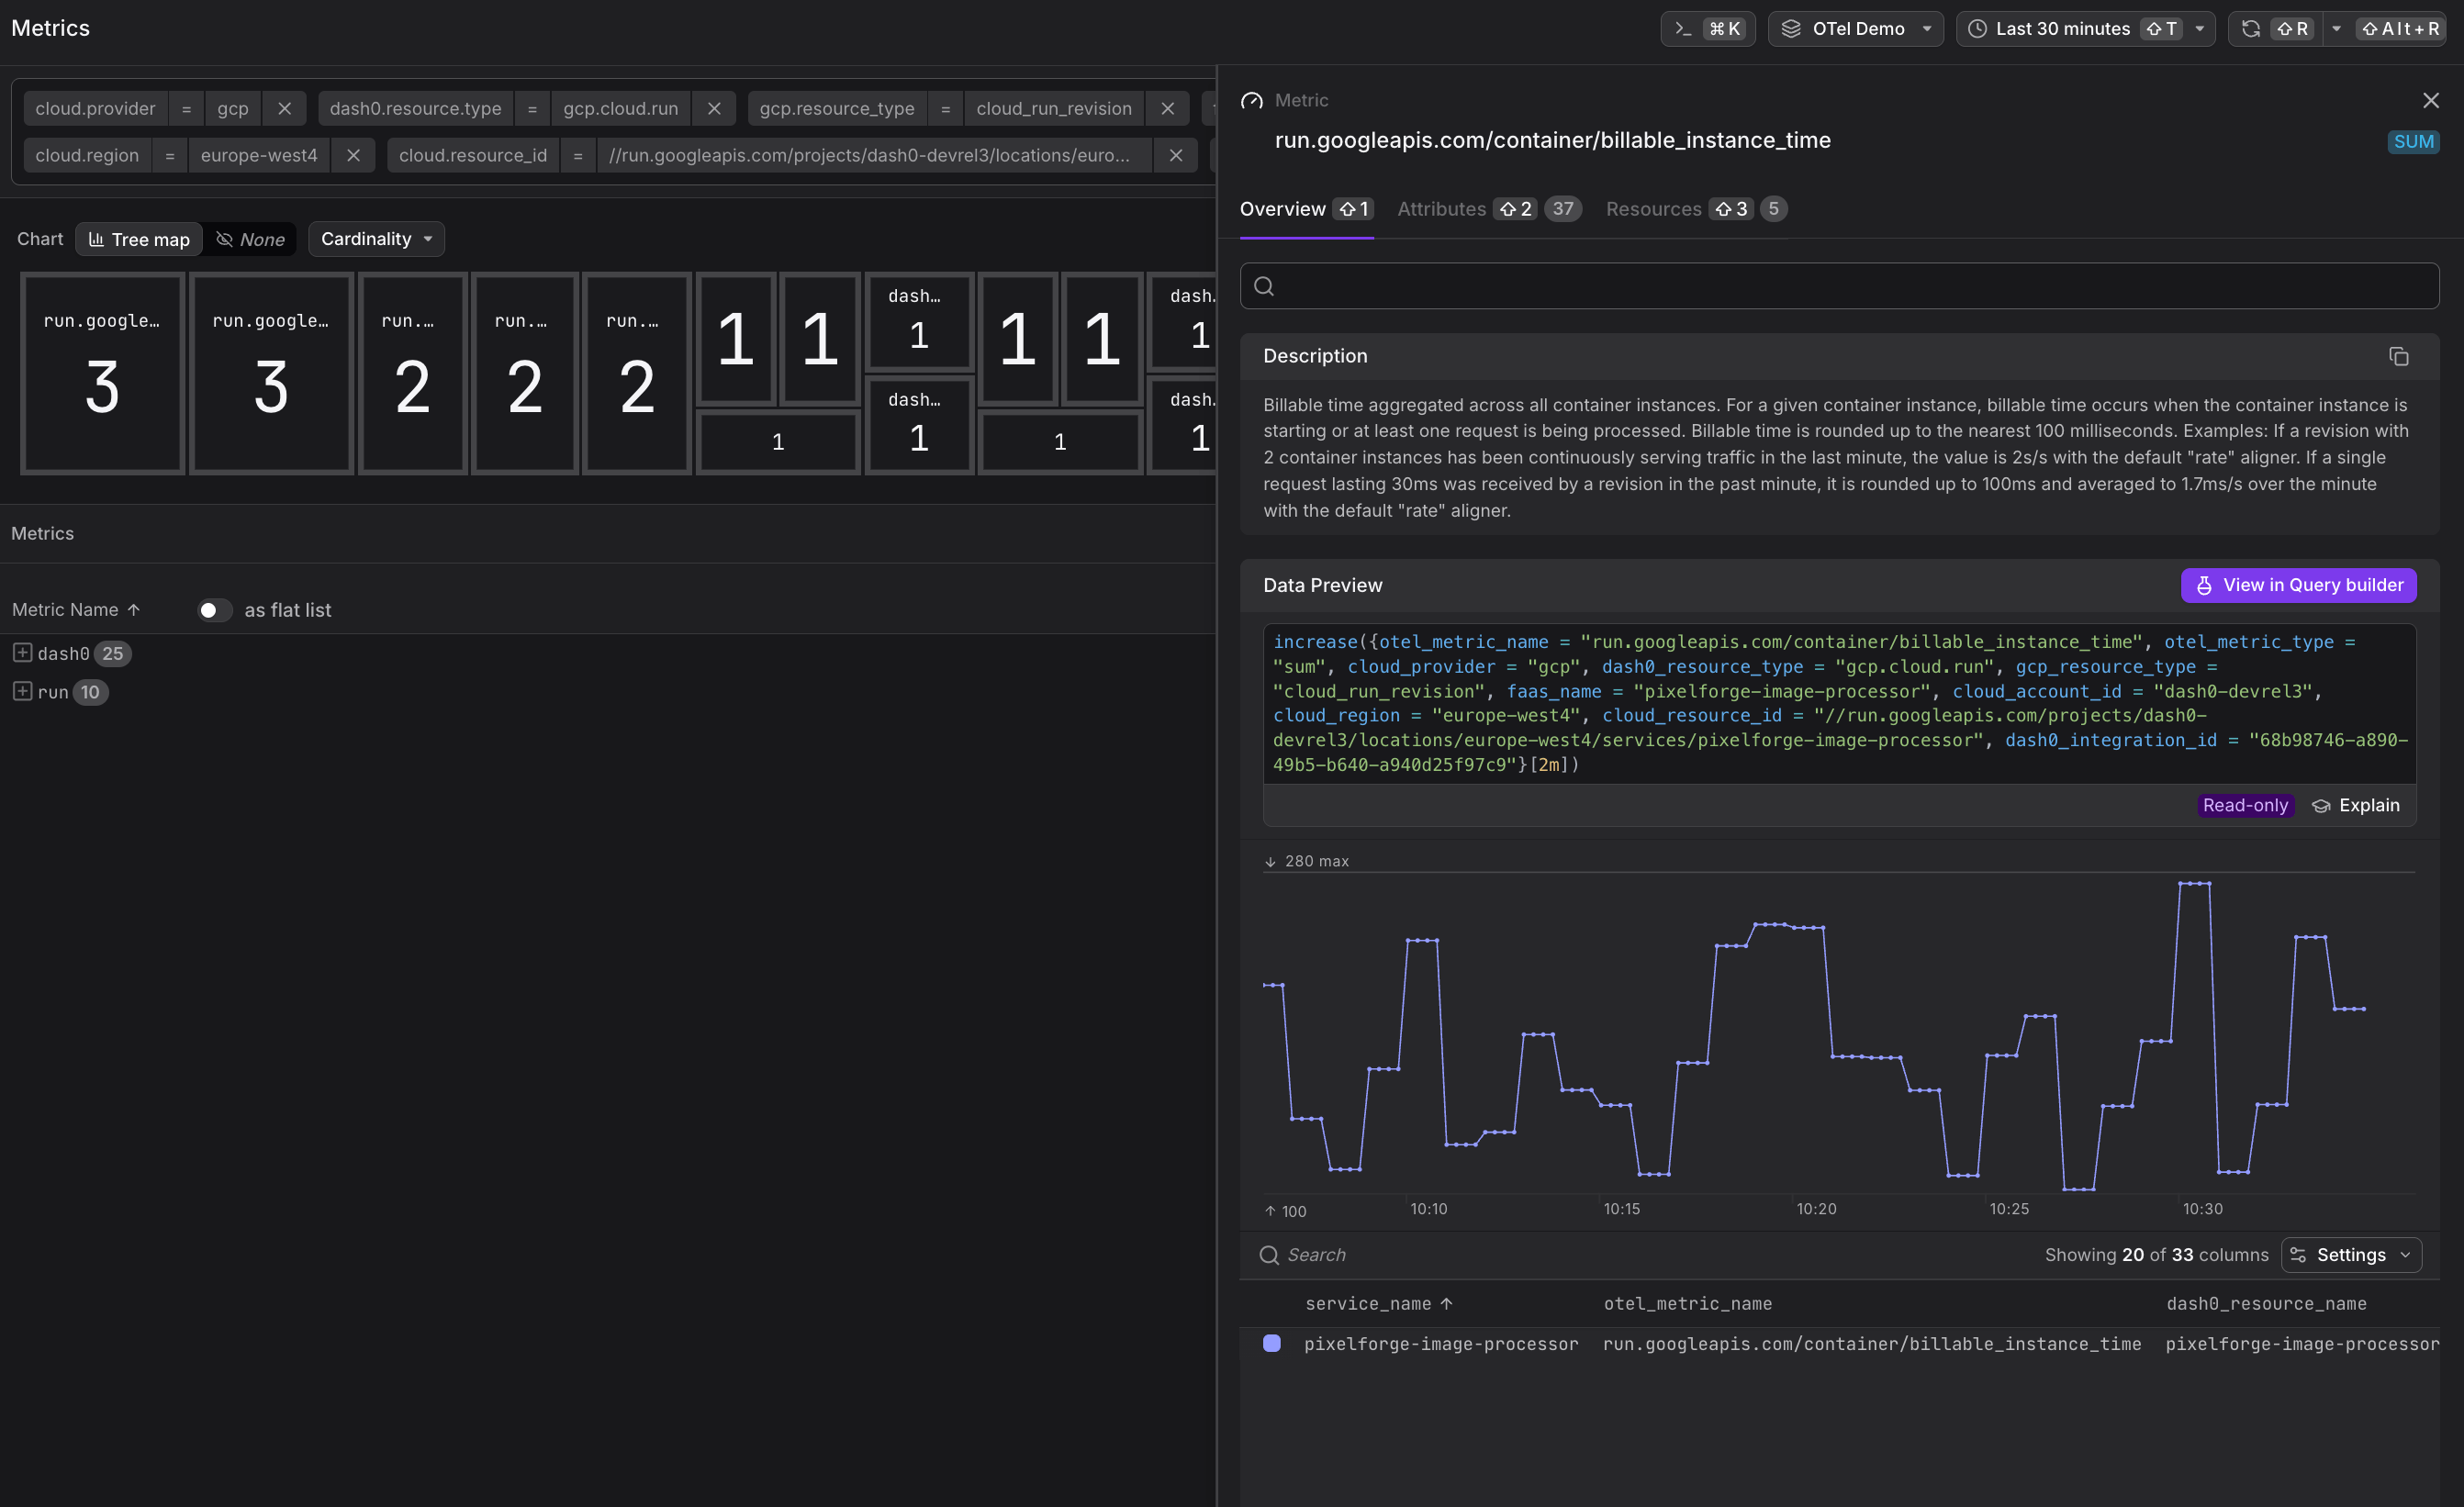
All metrics are collected at the service level and aggregated across all revisions. To view per-revision metrics, use the revision_name label in PromQL queries.
Common Use Cases
Cloud Run service metrics enable performance optimization and cost control. The following examples demonstrate how to use these metrics to improve service reliability and efficiency.
Identifying Scaling Bottlenecks
High values in the run.googleapis.com/container/max_request_concurrencies histogram combined with increasing request latency suggest your service is reaching its concurrency limits. Consider:
- Increasing the maximum concurrent requests per instance
- Adjusting the maximum number of instances
- Optimizing application code to reduce request processing time
Optimizing Resource Allocation
Compare CPU and memory utilization histograms against your configured limits. If utilization consistently stays in the lower percentiles, you may be over-provisioned and can reduce allocated resources to save costs.
Monitoring Cold Starts
Sudden spikes in high percentiles of run.googleapis.com/request_latencies often indicate cold starts when new instances are launched. If cold starts are impacting user experience:
- Enable minimum instances to keep containers warm
- Optimize container startup time by reducing image size and dependencies
- Consider using startup CPU boost for faster initialization
Cost Analysis
Track run.googleapis.com/container/billable_instance_time over time to understand cost trends. Correlate with request counts to calculate cost per request and identify optimization opportunities.
Correlating with Application Telemetry
Cloud Run metrics become more powerful when correlated with application-level telemetry. Dash0 automatically links infrastructure metrics to:
- Traces from your Cloud Run services (via OpenTelemetry instrumentation)
- Logs emitted to Google Cloud Logging
- Custom metrics sent via OpenTelemetry SDKs
When viewing a Cloud Run service in Dash0, you can pivot to related traces, logs, and application metrics to investigate performance issues holistically.
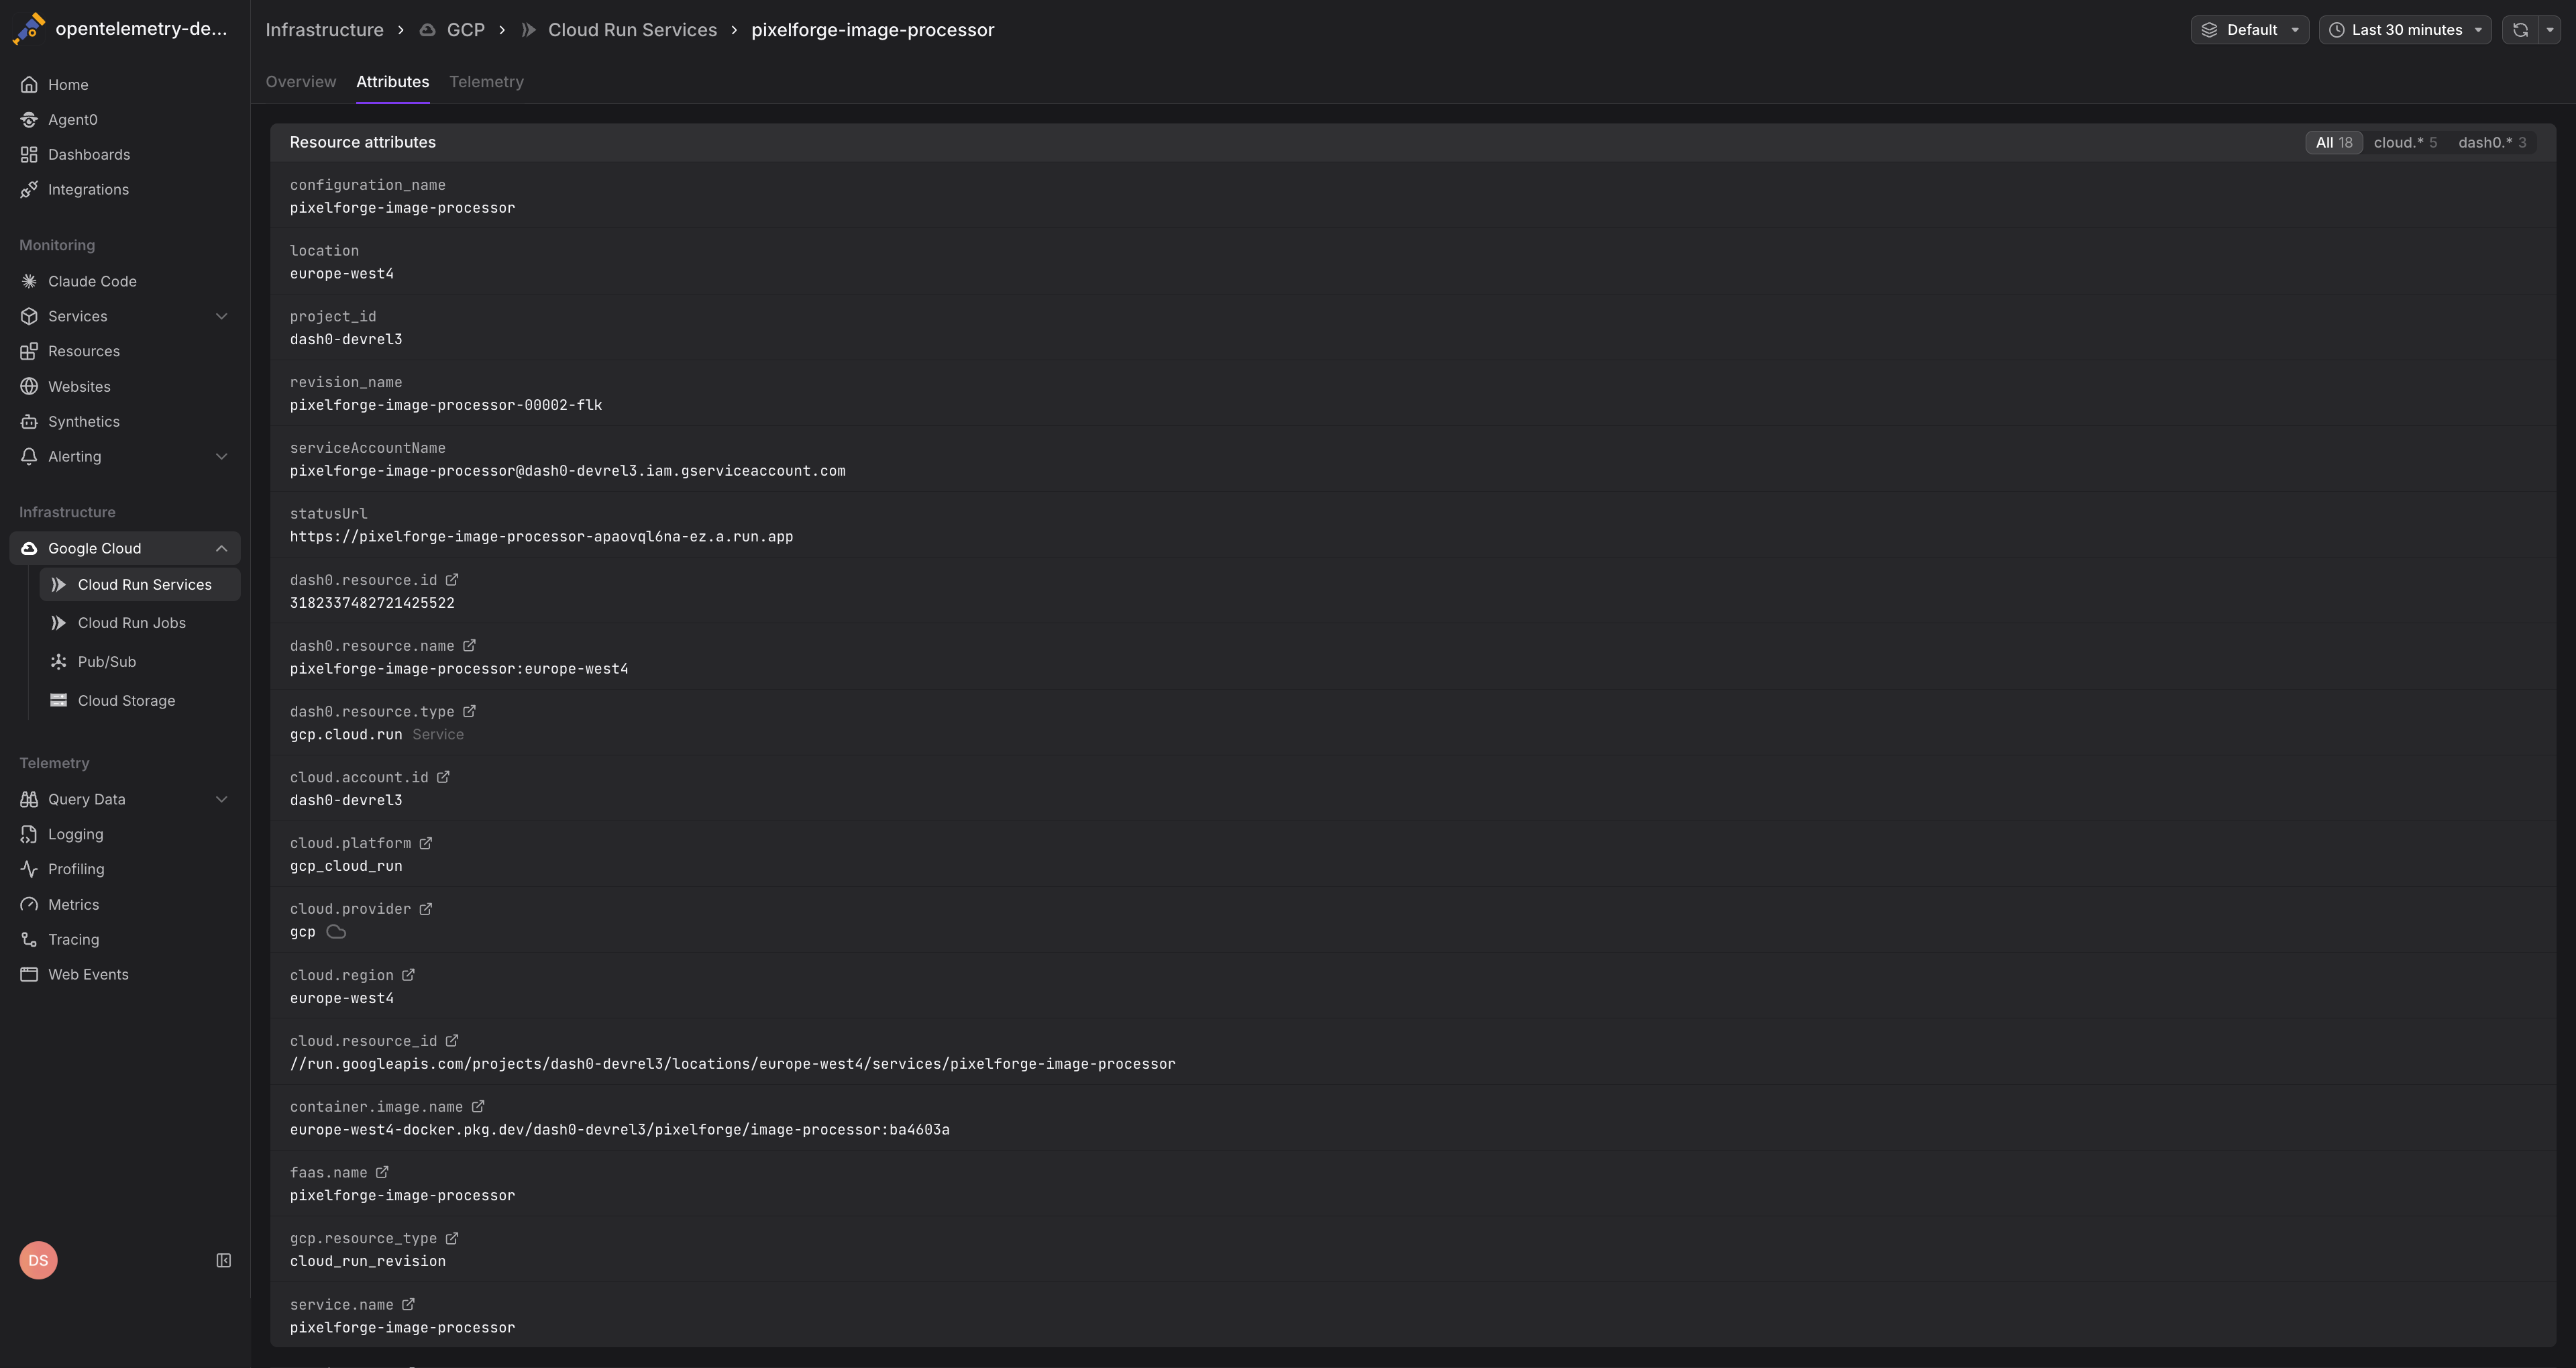
Ensure your Cloud Run services emit OpenTelemetry traces with the faas.name and cloud.region attributes set. Dash0 uses these to correlate infrastructure metrics with application telemetry. See GCP Resources for attribute conventions.
Querying Cloud Run Metrics
Use PromQL in the Query Builder to create custom charts and dashboards:
1234567891011# Request rate by servicesum by (service_name) (rate({otel_metric_name="run.googleapis.com/request_count"}[5m]))# P99 latency across all serviceshistogram_quantile(0.99, sum by (service_name, le) (rate({otel_metric_name="run.googleapis.com/request_latencies"}[5m])))# P99 CPU utilization above 80%histogram_quantile(0.99, sum by (service_name, le) (rate({otel_metric_name="run.googleapis.com/container/cpu/utilizations"}[5m]))) > 0.8# Cost trend over timesum(rate({otel_metric_name="run.googleapis.com/container/billable_instance_time"}[1h]))
All Cloud Run metrics include the following labels for filtering and grouping:
service_name— The Cloud Run service namerevision_name— The specific revision identifierlocation— The GCP region (e.g.,us-central1)project_id— The GCP project ID
Alerting on Cloud Run Metrics
Create check rules to alert on Cloud Run performance issues:
- High latency: Alert when P99 of
run.googleapis.com/request_latenciesexceeds thresholds - Error rate spikes: Detect increases in request errors using
response_code_classlabel onrun.googleapis.com/request_count - Resource exhaustion: Alert when high percentiles of CPU or memory utilization approach limits
- Scaling issues: Notify when
run.googleapis.com/container/instance_counthits maximum thresholds
See Alerting for details on creating check rules with infrastructure metrics.
Further Reading
- Monitor Cloud Run Jobs — Monitor batch job executions
- GCP Resources — Resource naming and equality rules
- Set Up Google Cloud Integration — Configure the GCP integration
- Google Cloud Monitoring Metrics — Full list of available Cloud Run metrics