Last updated: June 23, 2026
Set Up Google Cloud Integration
Setting up Google Cloud monitoring in Dash0 requires granting permissions to the Dash0 service account and enabling the Cloud Monitoring API in your GCP projects.
Prerequisites
Before you begin, ensure you have:
- A GCP project with billing enabled
- Permissions to grant IAM roles in your GCP project (typically
roles/resourcemanager.projectIamAdminorroles/owner)
Cloud Monitoring is enabled by default on most GCP projects. If you're unsure, check the APIs & Services page in the Google Cloud Console. If it is not enabled, Dash0 enables it for you.
Integration Setup
Follow these steps to connect your GCP projects to Dash0 and begin collecting infrastructure metrics.
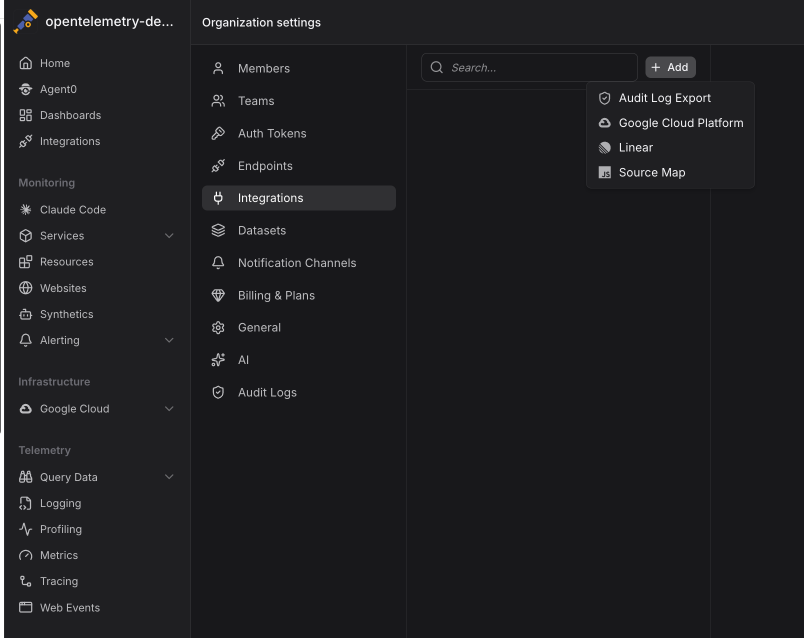
1. Navigate to Integration Settings
In Dash0, go to Settings from the left sidebar, then select Integrations from the organization settings menu or click here to go there directly.
Select Google Cloud Platform from the available integrations.
2. Authorize Dash0 Access
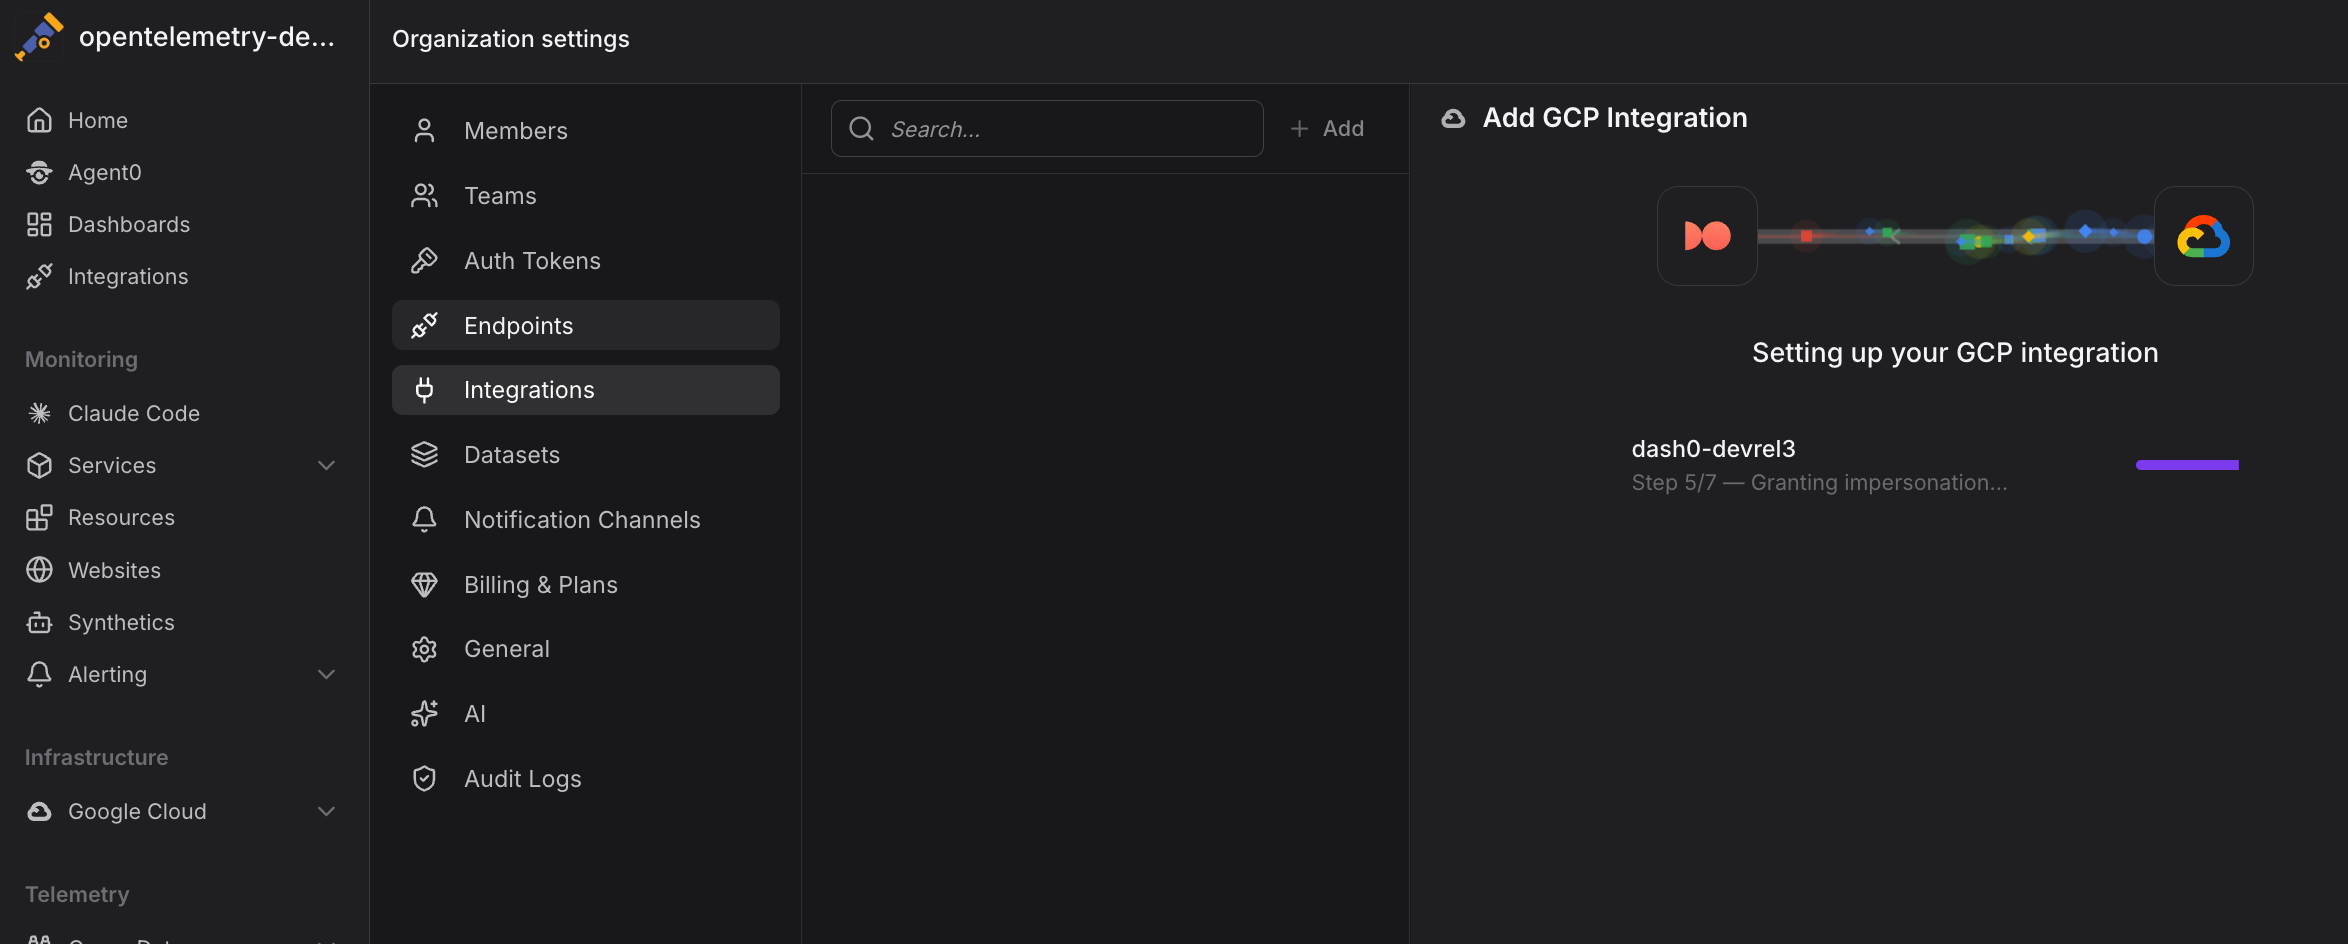
Click Add to begin setting up a new GCP integration.
In the integration setup dialog, click Connect with Google to begin the OAuth authorization flow.
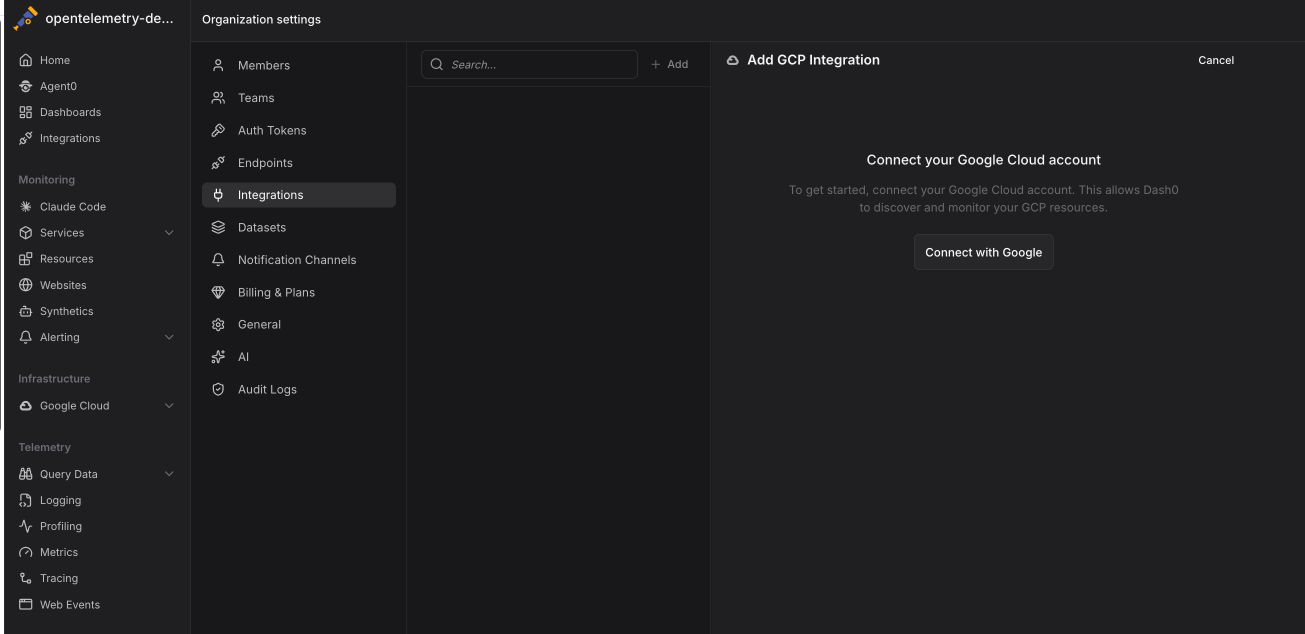
You'll be redirected to Google to sign in and grant permissions.
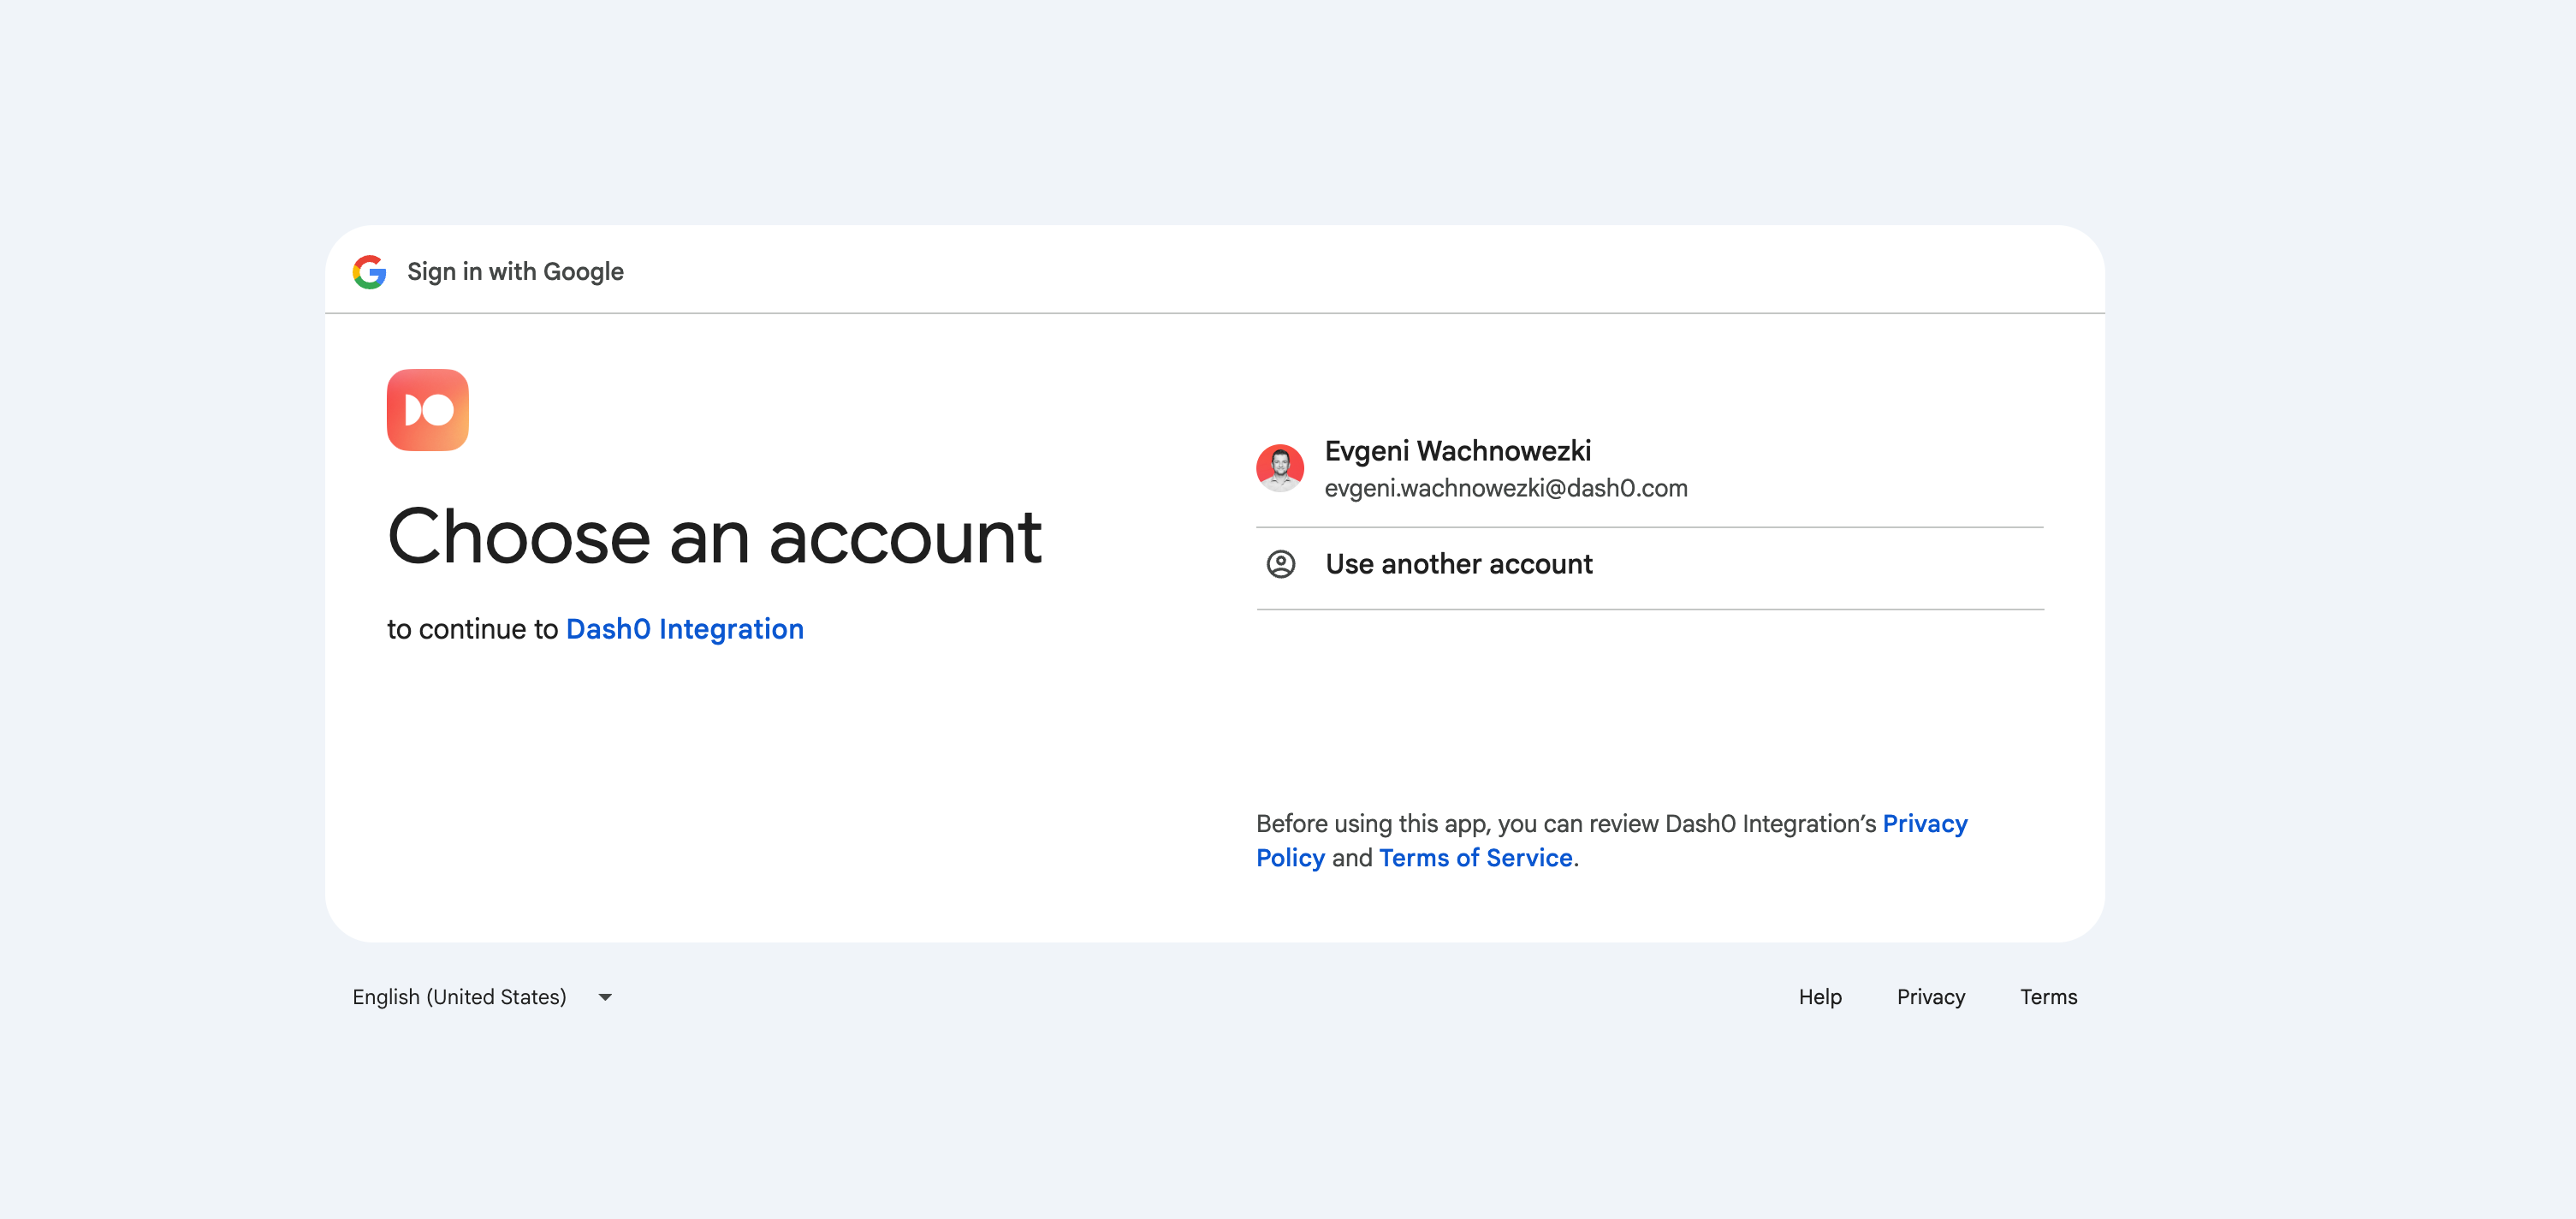
During OAuth setup, Dash0 requests the cloud-platform scope. This broad scope is used only during the initial setup to create a custom IAM role with minimal read-only permissions specific to monitoring data.
Once setup is complete:
- A custom minimal role is created with read-only permissions to Cloud Monitoring metrics.
- This minimal role is granted to a service account created in your GCP project.
- Dash0 uses the service account when collecting metrics, ensuring that Dash0 only has the access strictly necessary for monitoring purposes.
This approach follows the principle of least privilege, limiting ongoing access to only what's required for metrics collection.
3. Select Projects
After authorization, choose which GCP projects to monitor from your GCP organization.
Select the projects you want to monitor and assign them to datasets. You can add or remove projects at any time from the integration settings.
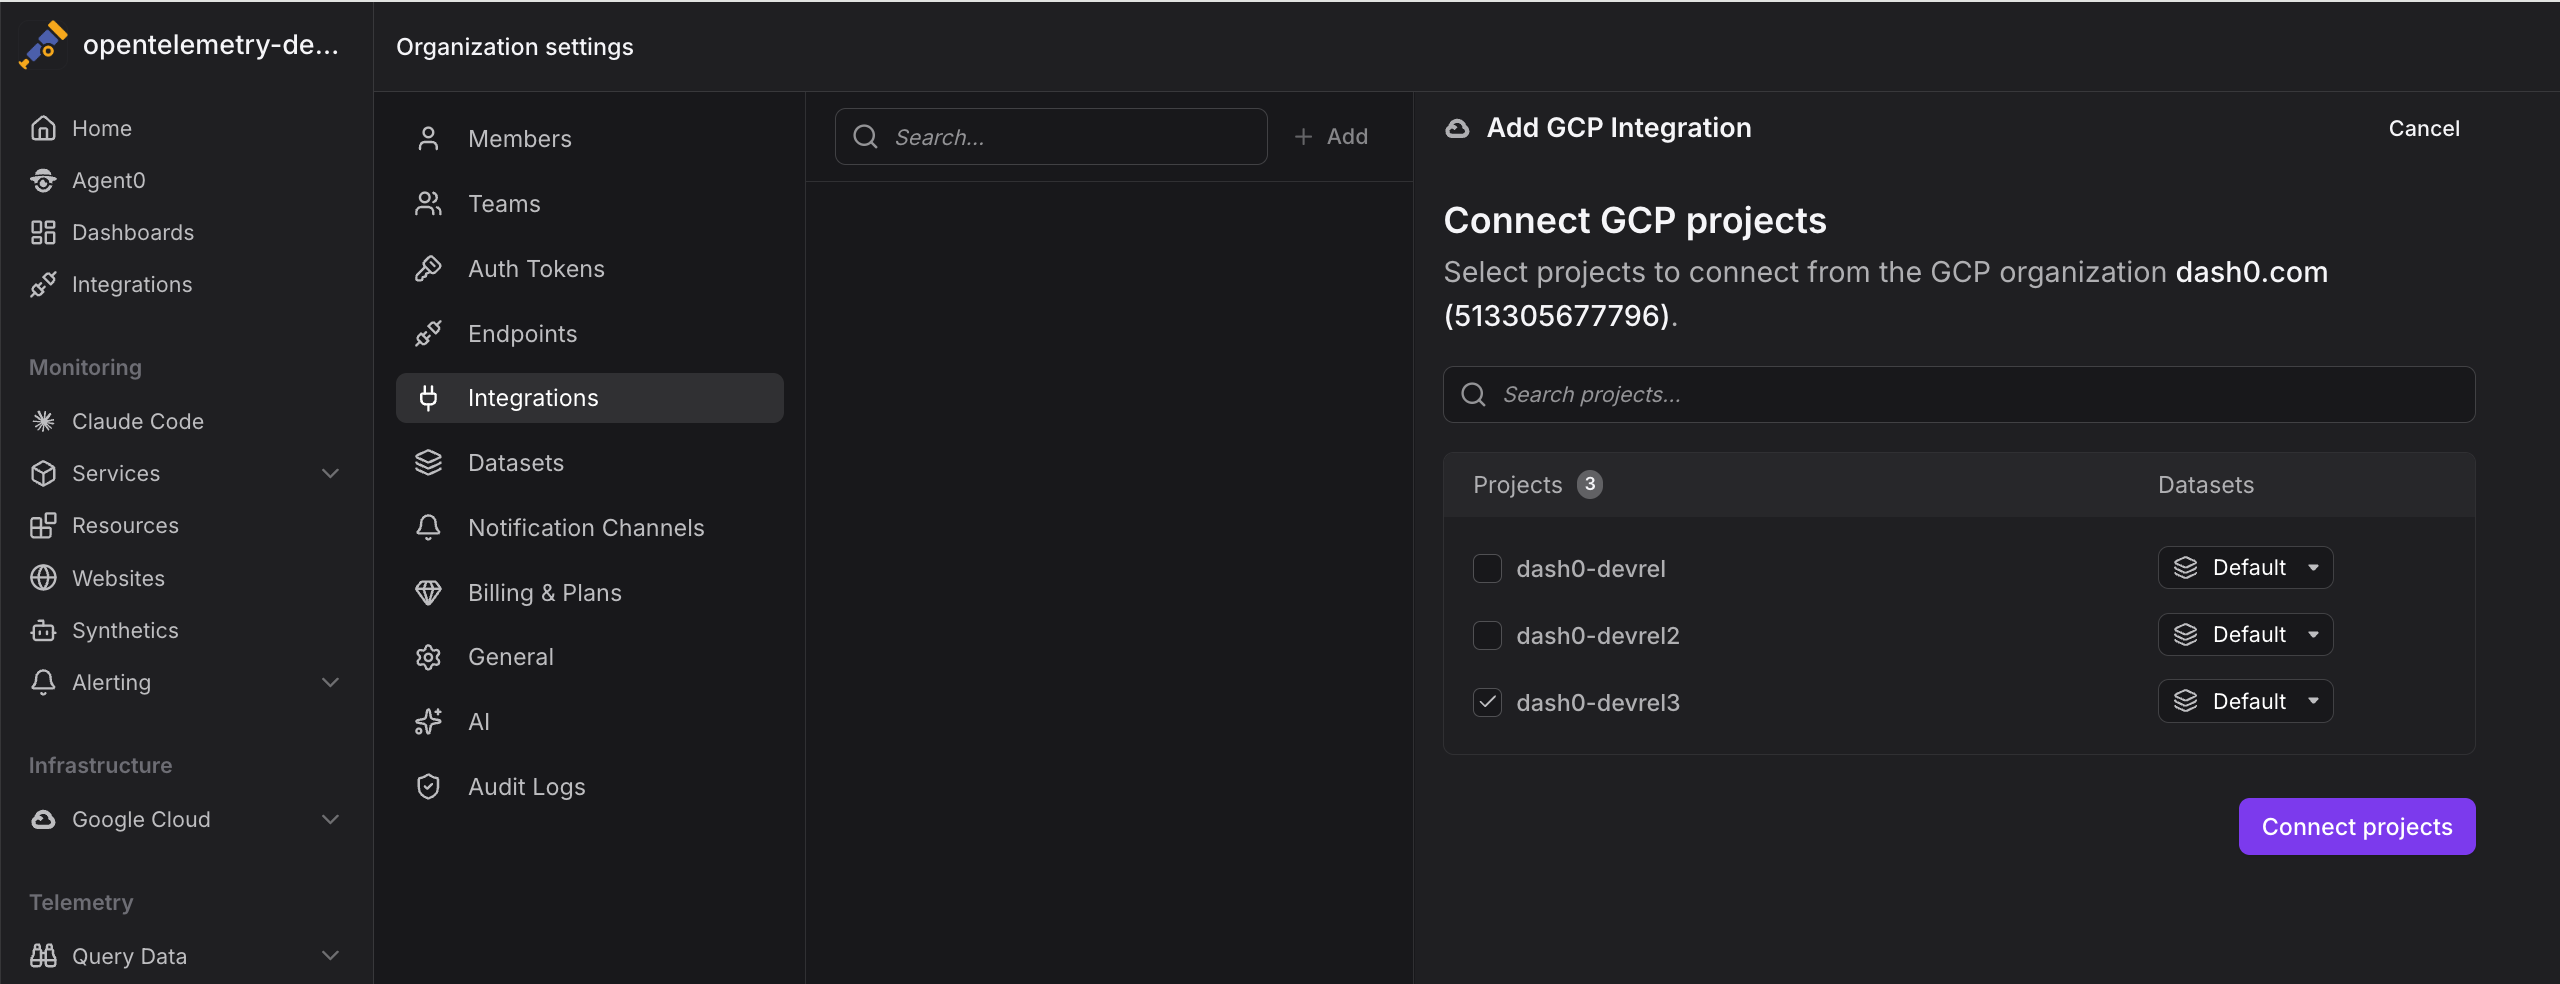
Click Connect projects to complete the setup. Dash0 will configure the integration and verify access to your projects.
Dash0 will automatically discover and monitor all supported resources (Cloud Run services, Pub/Sub topics and subscriptions, Cloud Storage buckets) in the selected projects.
Newly added resource types are added in a disabled state by default and must be manually enabled. This prevents unexpected increases in billing when new monitoring capabilities are released.
4. Verify Metrics Collection
Within 5 to 10 minutes of setup, metrics should begin appearing in Dash0. Navigate to Infrastructure > Google Cloud to verify that your services are being monitored.
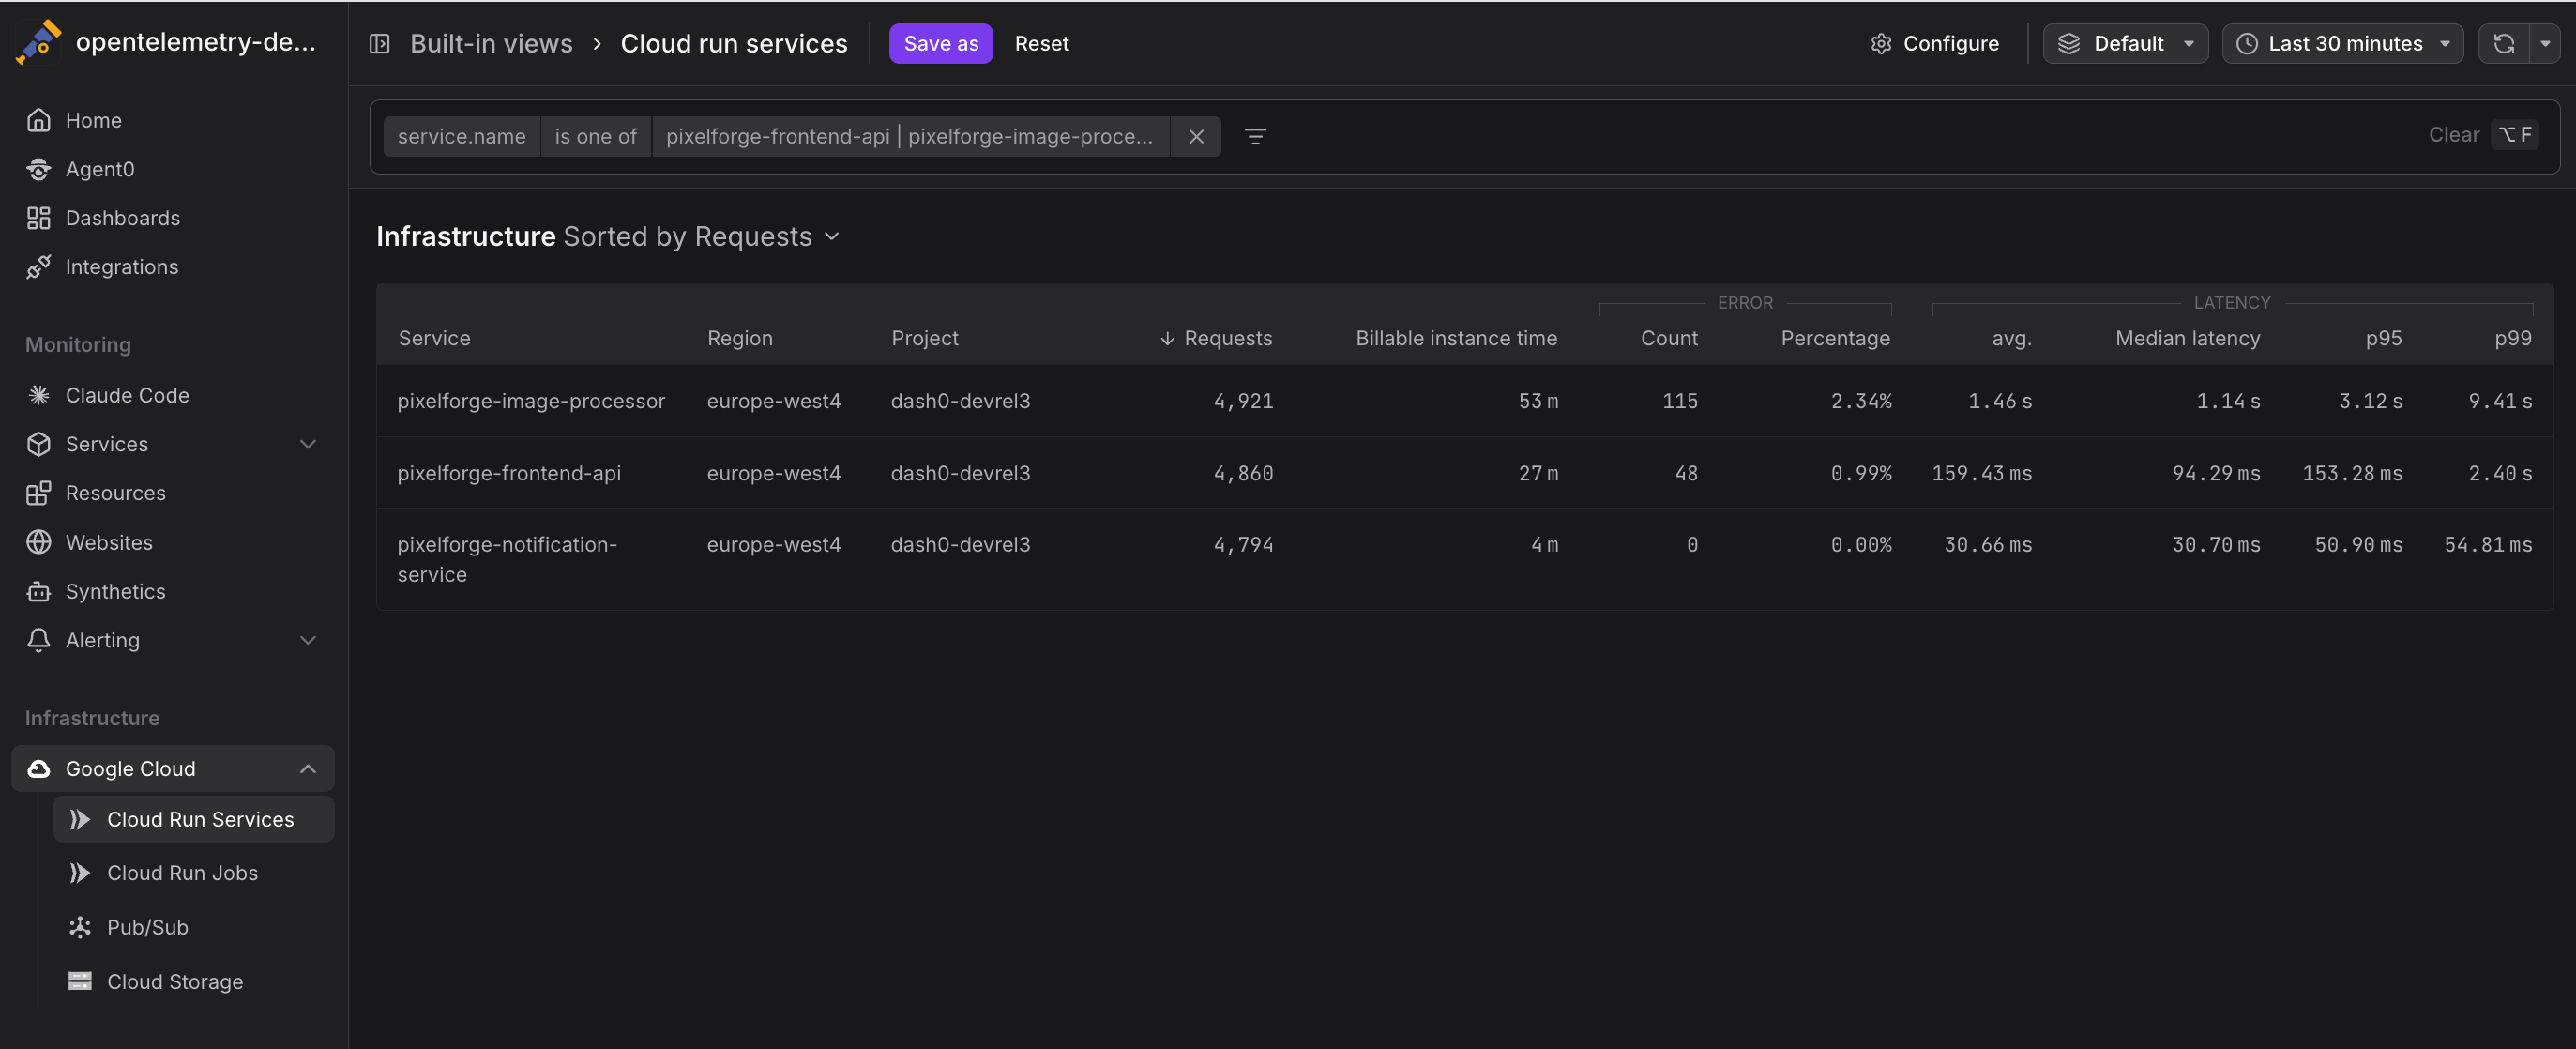
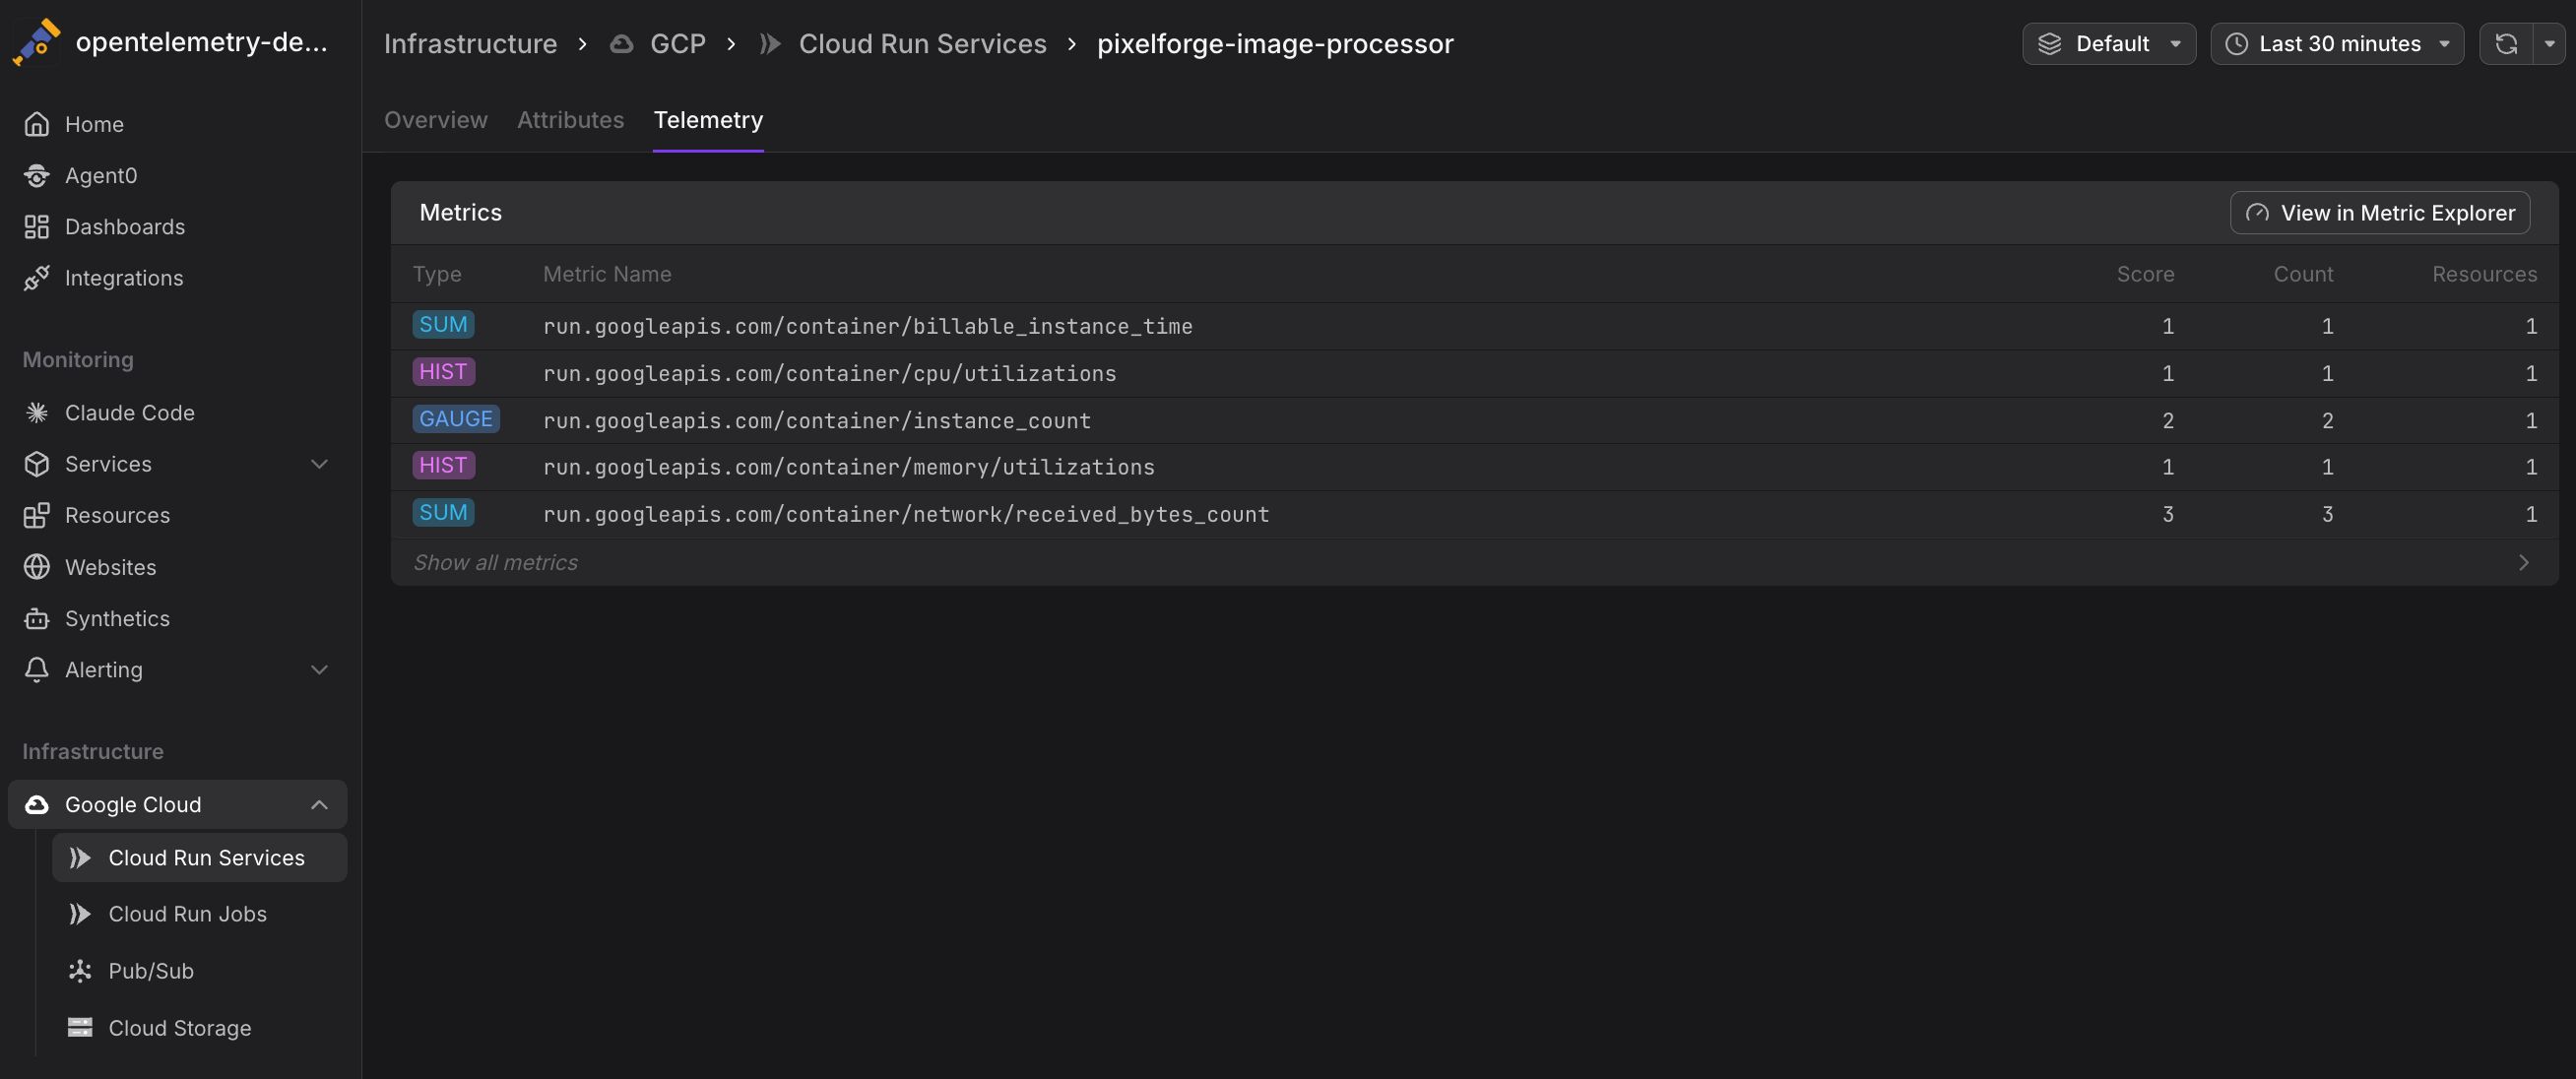
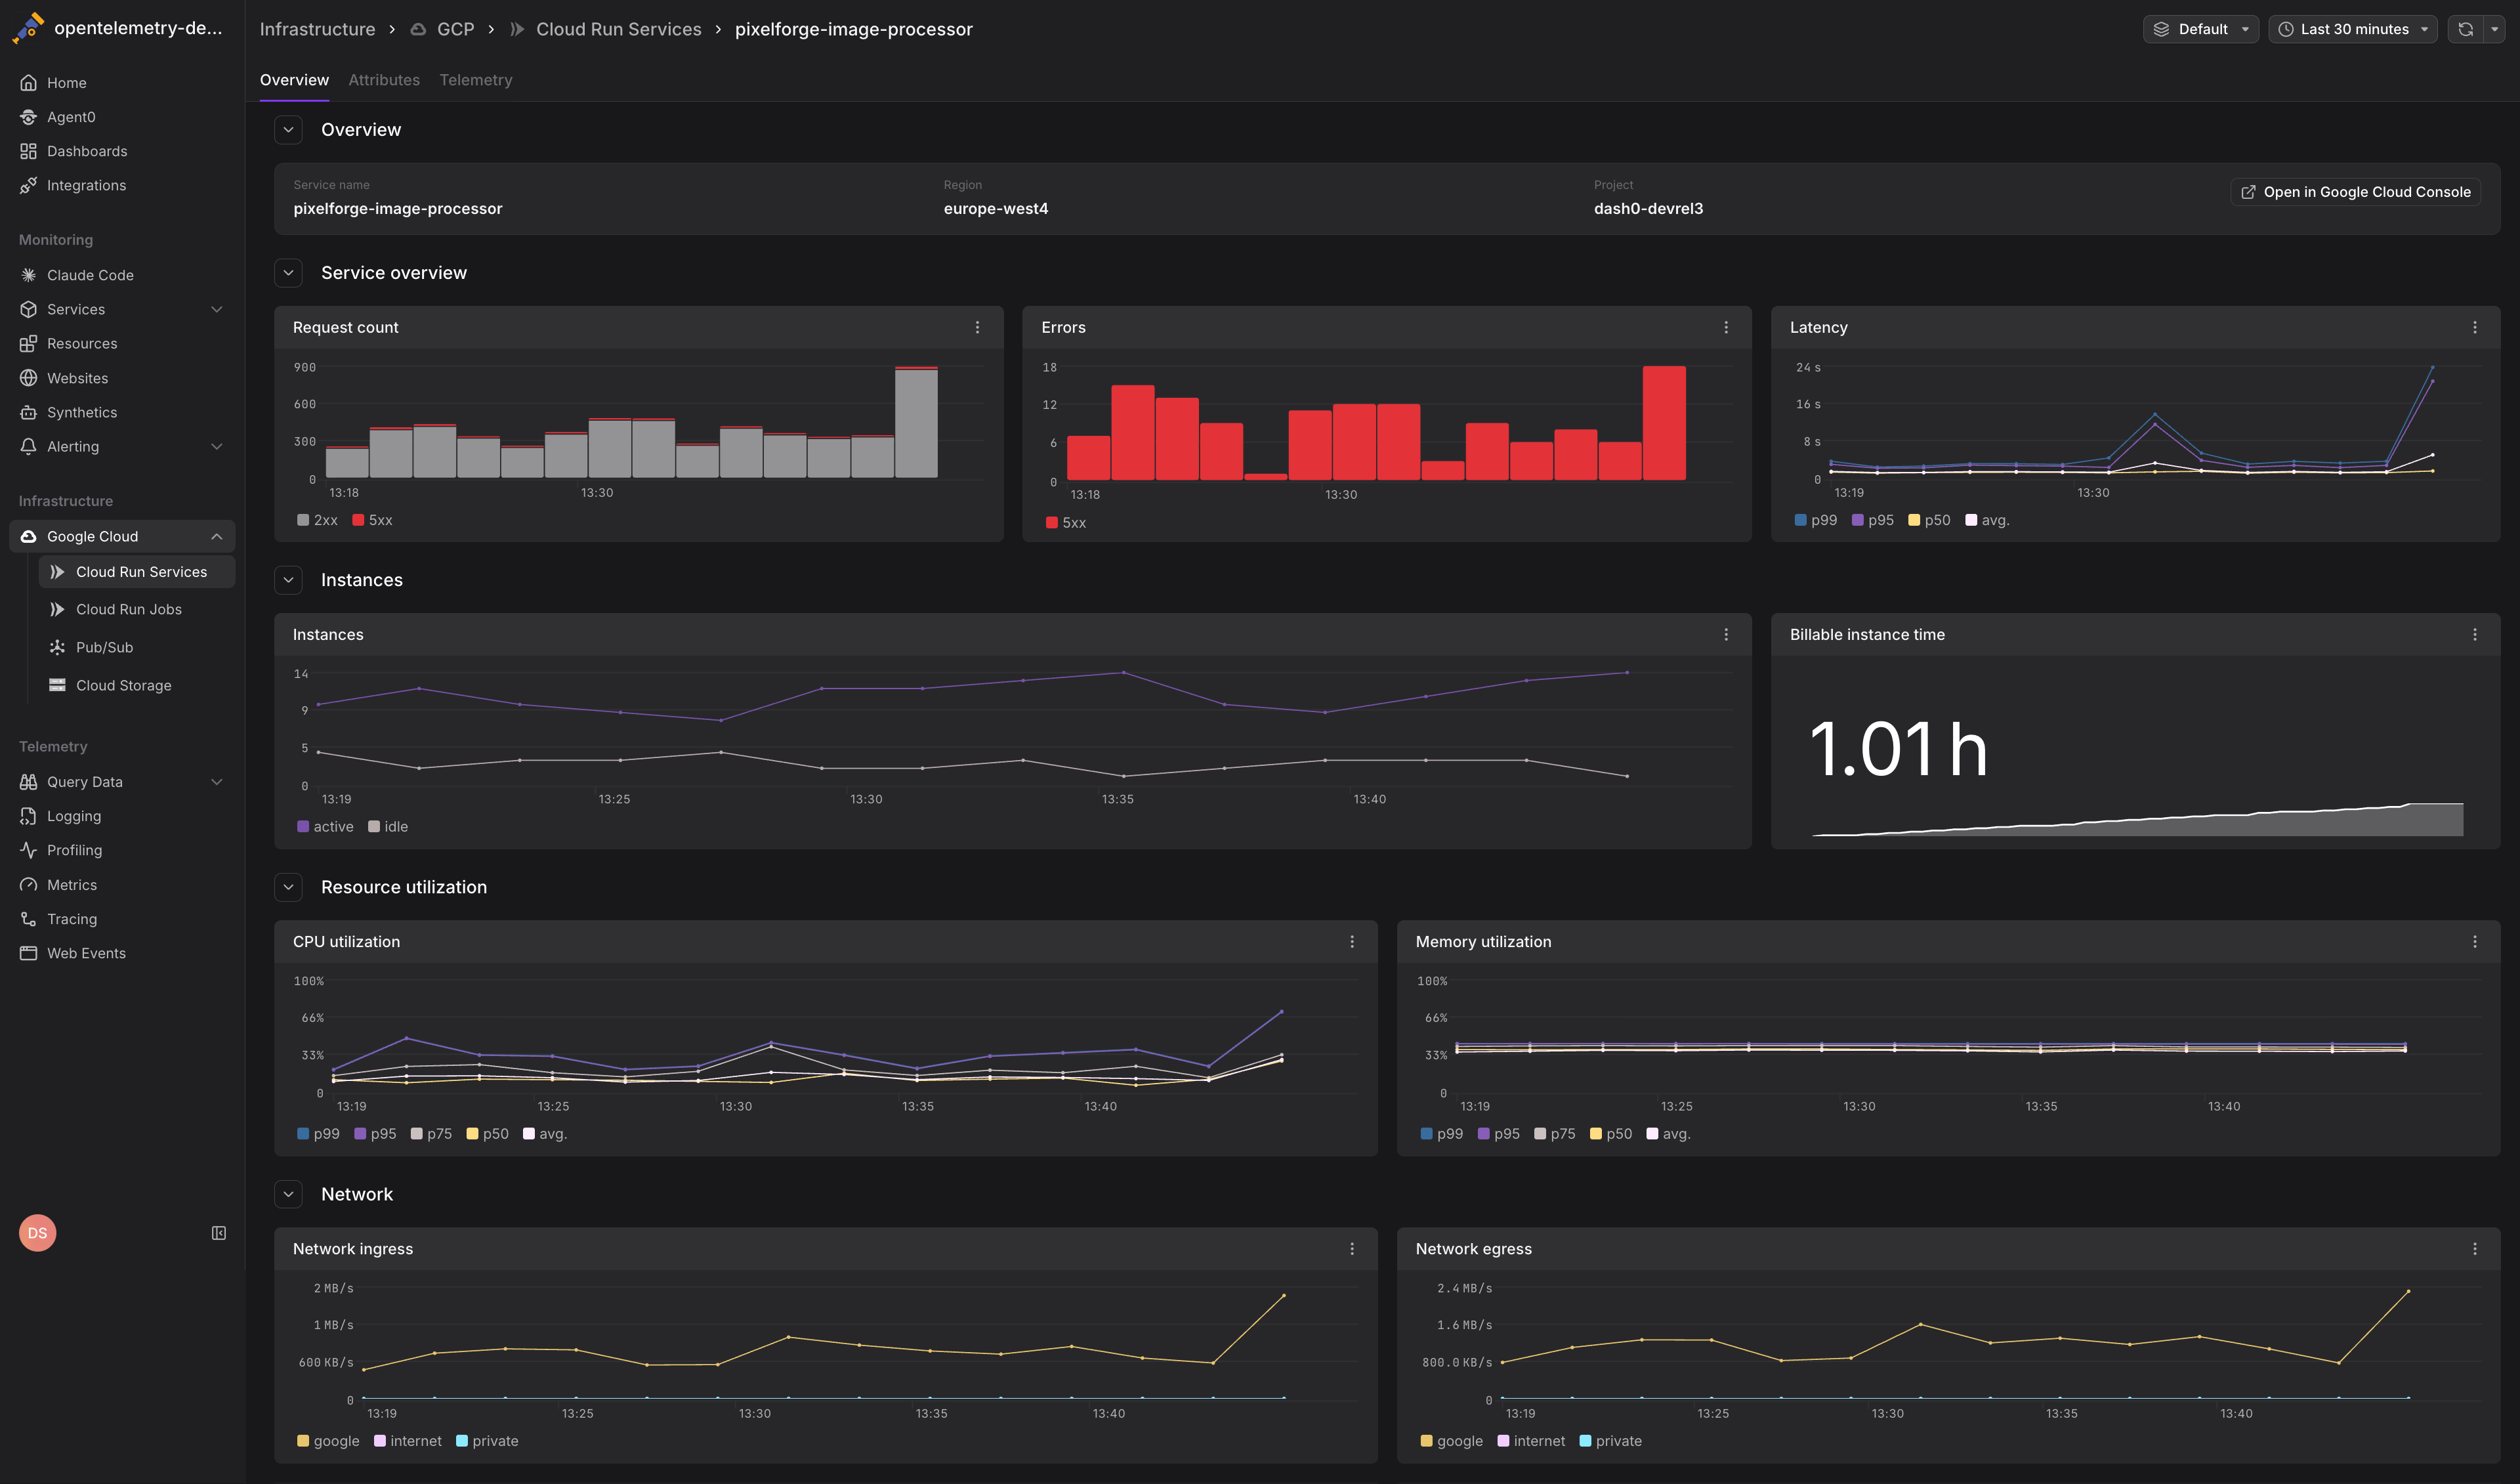
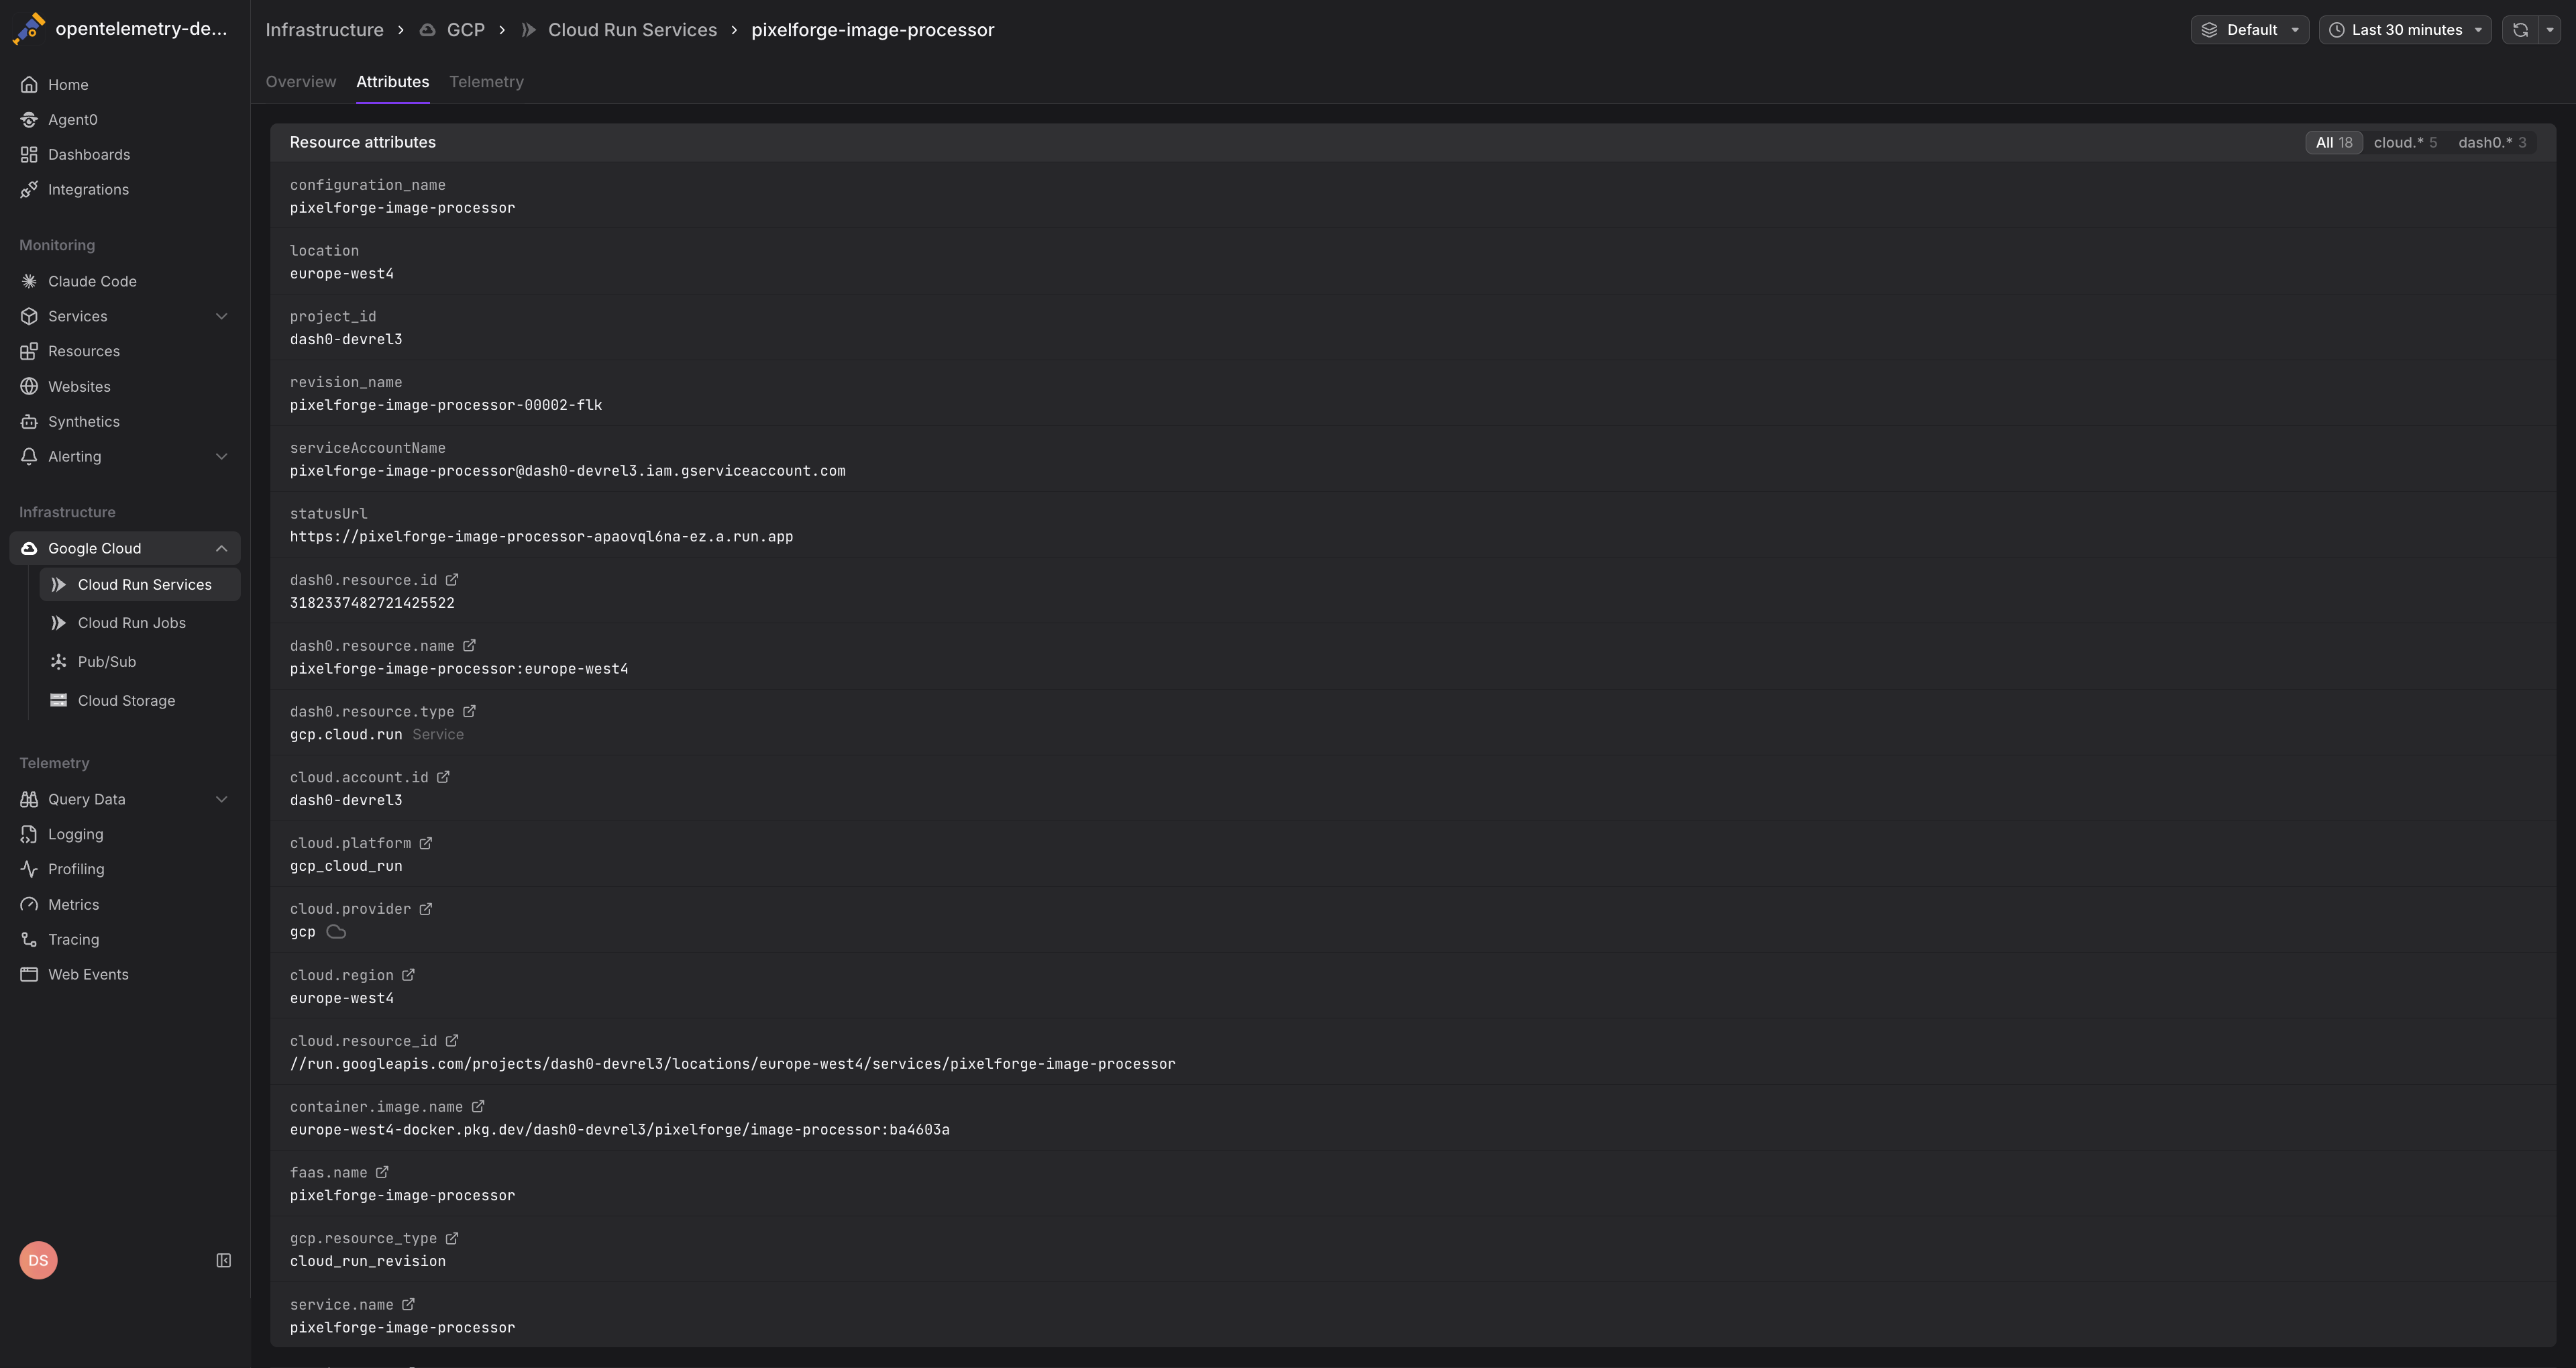
You can view detailed telemetry data for each service:
The overview tab provides comprehensive monitoring dashboards:
Resource attributes provide additional context about your services:
If metrics don't appear, check the troubleshooting section below.
Managing Resource Types
You can control which GCP resource types Dash0 monitors by enabling or disabling them individually. When a resource type is disabled, Dash0 continues to discover and display those resources, but stops collecting metrics for them and does not bill you for the related discovery processes.
Enabling a Resource Type
If you visit a GCP infrastructure page for a disabled resource type, you'll see a banner indicating that metrics collection is disabled:
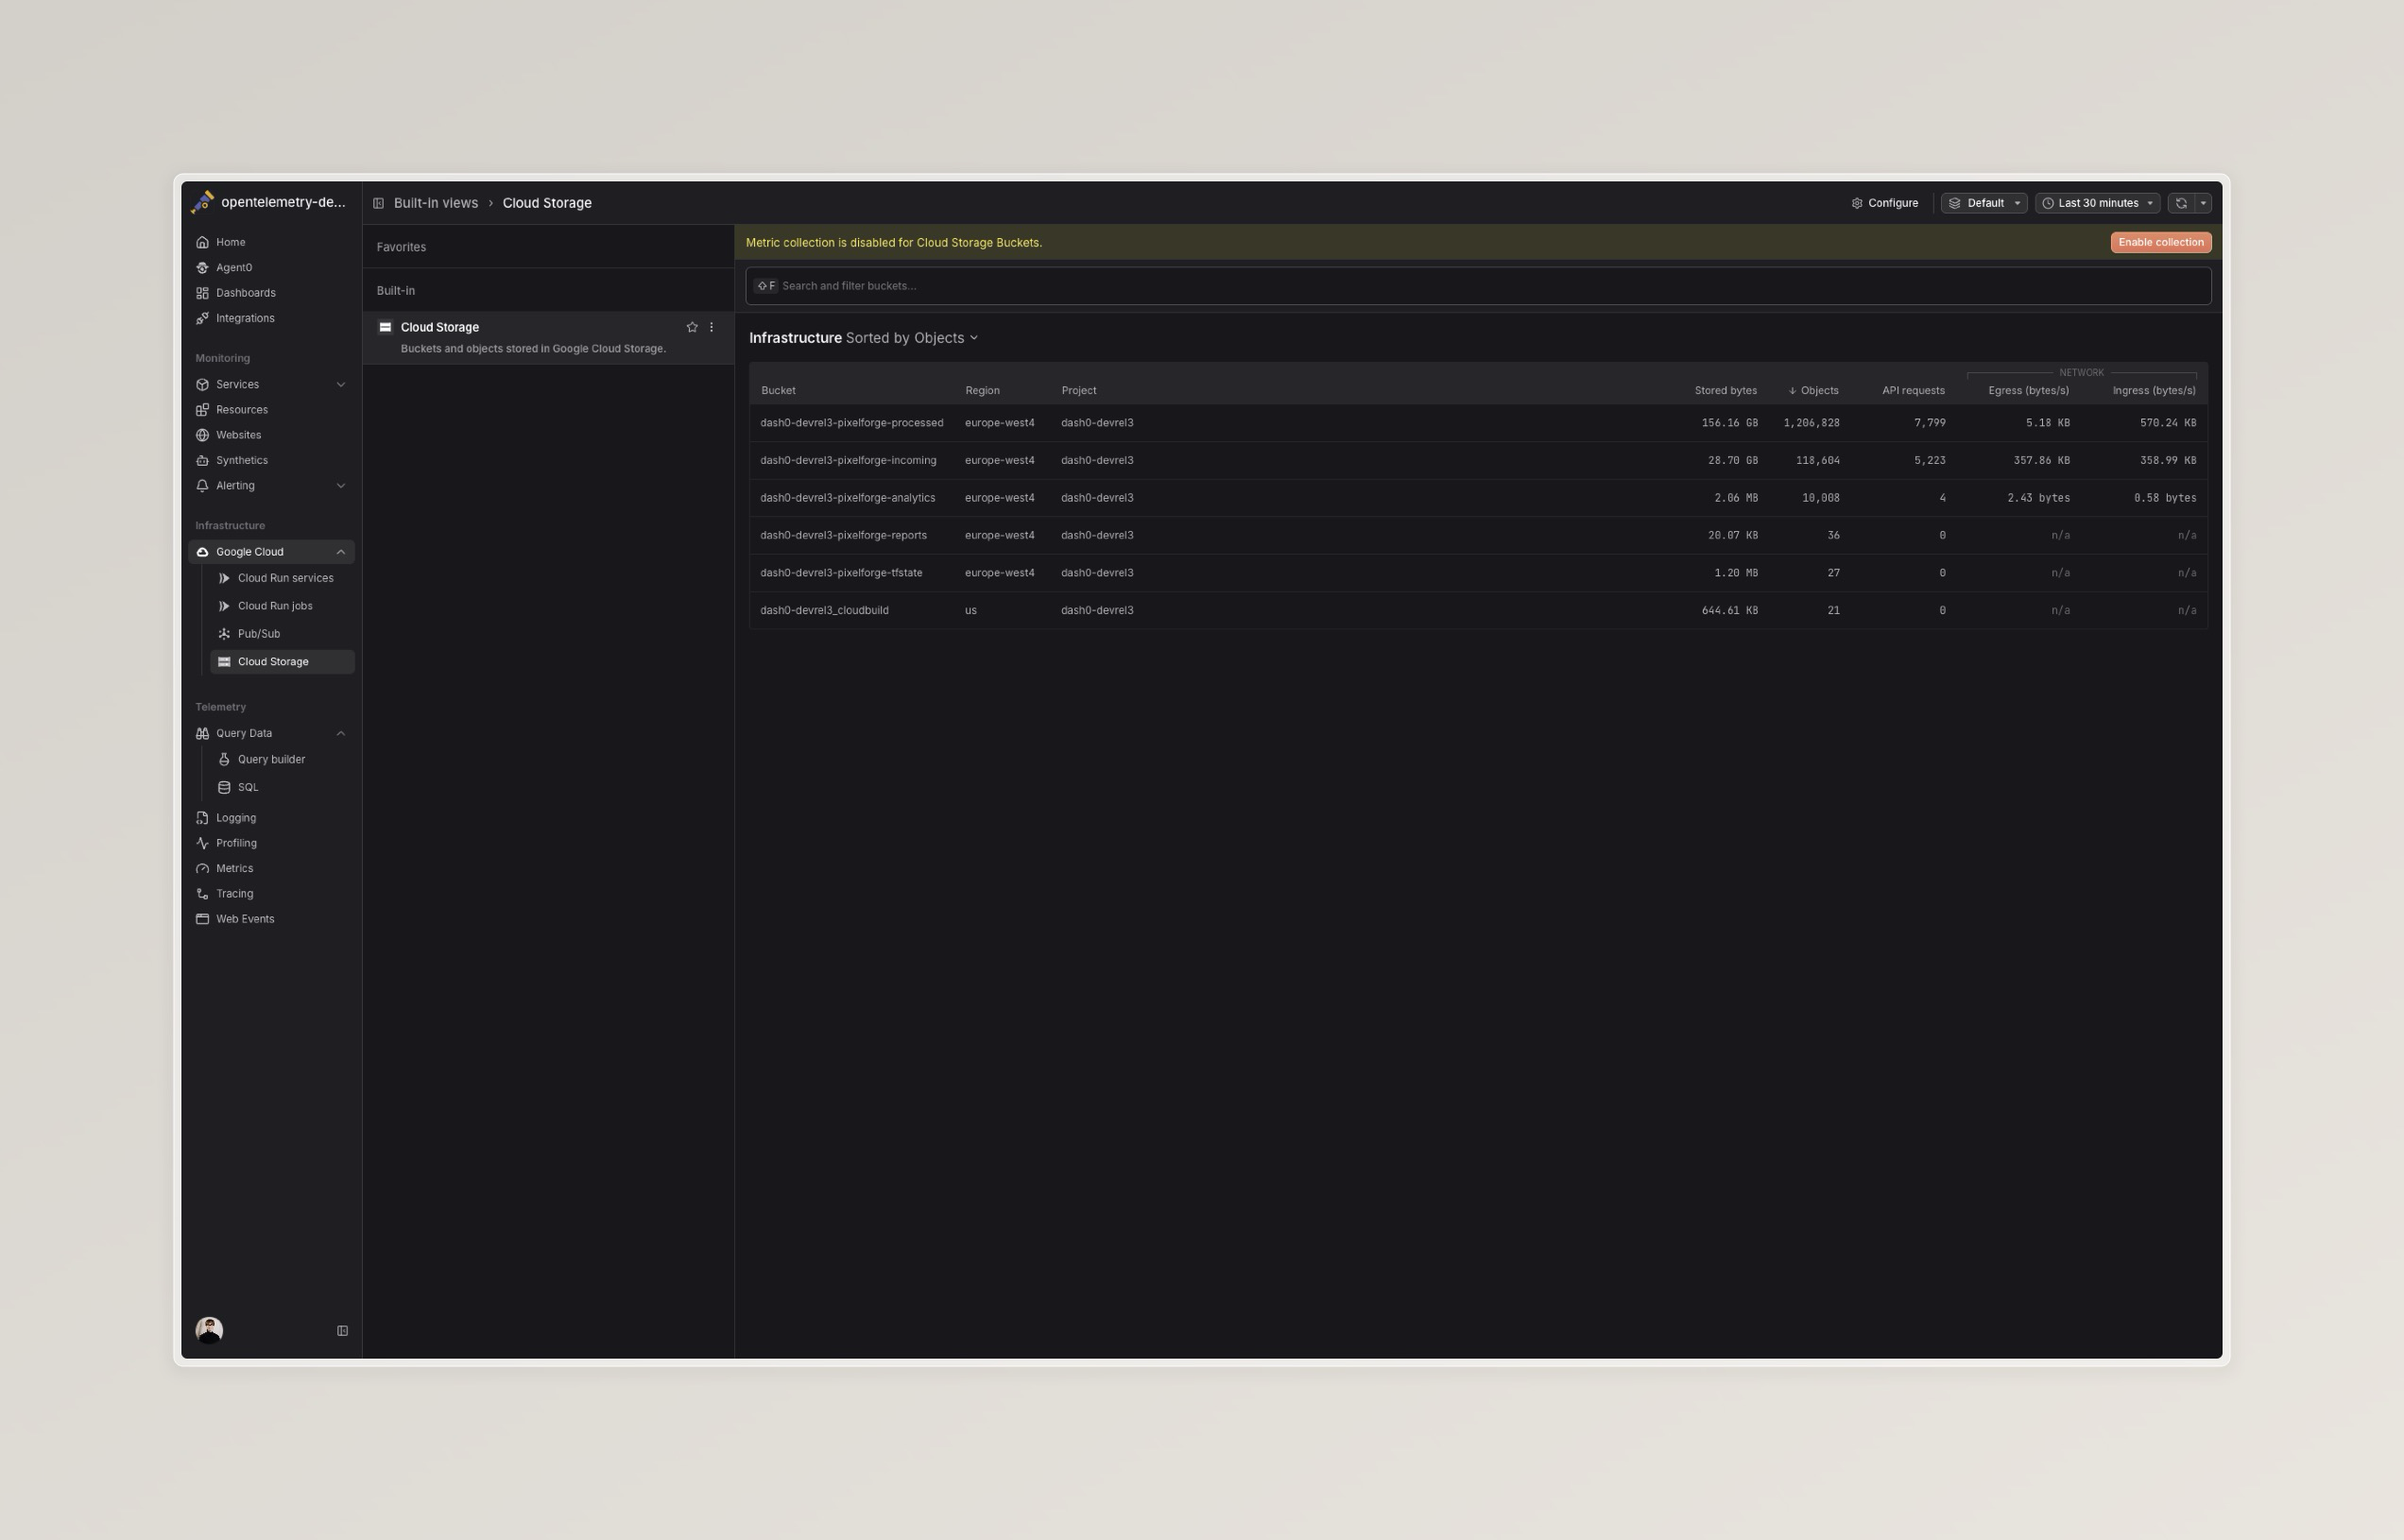
To enable metrics collection, click the Enable button in the banner. Metrics will begin flowing within 2 minutes.
Disabling a Resource Type
To disable metrics collection for a resource type:
- Navigate to Settings > Integrations > Google Cloud Platform or click here to go there directly
- Select the integration you want to modify
- In the resource types list, toggle off the resource type you want to disable
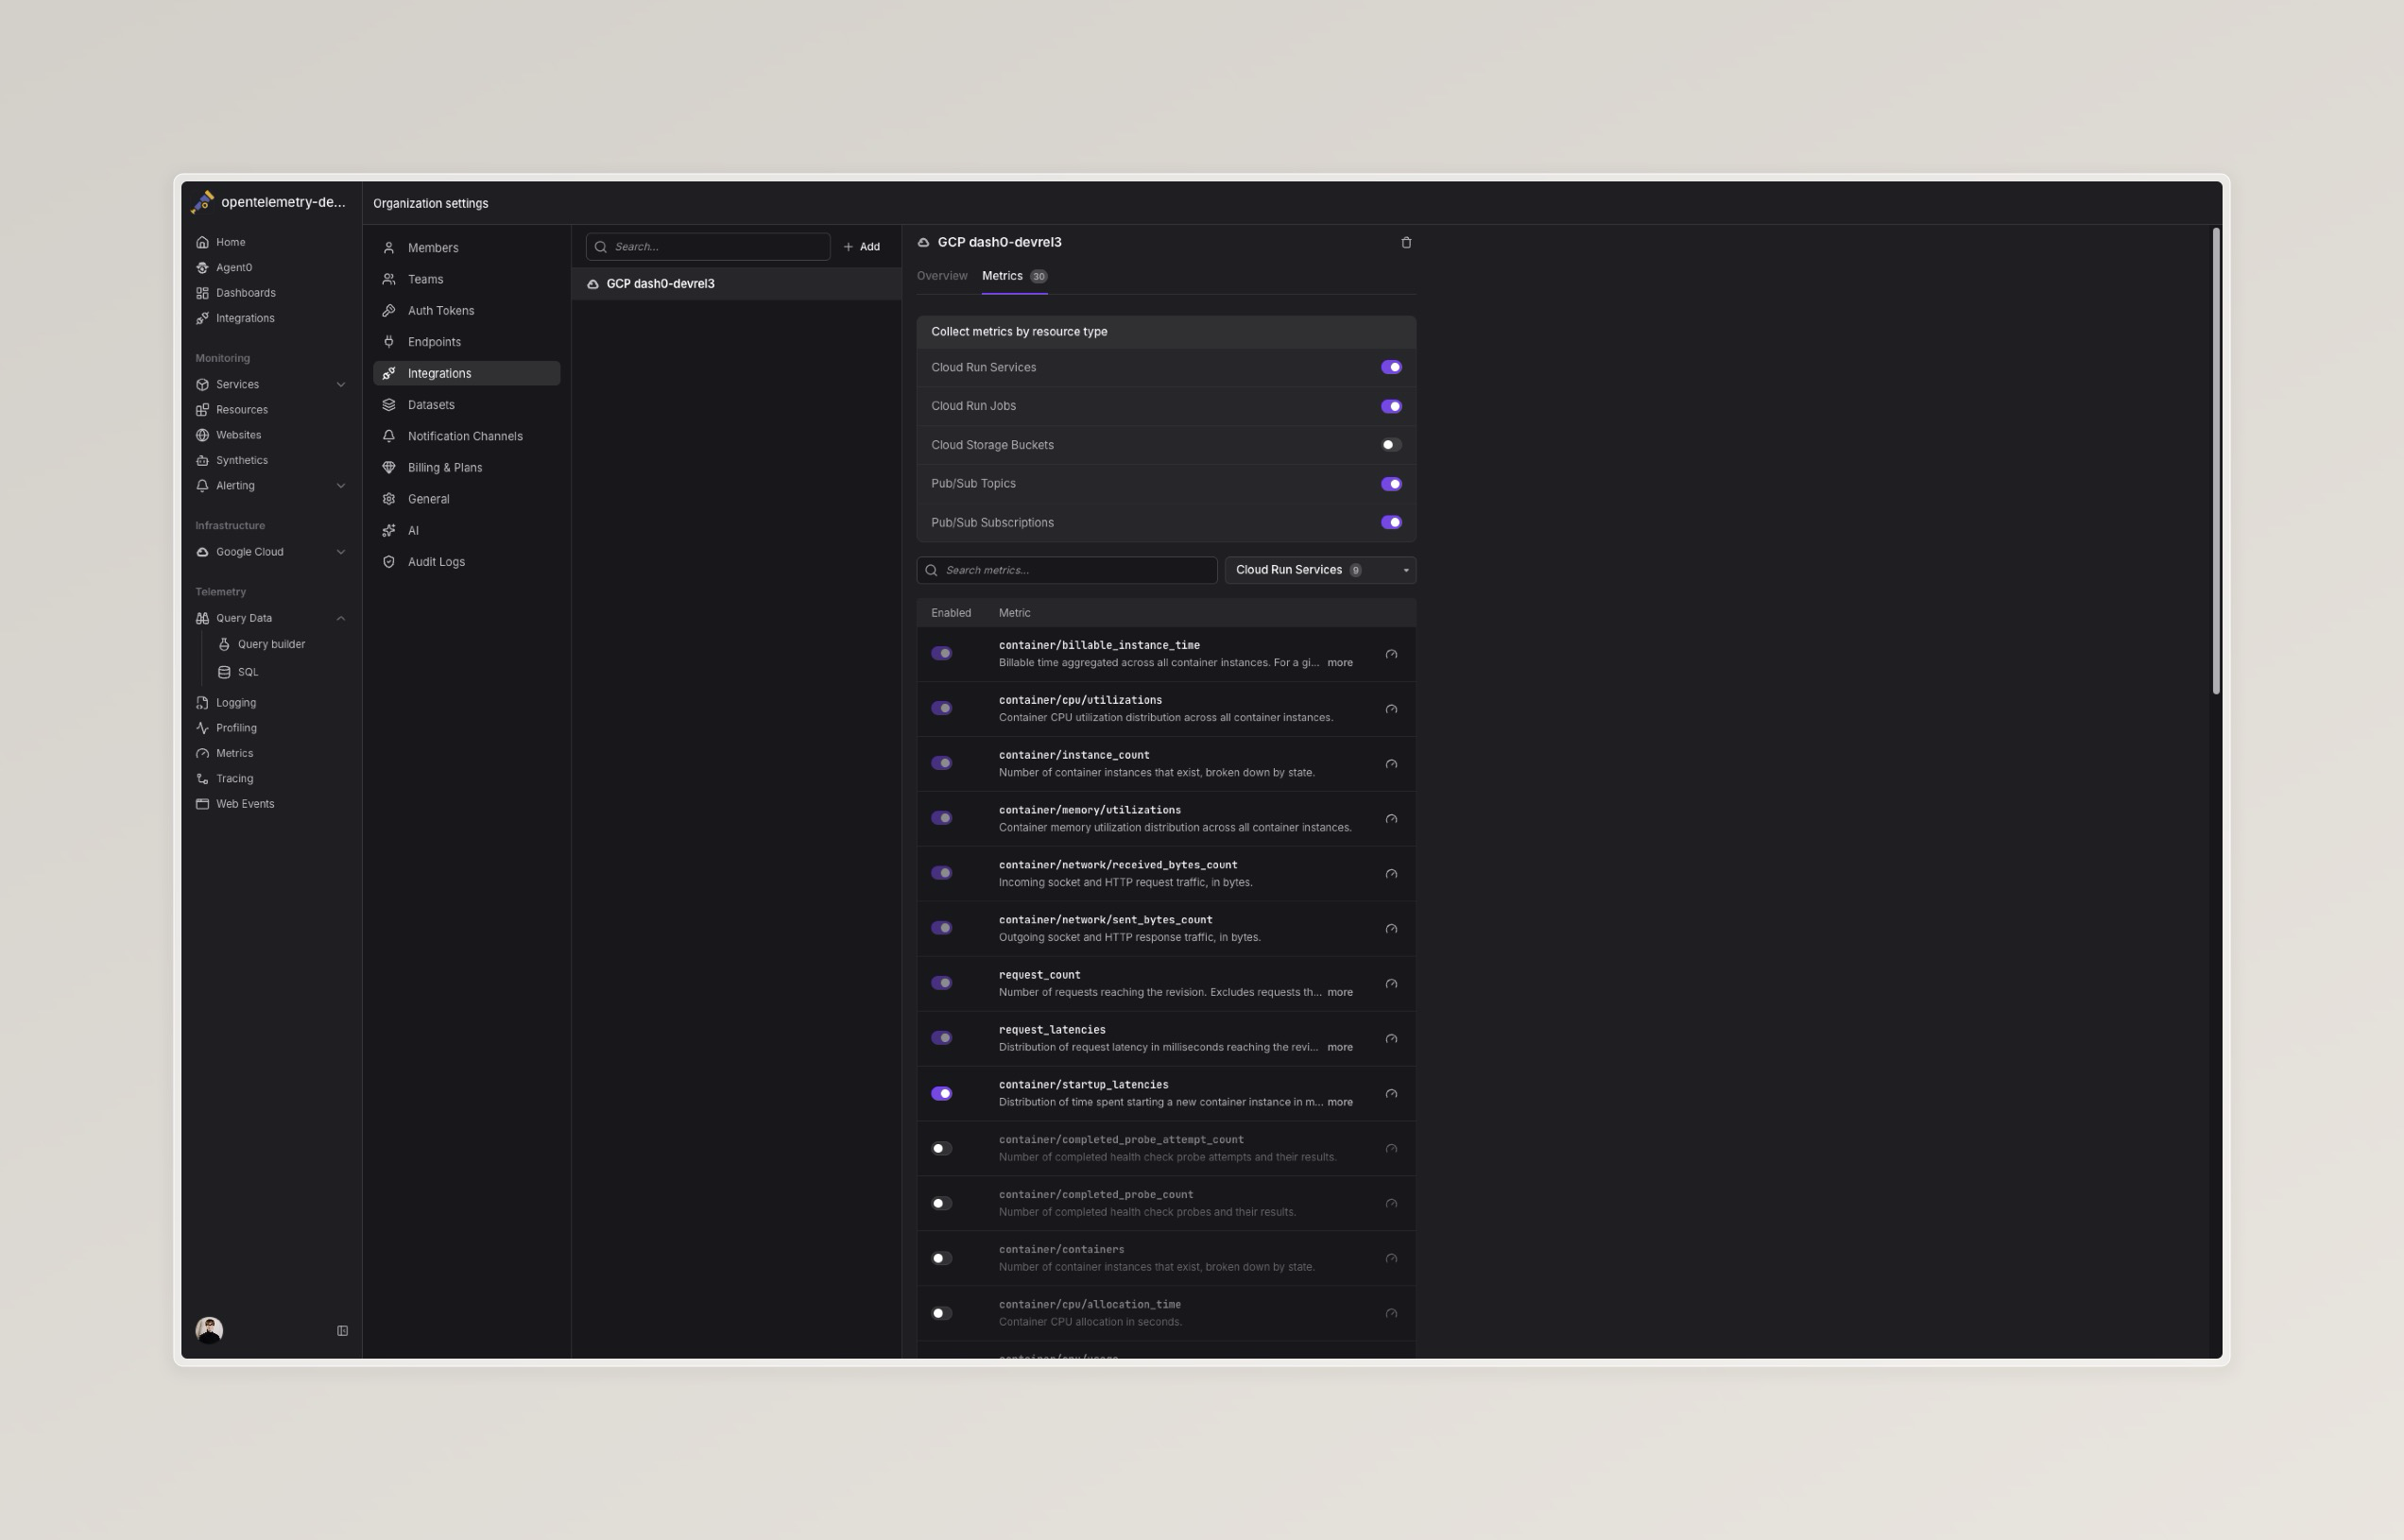
Disabling a resource type stops metrics collection but preserves historical data. Resources of that type will still appear in the infrastructure views, but no new metrics will be collected.
Use resource type controls to manage monitoring costs. If you have GCP resources that don't require active monitoring, disabling their metrics collection can reduce your Dash0 data ingestion.
Collector-Based Setup (Alternative)
If you prefer to use the OpenTelemetry Collector for metrics collection (for example, when running the Collector in your own GKE cluster), you can configure the googlecloudmonitoringreceiver receiver:
1234567891011121314151617181920212223242526receivers:googlecloudmonitoringreceiver:collection_interval: 1mproject_id: YOUR_GCP_PROJECT_IDmetrics_list:- metric_name: "run.googleapis.com/container/cpu/utilizations"- metric_name: "run.googleapis.com/request_count"# ... additional metricsexporters:otlp/dash0:endpoint: YOUR_DASH0_ENDPOINTauth:authenticator: bearertokenauth/dash0extensions:bearertokenauth/dash0:scheme: Bearertoken: ${DASH0_AUTH_TOKEN}service:extensions: [bearertokenauth/dash0]pipelines:metrics:receivers: [googlecloudmonitoringreceiver]exporters: [otlp/dash0]
When running the Collector on GKE, use Workload Identity to bind a Kubernetes service account to a GCP service account with roles/monitoring.viewer. This eliminates the need for service account key files. See the Workload Identity documentation for setup details.
Troubleshooting
If you encounter issues with the GCP integration, the following solutions address common setup and configuration problems.
Metrics Not Appearing
If metrics don't appear after setup:
- Check API enablement: Verify the Cloud Monitoring API is enabled in your GCP project
- Verify billing: Ensure billing is active on your project (Cloud Monitoring requires billing beyond the free tier)
- Confirm permissions: Check that the Dash0 service account has the
roles/monitoring.viewerrole in the target project - Check resource existence: Verify that the services you expect to monitor (Cloud Run, Pub/Sub, etc.) are actually deployed and generating metrics
Missing Specific Services
If some services appear but others don't:
- Region selection: Confirm you've selected the correct regions in the integration settings
- Resource filters: Check if any filters are active that might exclude certain resources
- Recent deployments: Newly created resources may take up to 5 minutes to appear
Permission Errors
If you see permission errors during setup:
- IAM role propagation: IAM changes can take up to 5 minutes to propagate. Wait and retry.
- Organization policies: Check if your GCP organization has policies that restrict service account permissions
- Project-level access: Ensure you have permission to grant IAM roles at the project level
Next Steps
- Monitor Cloud Run Services — Monitor Cloud Run service metrics
- Monitor Pub/Sub — Track message throughput and latency
- Monitor Cloud Storage — Observe bucket usage and API requests