Last updated: June 23, 2026
Monitor Cloud Run Jobs
Dash0 collects metrics for Cloud Run Jobs, providing visibility into batch workload execution, task completion rates, and resource utilization across all jobs in your connected GCP projects.
Cloud Run Jobs metrics help you monitor the health of scheduled and on-demand batch workloads, identify failing tasks, and optimize resource allocation for cost-effective processing.
Viewing Cloud Run Jobs Metrics
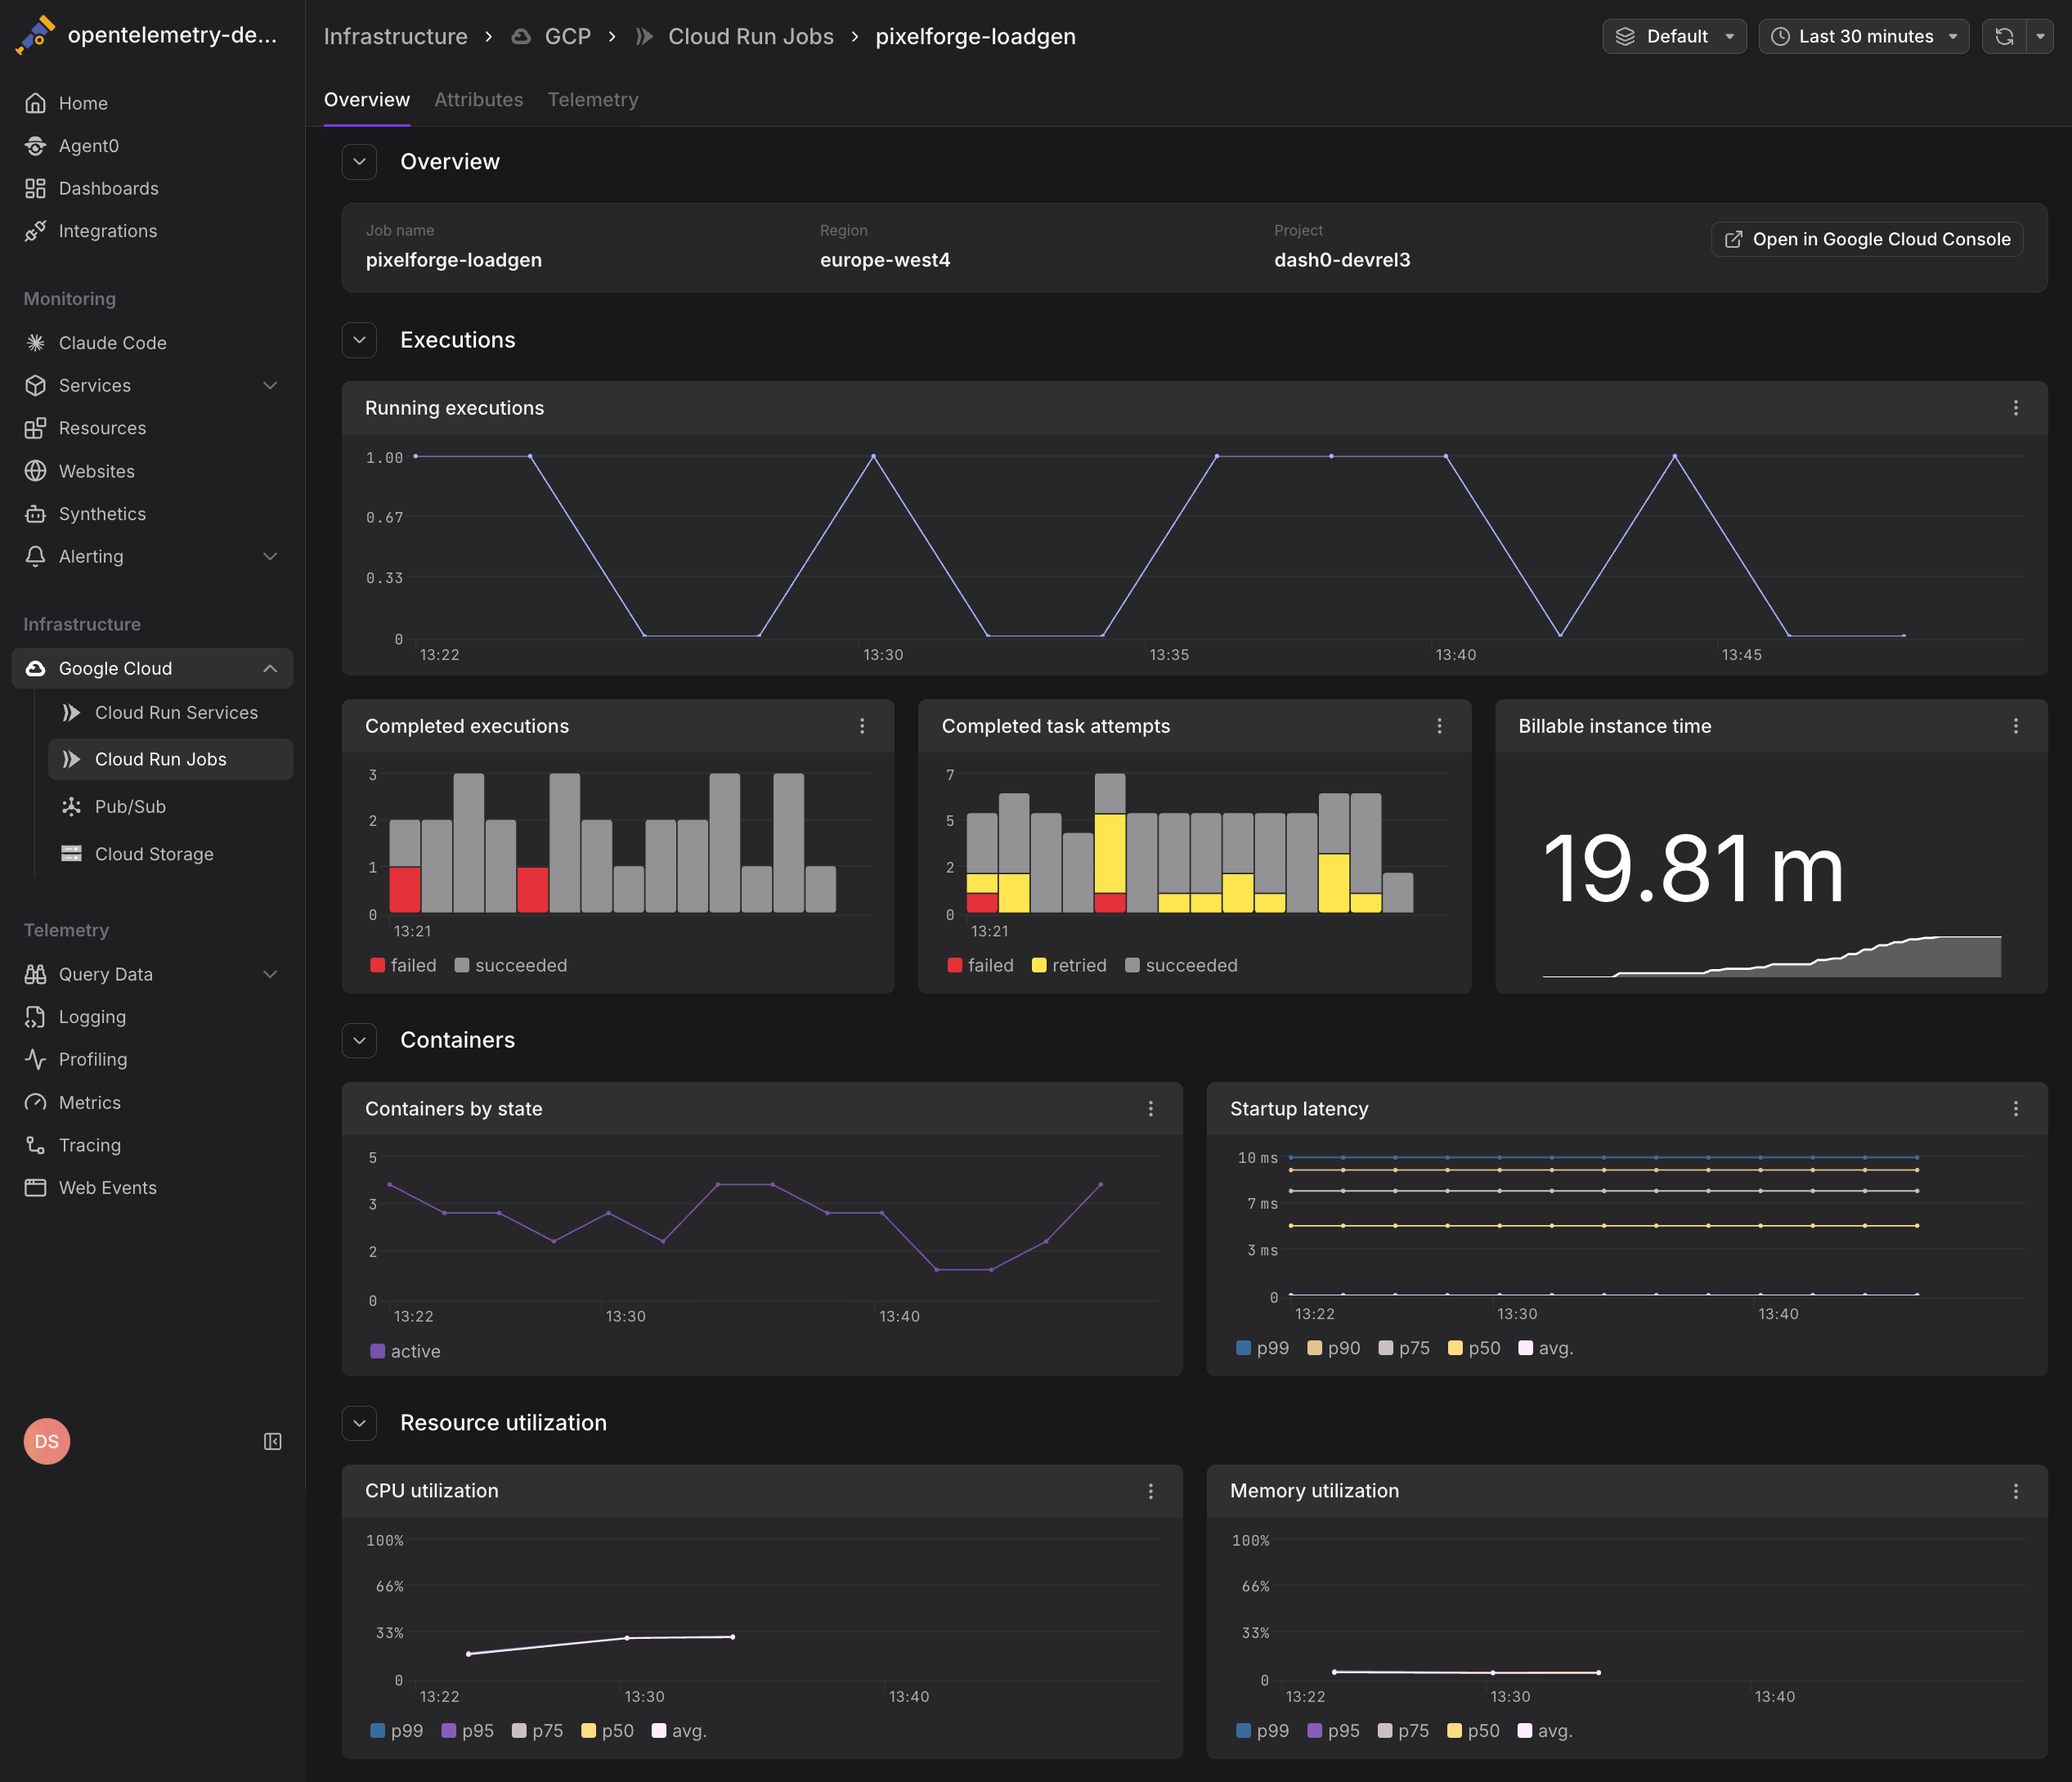
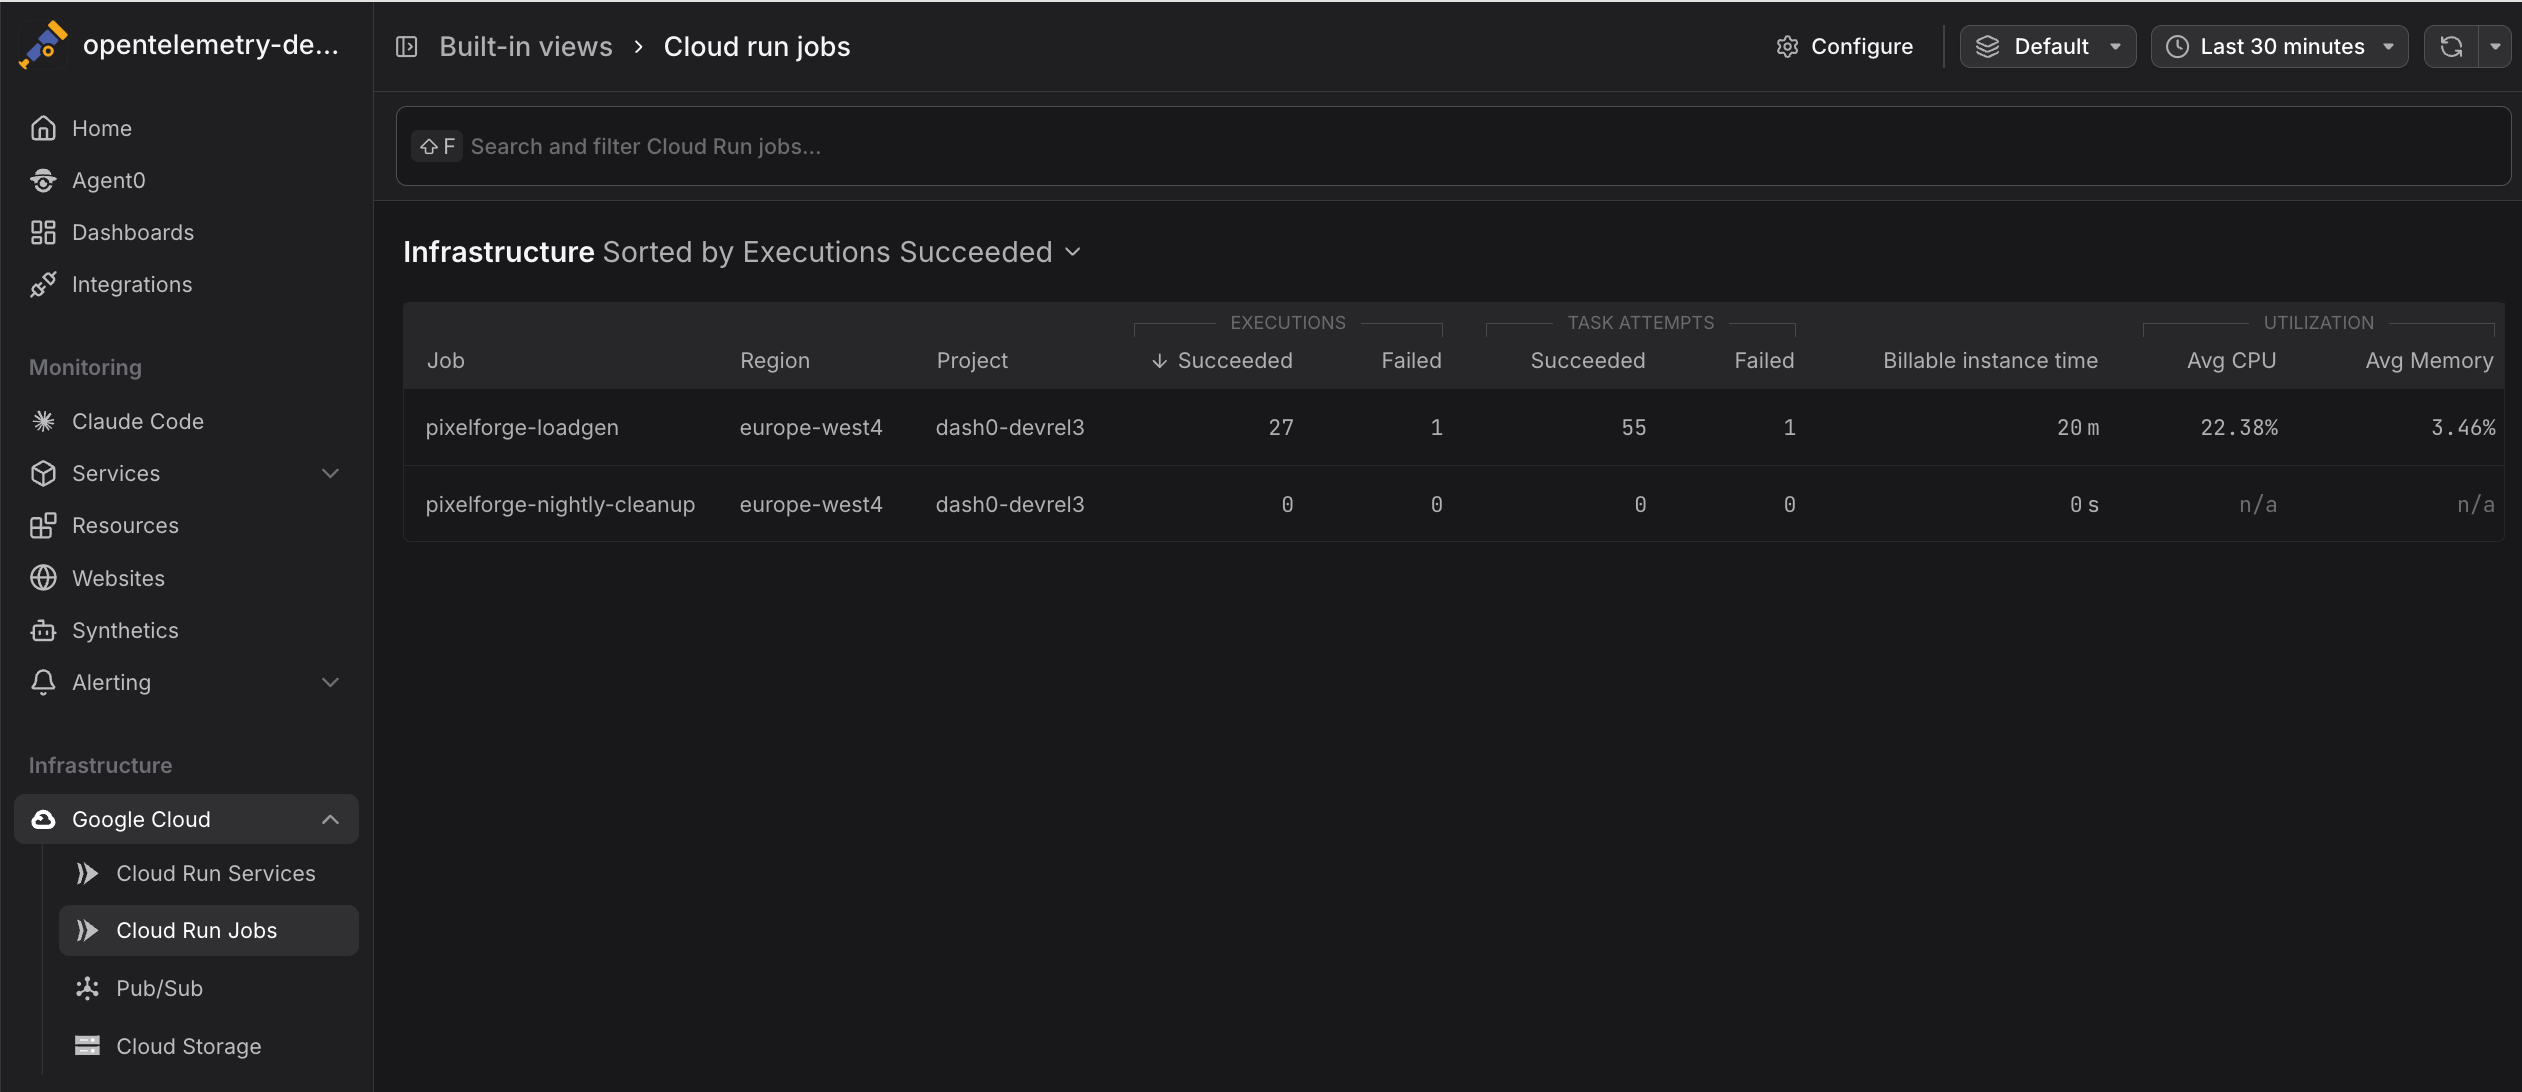
Navigate to Infrastructure > Google Cloud > Cloud Run Jobs to see all Cloud Run jobs across your connected projects. The view displays:
- Job name and region for each Cloud Run job
- Execution status showing recent runs and success rates
- Task metrics including attempts, successes, and failures
- Resource consumption including billable instance time
Click any job to drill into detailed metrics and execution history.
Available Metrics
Dash0 collects the following Cloud Run Jobs metrics from Google Cloud Monitoring. Metrics are stored using their GCP Cloud Monitoring metric type names and can be queried using otel_metric_name in PromQL.
Task Execution
run.googleapis.com/job/completed_task_attempt_count— Total number of completed task attempts (includes both succeeded and failed). Filter byresultlabel to distinguish outcomes:result="succeeded"— Successfully completed tasksresult="failed"— Failed task attempts
Cost and Resource Usage
run.googleapis.com/job/billable_instance_time— Billable instance time (used for cost calculation)
Cloud Run Jobs metrics are aggregated at the job level. Individual task-level metrics can be accessed using the task_index label in PromQL queries when available.
Common Use Cases
Cloud Run Jobs metrics help you monitor batch workload reliability and cost efficiency. The following examples show how to track job health and optimize resource usage.
Monitoring Job Success Rates
Track the ratio of successful to failed task attempts to identify problematic jobs:
1234# Calculate success rate for each jobsum by (job_name) ({otel_metric_name="run.googleapis.com/job/completed_task_attempt_count", result="succeeded"})/sum by (job_name) ({otel_metric_name="run.googleapis.com/job/completed_task_attempt_count"})
If success rates drop below acceptable thresholds, investigate:
- Application logic errors in task processing
- Resource constraints causing tasks to timeout or crash
- External dependencies that may be unavailable
Tracking Job Completion Trends
Monitor run.googleapis.com/job/completed_task_attempt_count over time to understand job execution patterns:
- Scheduled jobs: Verify that cron-triggered jobs execute on schedule
- On-demand jobs: Identify usage patterns and peak execution times
- Retry behavior: Detect if tasks are being retried more frequently than expected
Cost Analysis
Use otel_metric_name="run.googleapis.com/job/billable_instance_time" to understand the cost impact of batch workloads:
Compare billable time across jobs to identify cost-intensive workloads and candidates for optimization.
Detecting Failed Tasks
Alert on increases in failed task attempts to catch issues early:
12# Alert on failed tasks in the last hourincrease({otel_metric_name="run.googleapis.com/job/completed_task_attempt_count", result="failed"}[1h]) > 5
Failed tasks may indicate:
- Application bugs or unhandled exceptions
- Resource exhaustion (CPU, memory, or disk)
- Timeout issues for long-running tasks
- Problems with external services or APIs
Correlating with Application Telemetry
Cloud Run Jobs metrics are most valuable when combined with application-level telemetry:
- Logs from job executions (via Google Cloud Logging or direct OTLP export)
- Traces showing task execution flow and external dependencies
- Custom metrics emitted by job code using OpenTelemetry SDKs
When investigating a failed job, pivot from infrastructure metrics to logs and traces to understand the root cause.
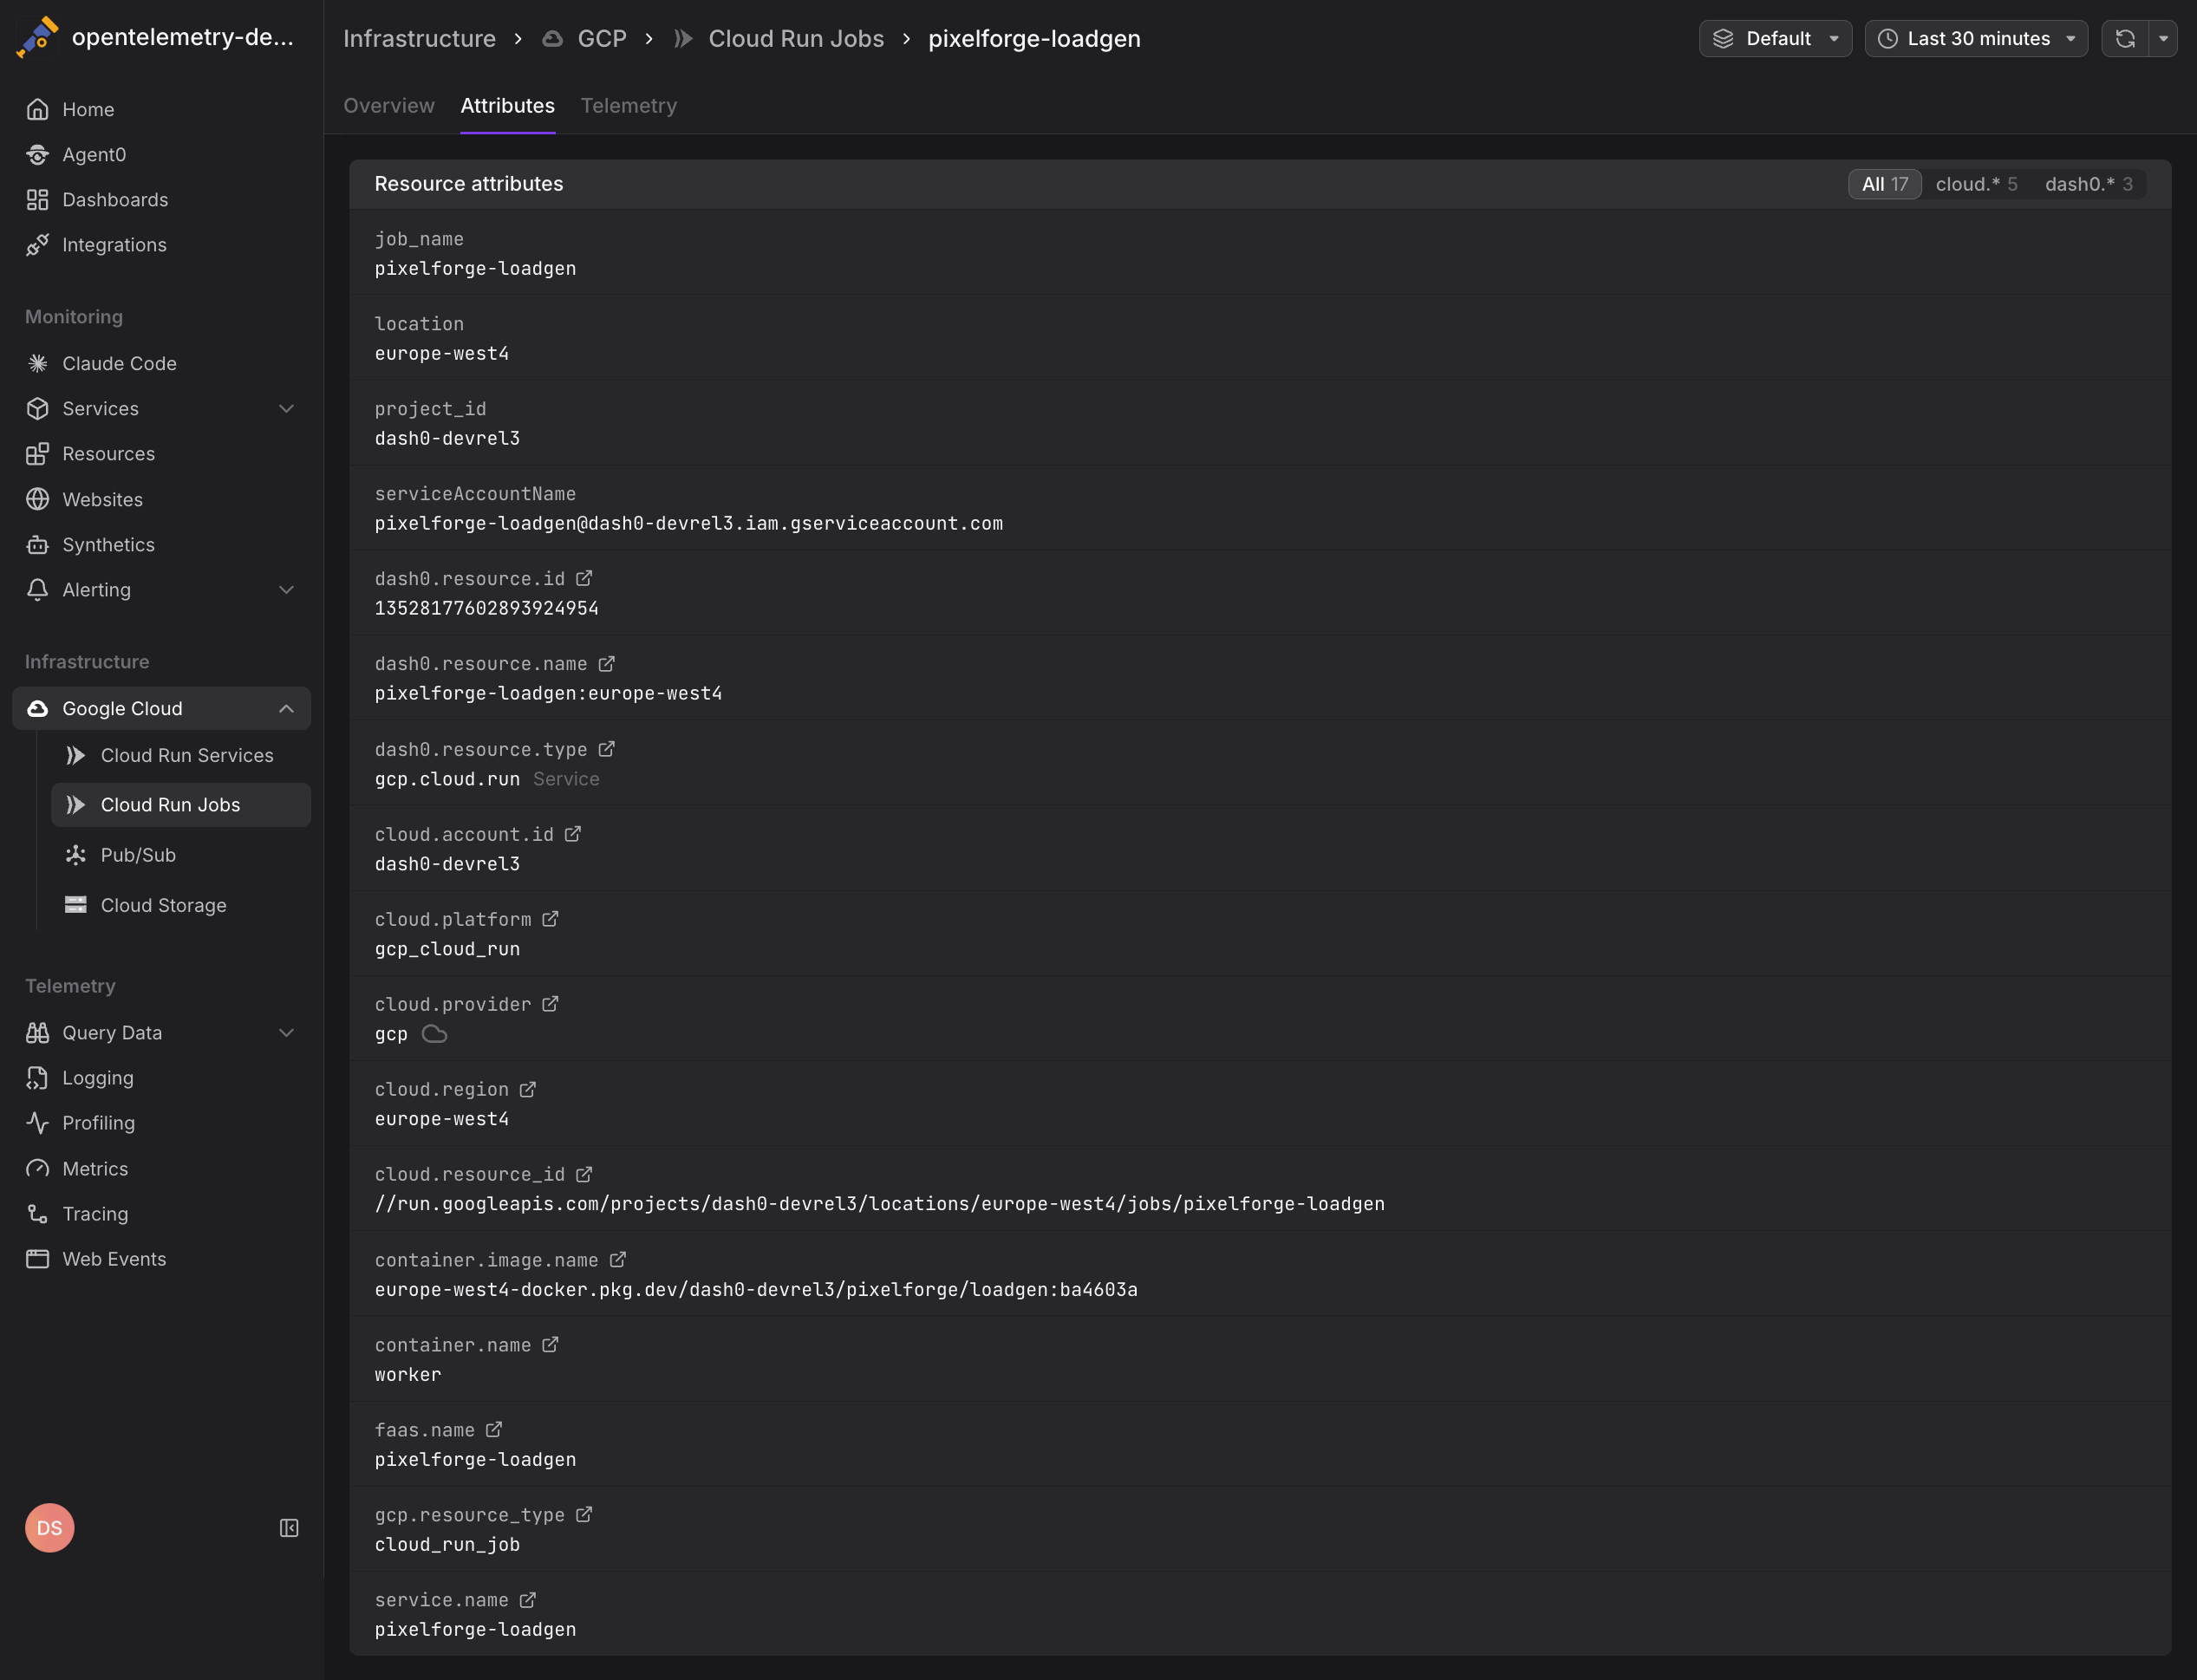
Configure your Cloud Run Jobs to emit OpenTelemetry traces and logs with the faas.name attribute set to the job name. Dash0 will automatically correlate infrastructure metrics with application telemetry. See GCP Resources for attribute conventions.
Querying Cloud Run Jobs Metrics
Use PromQL in the Query Builder to analyze job performance:
12345678910# Total completed tasks by jobsum by (job_name) (gcp_cloud_run_job_completed_task_attempt_count)# Failure rate across all jobssum(rate(gcp_cloud_run_job_failed_task_attempt_count[5m]))/sum(rate(gcp_cloud_run_job_completed_task_attempt_count[5m]))# Cost per job over the last 7 dayssum by (job_name) (increase(gcp_cloud_run_job_billable_instance_time_rate[7d]))
All Cloud Run Jobs metrics include the following labels:
job_name— The Cloud Run job namelocation— The GCP region (e.g.,us-central1)project_id— The GCP project ID
Alerting on Cloud Run Jobs
Create check rules to detect job execution issues:
- High failure rate: Alert when the ratio of failed to completed tasks exceeds thresholds
- Missing executions: Detect when scheduled jobs don't execute on time
- Cost spikes: Notify when billable instance time increases unexpectedly
- Task retries: Alert on excessive retry attempts indicating systemic issues
See Alerting for details on creating check rules with infrastructure metrics.
Differences Between Jobs and Services
Cloud Run Jobs differ from Cloud Run Services in several ways:
- Execution model: Jobs run to completion and terminate, while services handle ongoing HTTP requests
- Scaling: Jobs scale based on task parallelism, while services scale based on request concurrency
- Metrics: Jobs focus on task completion and failure rates, while services emphasize request latency and throughput
- Cost structure: Jobs are billed for total execution time, while services are billed per request and idle time
Use Cloud Run Jobs for batch processing, data pipelines, scheduled tasks, and any workload that runs on a defined schedule or trigger. Use Cloud Run Services for HTTP APIs, webhooks, and request-driven applications.
Further Reading
- Monitor Cloud Run Services — Monitor Cloud Run service metrics
- GCP Resources — Resource naming and equality rules
- Set Up Google Cloud Integration — Configure the GCP integration
- Google Cloud Monitoring Metrics — Full list of available Cloud Run metrics