Last updated: June 23, 2026
Monitor Pub/Sub
Dash0 automatically collects metrics for Pub/Sub topics and subscriptions in your connected GCP projects, providing visibility into message flow, latency, retention, and subscription health.
Pub/Sub metrics help you understand message processing patterns, identify bottlenecks in your event-driven architecture, and ensure subscribers are keeping up with message volume.
Viewing Pub/Sub Metrics
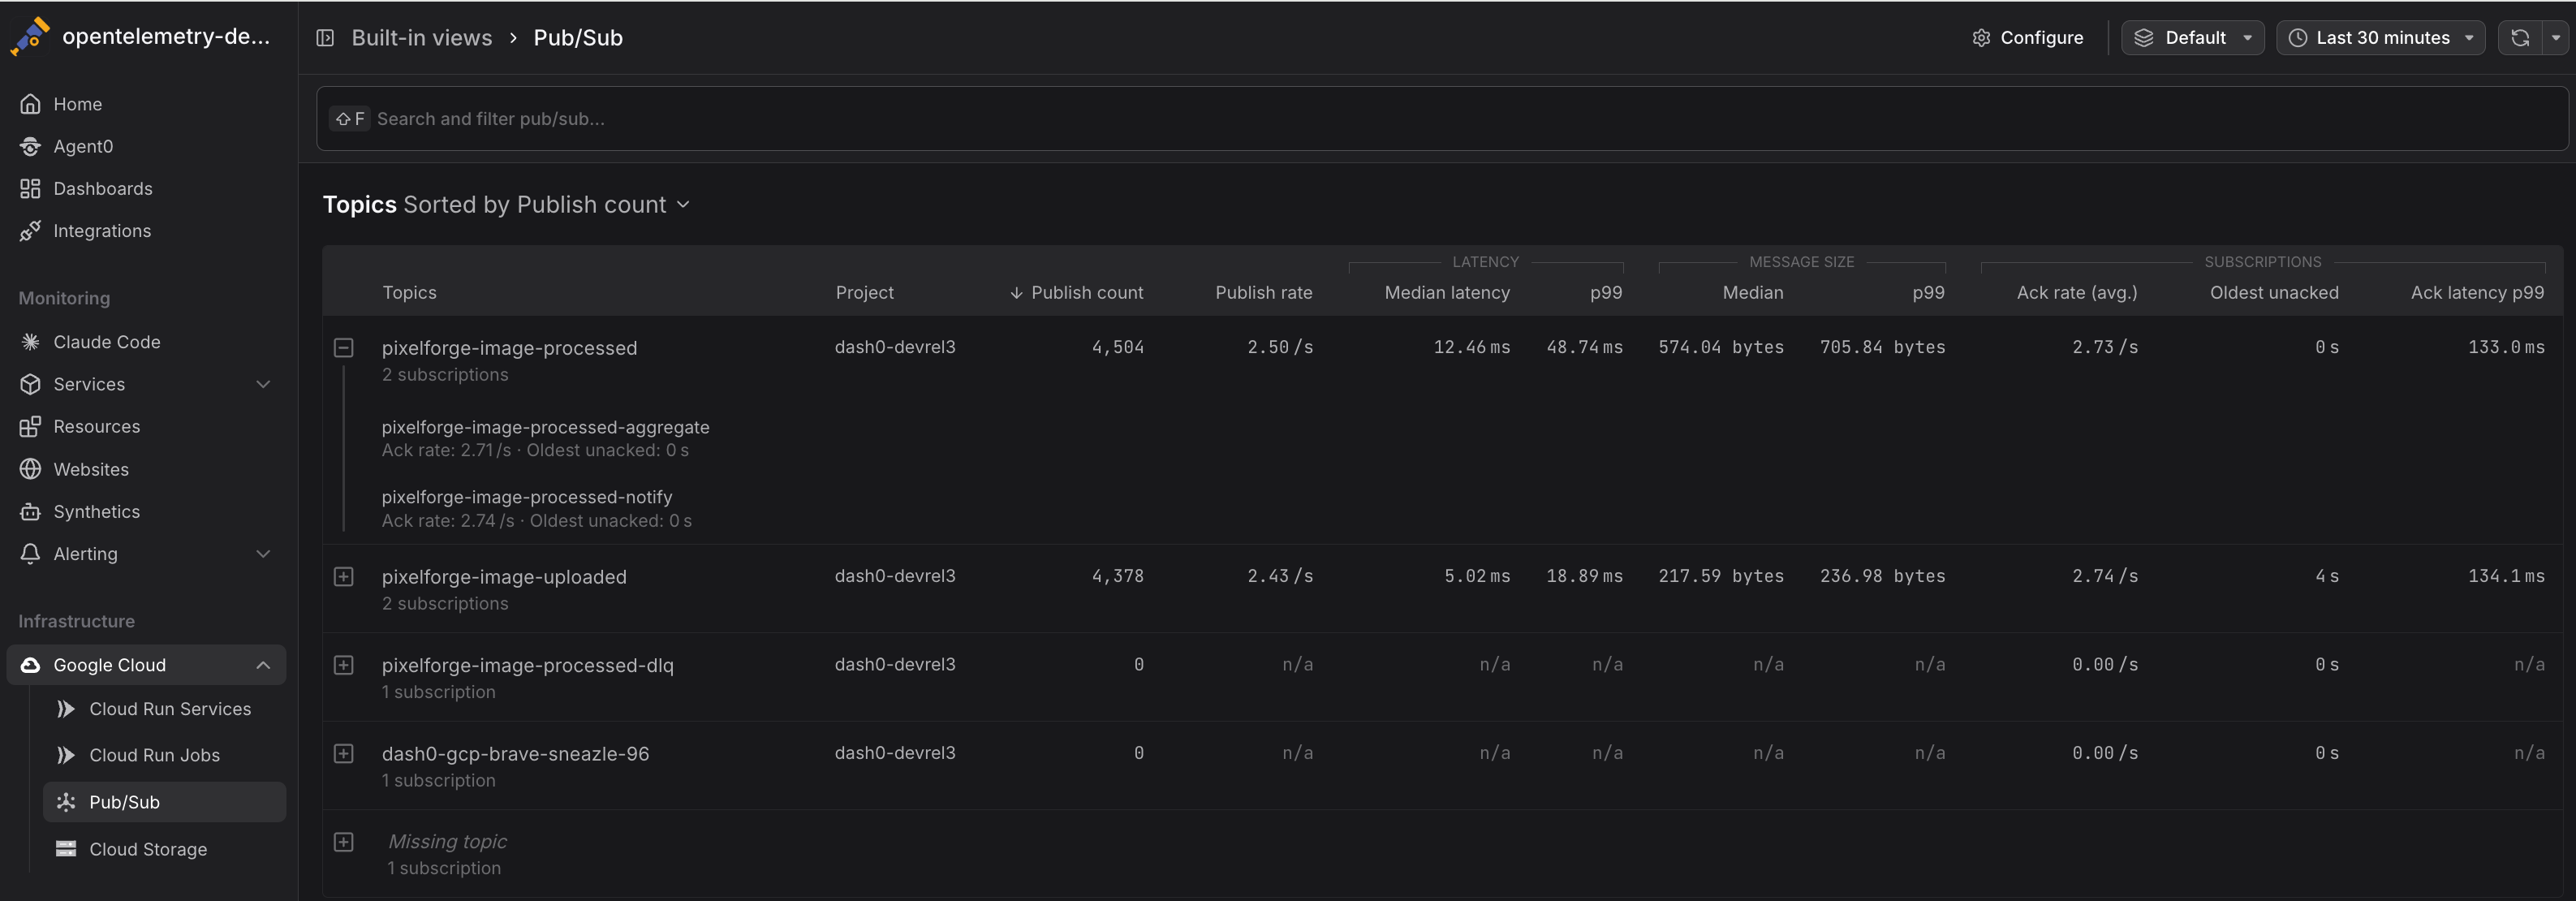
Navigate to Infrastructure > Google Cloud > Pub/Sub to see all Pub/Sub topics and subscriptions across your connected projects. The view displays:
- Topic and subscription names with their associated projects and regions
- Message throughput showing publish and acknowledgment rates
- Backlog metrics indicating undelivered messages and retention
- Latency percentiles for message publishing and acknowledgment
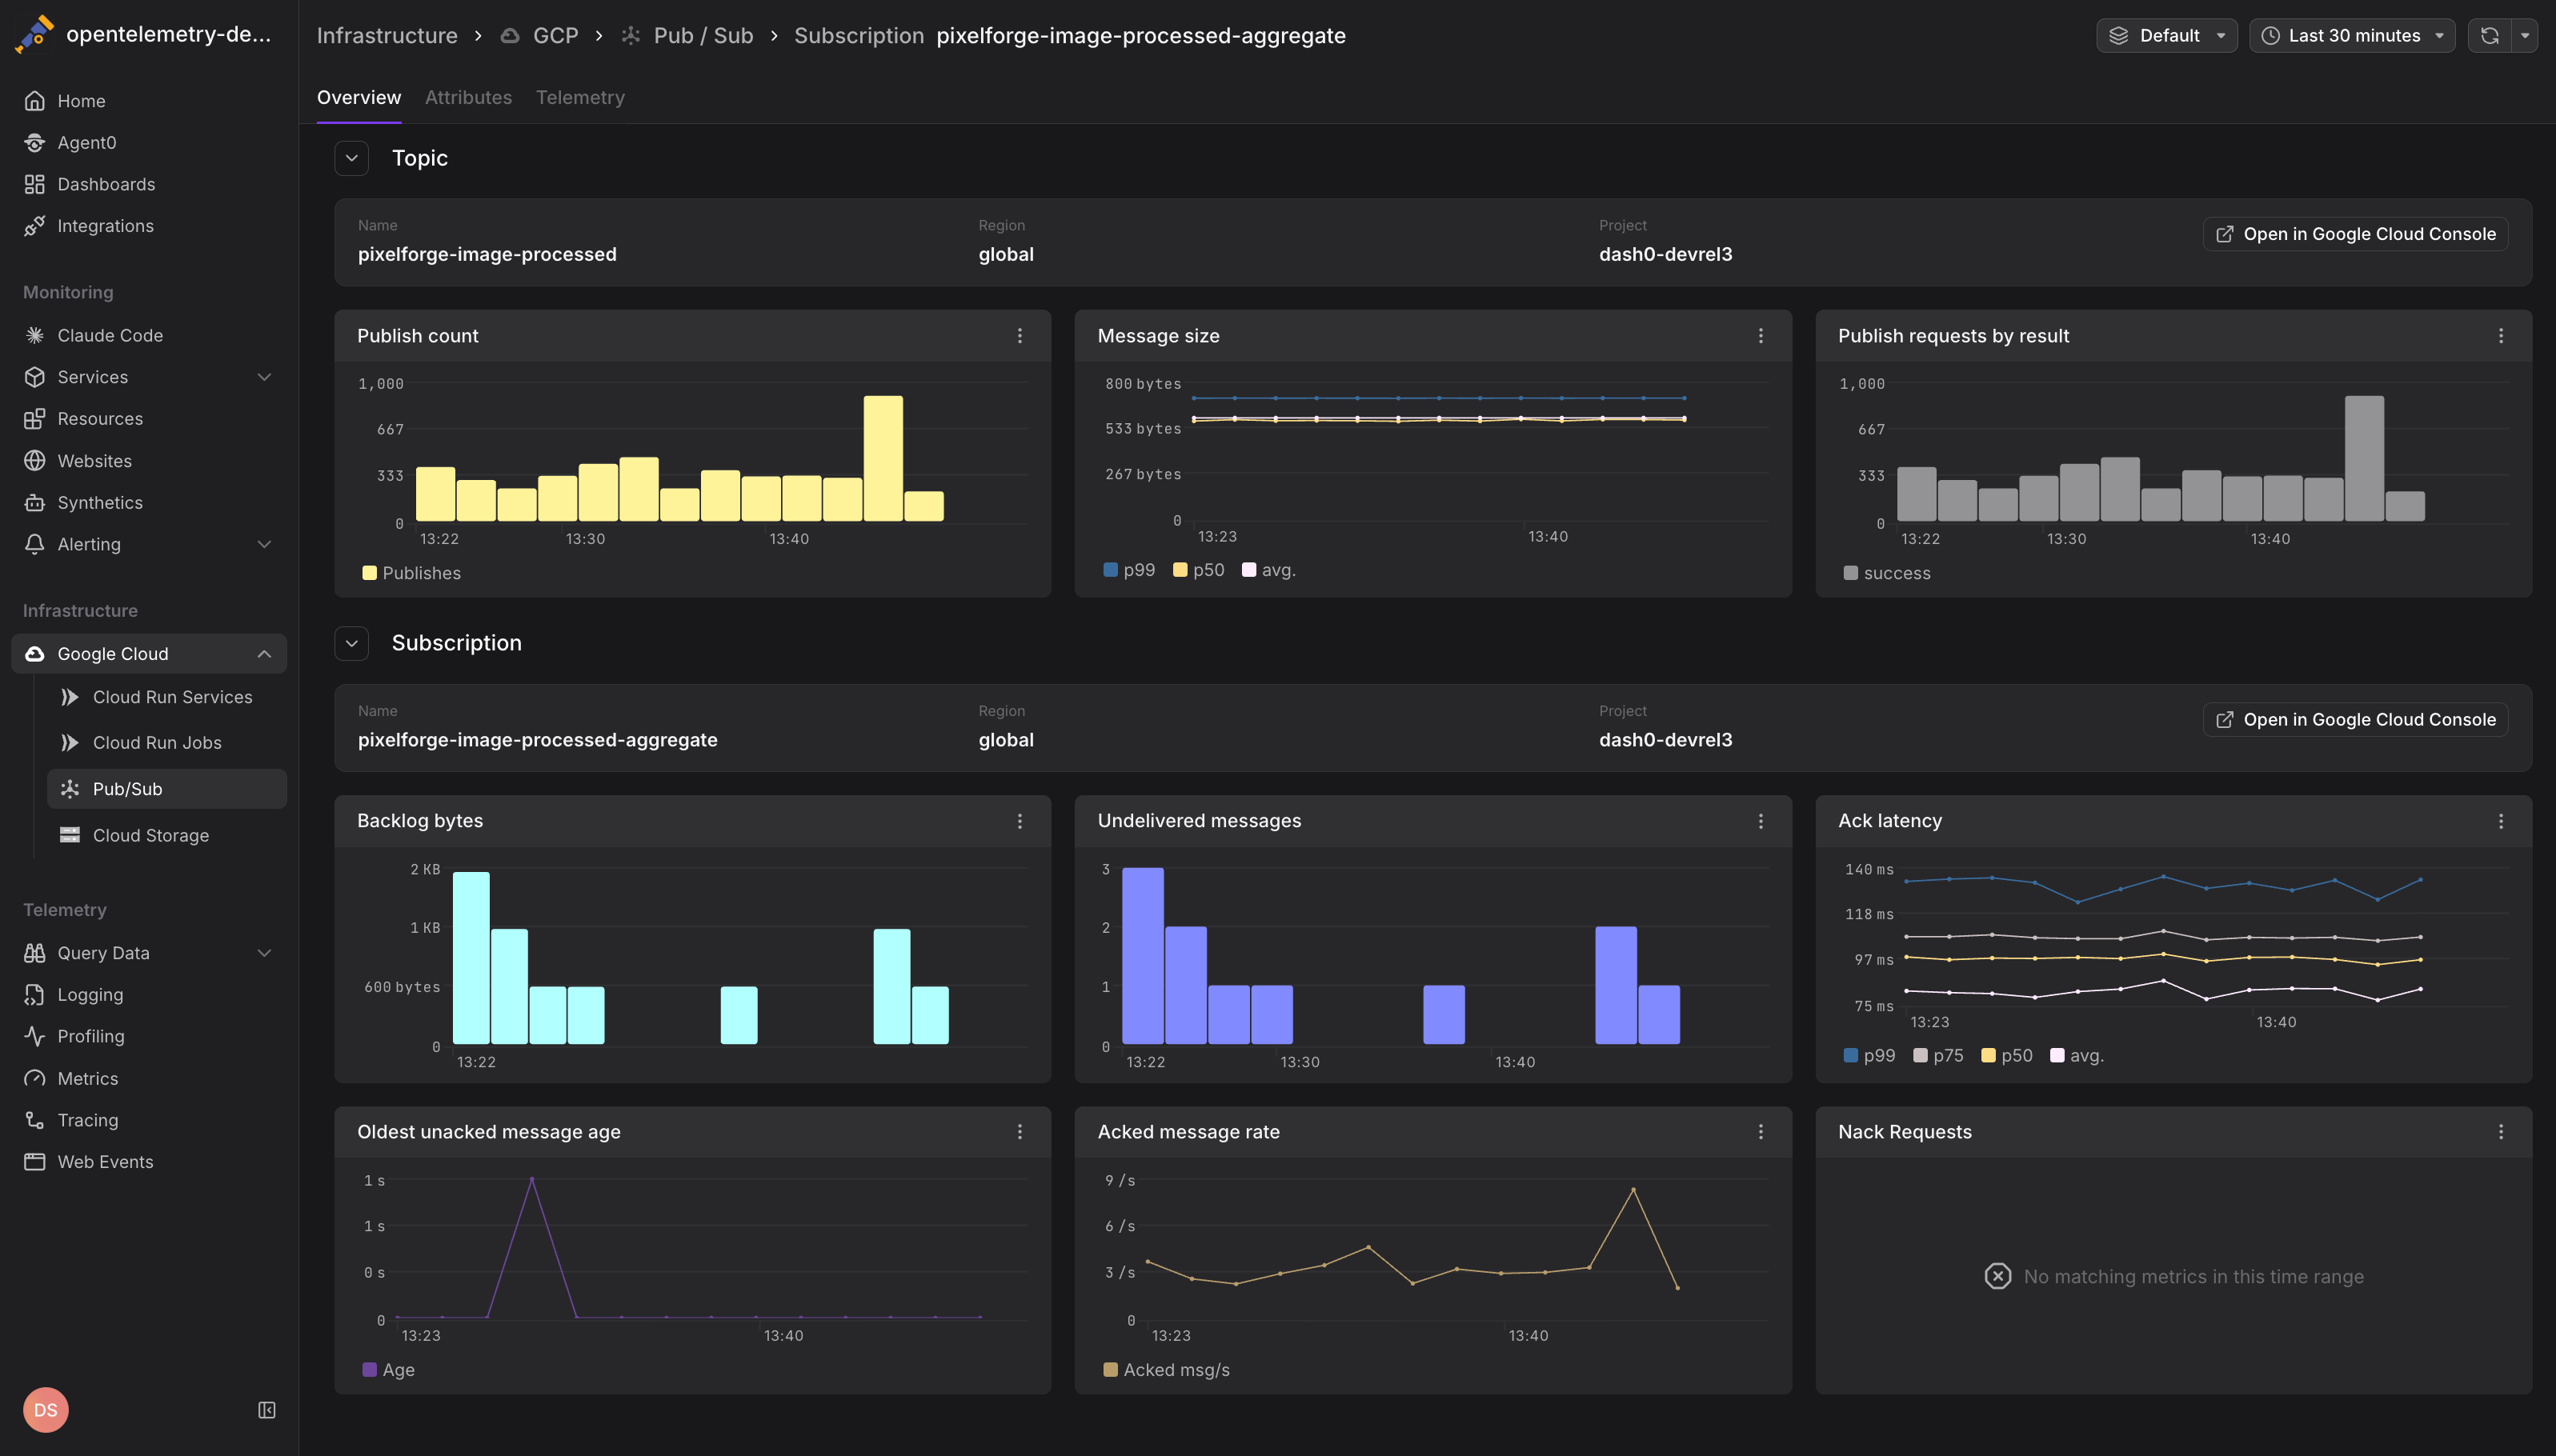
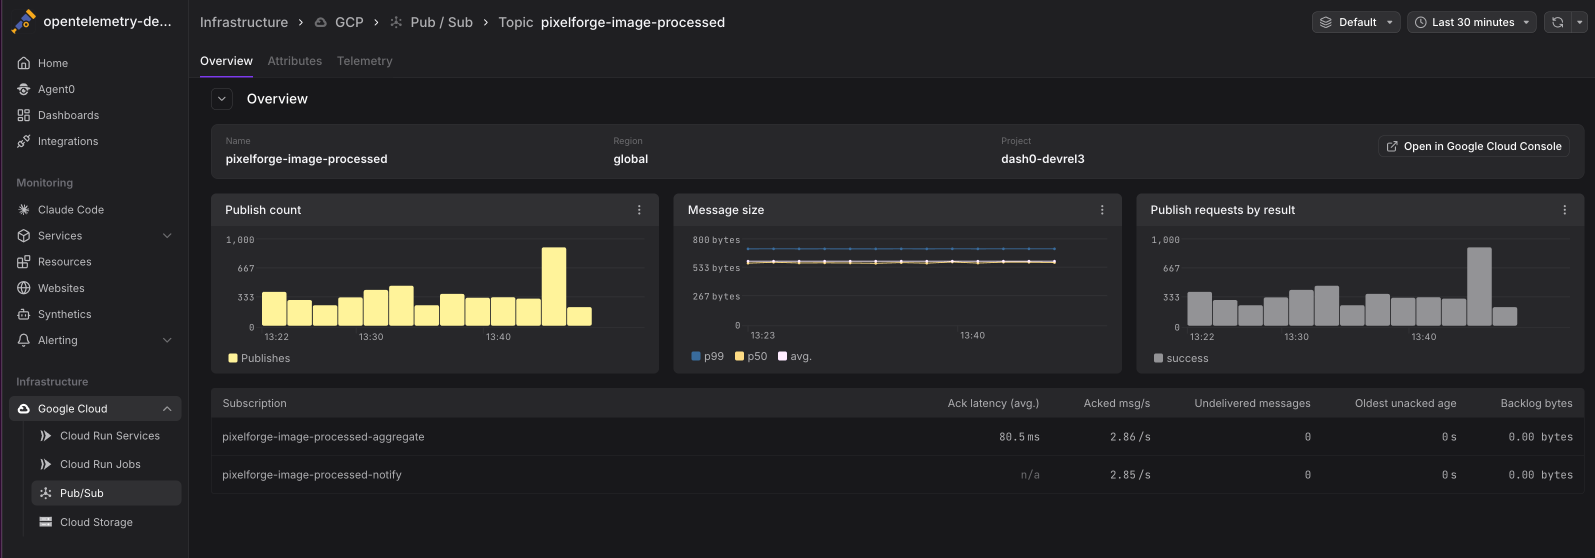
Click any topic or subscription to drill into detailed metrics and time-series charts.
Common Use Cases
Pub/Sub metrics help you maintain reliable message delivery and identify processing bottlenecks. The following examples show practical ways to monitor publisher and subscriber health.
Detecting Message Backlogs
Monitor pubsub.googleapis.com/subscription/num_undelivered_messages and pubsub.googleapis.com/subscription/oldest_unacked_message_age to identify subscriptions falling behind:
12345# Subscriptions with backlogs over 1000 messages{otel_metric_name="pubsub.googleapis.com/subscription/num_undelivered_messages"} > 1000# Subscriptions with messages older than 5 minutes{otel_metric_name="pubsub.googleapis.com/subscription/oldest_unacked_message_age"} > 300
Growing backlogs suggest:
- Consumers are processing messages too slowly
- Consumer instances have crashed or scaled down
- Message processing errors are causing excessive retries
- Traffic spikes have exceeded consumer capacity
Monitoring Publisher Performance
Track pubsub.googleapis.com/topic/send_request_count and pubsub.googleapis.com/topic/send_request_latencies to understand publisher behavior:
12345# Publish rate by topicsum by (topic_id) (rate({otel_metric_name="pubsub.googleapis.com/topic/send_request_count"}[5m]))# High latency topics (99th percentile)histogram_quantile(0.99, sum by (le, topic_id) (rate({otel_metric_name="pubsub.googleapis.com/topic/send_request_latencies"}[5m]))) > 0.5
High publish latency may indicate:
- Network congestion between publishers and Pub/Sub
- Large message sizes slowing down transmission
- Pub/Sub quotas being reached
- Regional capacity constraints
Analyzing Message Retention
Use pubsub.googleapis.com/topic/num_retained_messages and pubsub.googleapis.com/topic/oldest_retained_message_age to understand retention patterns:
12345# Topics with significant retained messages{otel_metric_name="pubsub.googleapis.com/topic/num_retained_messages"} > 10000# Topics retaining old messages{otel_metric_name="pubsub.googleapis.com/topic/oldest_retained_message_age"} > 86400 # 24 hours
High retention counts may indicate:
- Subscriptions not consuming messages fast enough
- Dead letter queues accumulating failed messages
- Misconfigured retention policies
- Cost implications from long-term message storage
Tracking Consumer Health
Monitor acknowledgment patterns to assess consumer health:
12345# Acknowledgment rate by subscriptionsum by (subscription_id) (rate({otel_metric_name="pubsub.googleapis.com/subscription/ack_message_count"}[5m]))# High negative acknowledgment rate (processing failures)rate({otel_metric_name="pubsub.googleapis.com/subscription/nack_requests"}[5m]) > 10
High nack_requests rates suggest:
- Application errors during message processing
- Invalid message formats or corrupted data
- Timeouts in downstream dependencies
- Resource constraints causing processing failures
Identifying Slow Consumers
Compare pubsub.googleapis.com/subscription/ack_latencies across subscriptions to find slow consumers:
12# Slowest subscriptions by acknowledgment latency (99th percentile)topk(5, histogram_quantile(0.99, sum by (le, subscription_id) (rate({otel_metric_name="pubsub.googleapis.com/subscription/ack_latencies"}[5m]))))
High acknowledgment latency indicates:
- CPU-intensive message processing
- Blocking I/O operations in consumer code
- Inefficient database queries or API calls
- Insufficient consumer instances to handle load
Correlating with Application Telemetry
Pub/Sub metrics become more actionable when correlated with application-level telemetry:
- Traces showing message publishing and consumption spans
- Logs from publishers and subscribers
- Custom metrics tracking business logic outcomes
When investigating Pub/Sub issues, pivot from infrastructure metrics to application traces to understand the full message lifecycle.
Instrument your Pub/Sub publishers and subscribers with OpenTelemetry to emit traces with the messaging.system, messaging.destination, and messaging.operation attributes. Dash0 will correlate these with infrastructure metrics. See Messaging Semantic Conventions for details.
Querying Pub/Sub Metrics
Metrics are stored using their GCP Cloud Monitoring metric type names and can be queried using otel_metric_name in PromQL.
Use PromQL in the Query Builder to create custom Pub/Sub dashboards:
12345678910111213# Message throughput by topicsum by (topic_id) (rate({otel_metric_name="pubsub.googleapis.com/topic/send_request_count"}[5m]))# Subscription backlog growth ratederiv({otel_metric_name="pubsub.googleapis.com/subscription/num_undelivered_messages"}[10m])# Consumer lag (oldest unacknowledged message age)max by (subscription_id) ({otel_metric_name="pubsub.googleapis.com/subscription/oldest_unacked_message_age"})# Acknowledgment success ratesum(rate({otel_metric_name="pubsub.googleapis.com/subscription/ack_message_count"}[5m]))/(sum(rate({otel_metric_name="pubsub.googleapis.com/subscription/ack_message_count"}[5m])) + sum(rate({otel_metric_name="pubsub.googleapis.com/subscription/nack_requests"}[5m])))
All Pub/Sub metrics include the following labels:
topic_id— The Pub/Sub topic namesubscription_id— The subscription name (for subscription metrics)project_id— The GCP project ID
Best Practices
Apply these recommendations to maintain reliable message delivery and effective monitoring.
- Monitor both topics and subscriptions: Publisher and consumer issues manifest differently in metrics
- Set appropriate retention policies: Balance message durability with storage costs
- Track message sizes: Large messages impact throughput and costs
- Use dead letter queues: Prevent poison messages from blocking subscriptions
- Correlate with application traces: Infrastructure metrics show what is slow, traces show why
Further Reading
- Monitor Cloud Run Services — Monitor Cloud Run consumers of Pub/Sub messages
- GCP Resources — Resource naming and equality rules
- Set Up Google Cloud Integration — Configure the GCP integration
- Google Cloud Monitoring Metrics — Full list of available Pub/Sub metrics
- Messaging Semantic Conventions — OpenTelemetry messaging attributes