Last updated: June 23, 2026
Monitor Cloud Storage
Dash0 automatically collects metrics for Cloud Storage buckets in your connected GCP projects, providing visibility into API usage, network traffic, storage consumption, and access patterns.
Cloud Storage metrics help you understand how applications interact with your buckets, identify performance bottlenecks, optimize costs, and detect unusual access patterns that may indicate security issues.
Viewing Cloud Storage Metrics
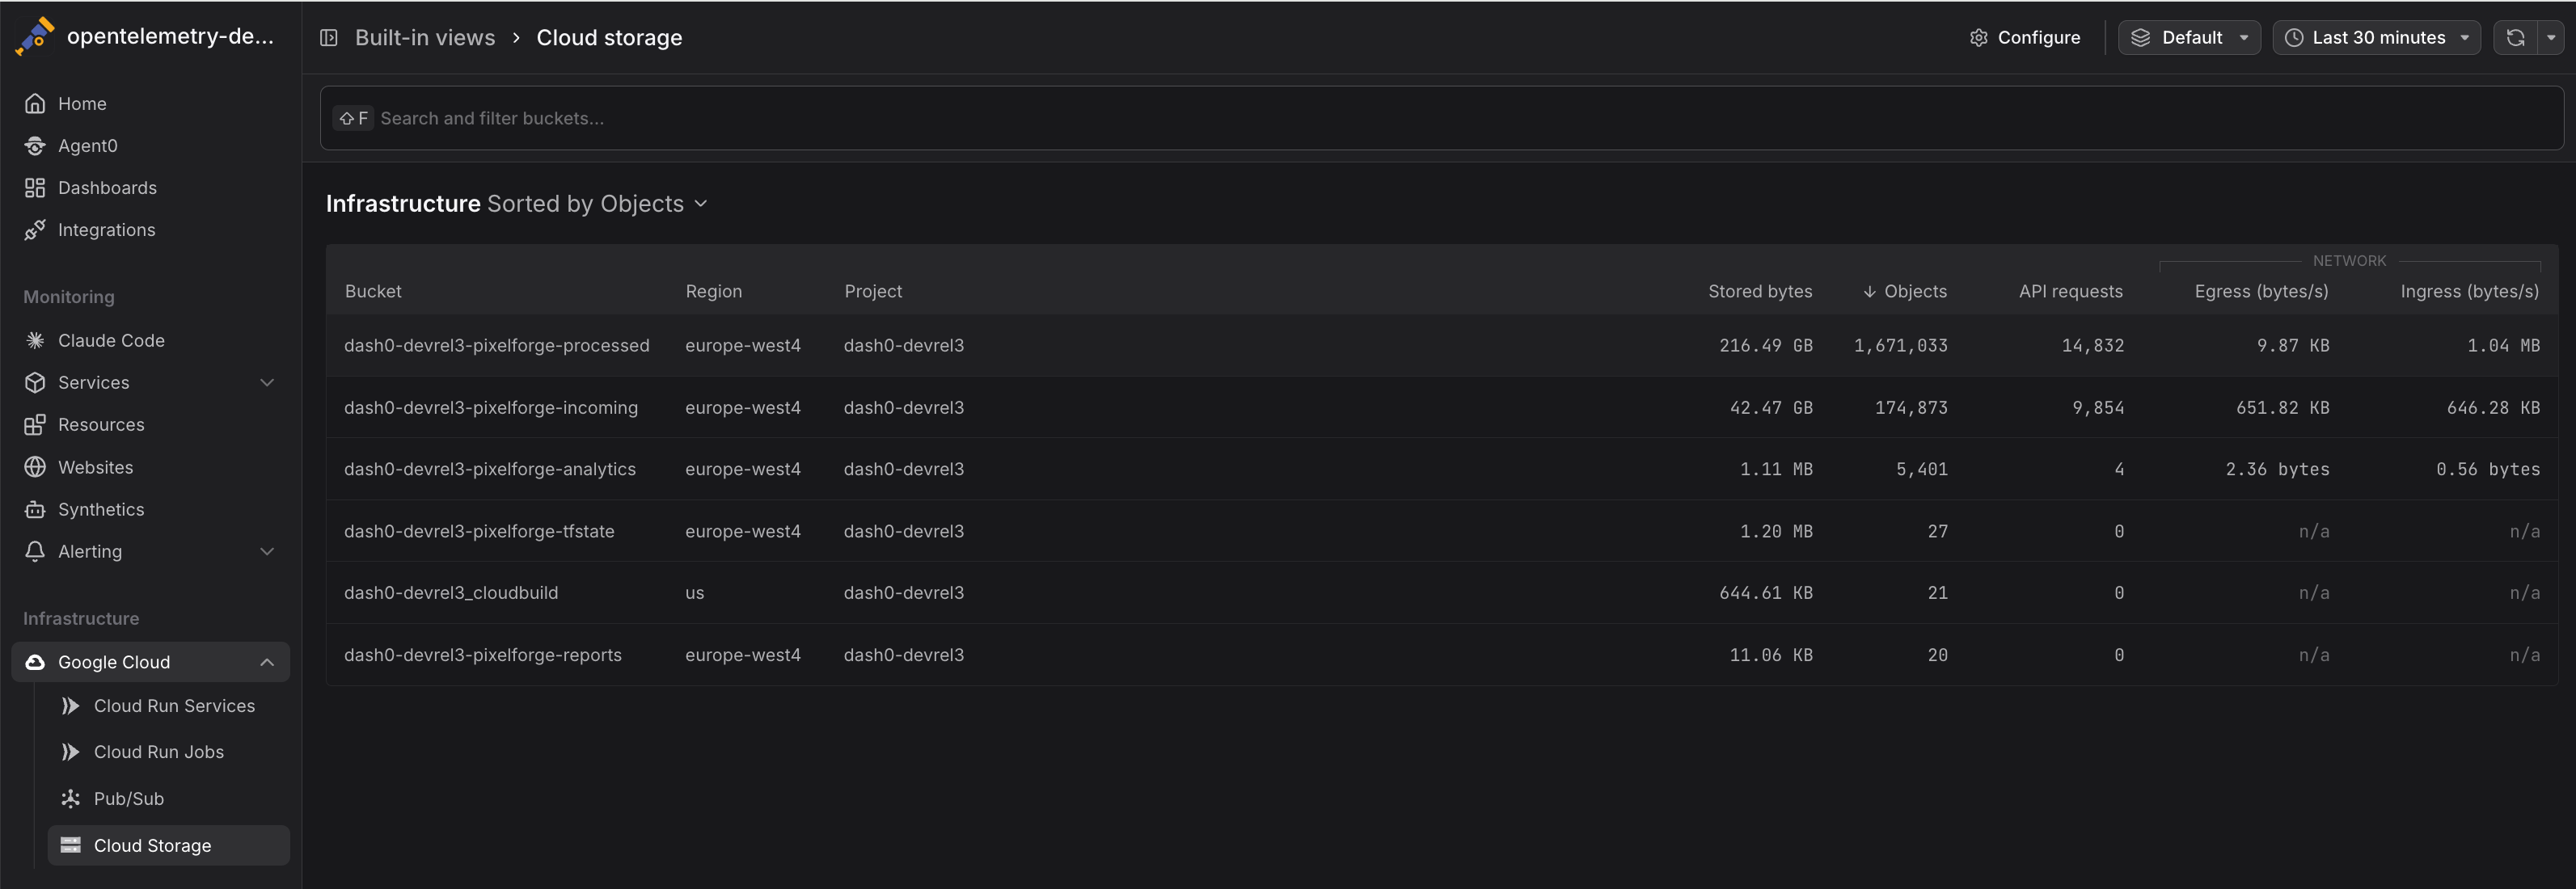
Navigate to Infrastructure > Google Cloud > Cloud Storage to see all Cloud Storage buckets across your connected projects. The view displays:
- Bucket names with associated projects
- API request rates showing read and write operations
- Network traffic indicating data transfer volumes
- Storage metrics tracking total size and object counts
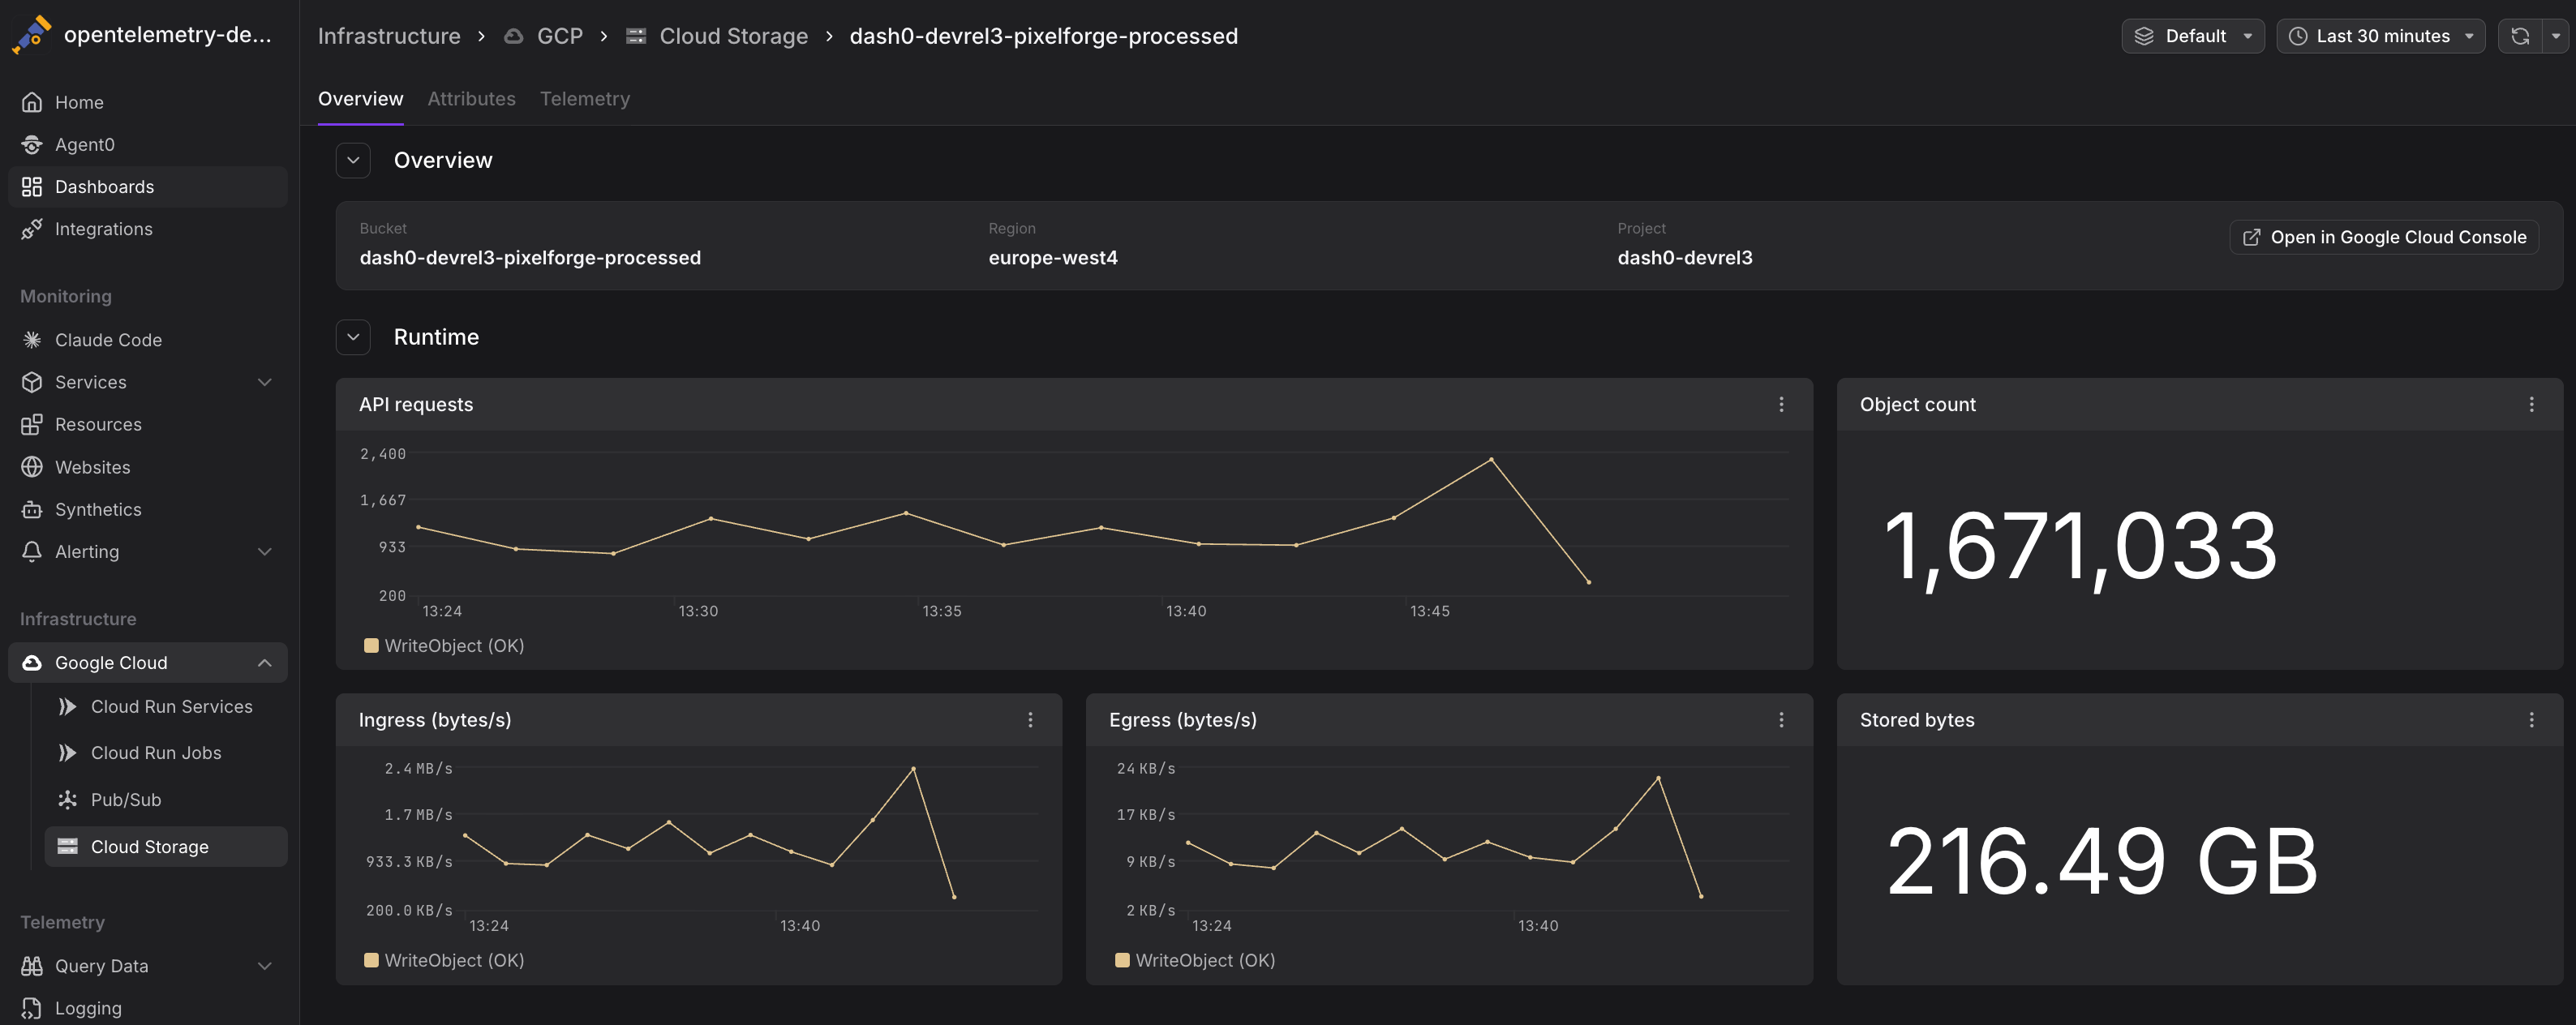
Click any bucket to drill into detailed metrics and time-series charts.
Common Use Cases
Cloud Storage metrics support several operational scenarios, from cost optimization to security monitoring. The following examples demonstrate practical ways to use these metrics in your workflows.
Monitoring API Usage Patterns
Track storage.googleapis.com/api/request_count to understand access patterns and identify peak usage times:
12345# API request rate by bucketsum by (bucket_name) (rate({otel_metric_name="storage.googleapis.com/api/request_count"}[5m]))# Identify high-traffic bucketstopk(10, sum by (bucket_name) (rate({otel_metric_name="storage.googleapis.com/api/request_count"}[1h])))
High API request rates may indicate:
- Popular content being frequently accessed
- Inefficient application code making redundant requests
- Batch jobs or data pipelines performing bulk operations
- Potential abuse or unauthorized access attempts
Analyzing Network Traffic
Use network metrics to understand data transfer costs and optimize bandwidth usage:
1234567# Total egress traffic by bucket (bytes per second)sum by (bucket_name) (rate({otel_metric_name="storage.googleapis.com/network/sent_bytes_count"}[5m]))# Ingress vs egress ratiosum(rate({otel_metric_name="storage.googleapis.com/network/received_bytes_count"}[5m]))/sum(rate({otel_metric_name="storage.googleapis.com/network/sent_bytes_count"}[5m]))
High egress rates contribute to network costs. Consider:
- Caching frequently accessed objects
- Using Cloud CDN for public content
- Collocating compute resources in the same region as buckets
- Implementing lifecycle policies to archive cold data
Tracking Storage Growth
Monitor storage.googleapis.com/storage/total_bytes and storage.googleapis.com/storage/object_count over time to understand storage trends:
12345# Storage growth rate (bytes per day)deriv({otel_metric_name="storage.googleapis.com/storage/total_bytes"}[1d]) * 86400# Buckets approaching size thresholds{otel_metric_name="storage.googleapis.com/storage/total_bytes"} > 1e12 # 1 TB
Understanding storage growth helps:
- Forecast storage costs
- Plan capacity and quotas
- Identify data retention issues
- Detect unexpected data accumulation
Detecting Unusual Access Patterns
Sudden spikes in storage.googleapis.com/api/request_count or storage.googleapis.com/network/sent_bytes_count may indicate:
- Security incidents (unauthorized data exfiltration)
- Misconfigured applications generating excessive requests
- Batch jobs or backups running unexpectedly
- Public buckets being scraped or crawled
Correlate infrastructure metrics with Cloud Audit Logs to investigate suspicious activity.
Cost Optimization
Combine metrics to calculate cost drivers:
12345# Estimate API operation costs (Class A operations are more expensive)sum by (bucket_name) (rate({otel_metric_name="storage.googleapis.com/api/request_count",method=~"PUT|POST|PATCH"}[1d])) * 86400# Network egress cost estimation (egress is charged per GB)sum by (bucket_name) (rate({otel_metric_name="storage.googleapis.com/network/sent_bytes_count"}[1d])) * 86400 / 1e9
Use these insights to:
- Identify buckets with high API costs
- Reduce unnecessary operations
- Optimize data transfer patterns
- Implement caching or CDN strategies
Correlating with Application Telemetry
Cloud Storage metrics are more actionable when combined with application-level telemetry:
- Traces showing Cloud Storage operations from your applications
- Logs containing error messages and access patterns
- Custom metrics tracking application-specific storage operations
When investigating performance issues, pivot from infrastructure metrics to traces to understand:
- Which services are making storage requests
- How long operations take end-to-end
- What errors are occurring
- How storage access impacts user-facing latency
Instrument Cloud Storage operations in your application code with OpenTelemetry to emit traces with the cloud.provider, cloud.resource_id, and operation-specific attributes. Dash0 will correlate these with infrastructure metrics. See GCP Resources for attribute conventions.
Querying Cloud Storage Metrics
Metrics are stored using their GCP Cloud Monitoring metric type names and can be queried using otel_metric_name in PromQL.
Use PromQL in the Query Builder to create custom Cloud Storage dashboards:
1234567891011# Total API requests across all bucketssum(rate({otel_metric_name="storage.googleapis.com/api/request_count"}[5m]))# Network egress by bucketsum by (bucket_name) (rate({otel_metric_name="storage.googleapis.com/network/sent_bytes_count"}[1h]))# Storage utilization (current total size)sum by (bucket_name) ({otel_metric_name="storage.googleapis.com/storage/total_bytes"})# Average object size by bucket{otel_metric_name="storage.googleapis.com/storage/total_bytes"} / {otel_metric_name="storage.googleapis.com/storage/object_count"}
All Cloud Storage metrics include the following labels:
bucket_name— The Cloud Storage bucket nameproject_id— The GCP project IDmethod— API method (for request metrics:GET,PUT,POST,DELETE,LIST)
Alerting on Cloud Storage Metrics
Create check rules to detect storage issues:
- High API request rates: Alert when request volume exceeds normal patterns
- Excessive egress: Notify when network traffic suggests unusual data transfer
- Storage quota approaching: Warn when bucket size approaches defined limits
- Rapid growth: Alert on unexpected increases in storage consumption
- Unusual access patterns: Detect spikes in specific API operations that may indicate security issues
See Alerting for details on creating check rules with infrastructure metrics.
Best Practices
Follow these recommendations to optimize Cloud Storage monitoring and operations.
- Enable versioning for critical buckets: Track object count growth to understand versioning overhead
- Implement lifecycle policies: Automatically transition objects to Nearline/Coldline/Archive storage classes based on access patterns
- Monitor egress costs: Network transfer is a significant cost driver — use metrics to identify optimization opportunities
- Cache frequently accessed objects: Reduce API requests and egress by caching popular content
- Use signed URLs: Limit direct bucket access to reduce unauthorized request volume
- Correlate with audit logs: Infrastructure metrics show what happened, audit logs show who did it
Storage Class Considerations
Cloud Storage supports multiple storage classes (Standard, Nearline, Coldline, Archive) with different pricing for storage and operations. While Dash0 collects metrics at the bucket level, you can:
- Use separate buckets for different storage classes to track costs independently
- Compare
api_request_rateacross buckets to verify access patterns match storage class expectations - Monitor transition costs by tracking
total_byteschanges after lifecycle policy execution
Further Reading
- Monitor Cloud Run Services — Monitor Cloud Run services accessing Cloud Storage
- GCP Resources — Resource naming and equality rules
- Set Up Google Cloud Integration — Configure the GCP integration
- Google Cloud Monitoring Metrics — Full list of available Cloud Storage metrics
- Cloud Storage Pricing — Understand cost implications of operations and egress