
Last updated: October 11, 2026
About AWS Lambda Monitoring
Lambda functions can be instrumented either with the Dash0 Lambda Extension (via the UI auto-instrumentation flow or by adding the layer manually via the Dash0 Lambda Extension repository) or with generic OpenTelemetry instrumentation using the OpenTelemetry SDK directly in your function code.
The Dash0 Lambda Extension automatically captures traces, logs, and metrics from your AWS Lambda functions. It ships as a Lambda Layer and runs as a sidecar process alongside your function for Python, Node.js, and Java runtimes—no code changes, no SDK imports, no wrapper functions. Telemetry is emitted in pure OpenTelemetry format and follows OTel semantic conventions, so Lambda spans correlate naturally with the rest of your stack in Dash0.
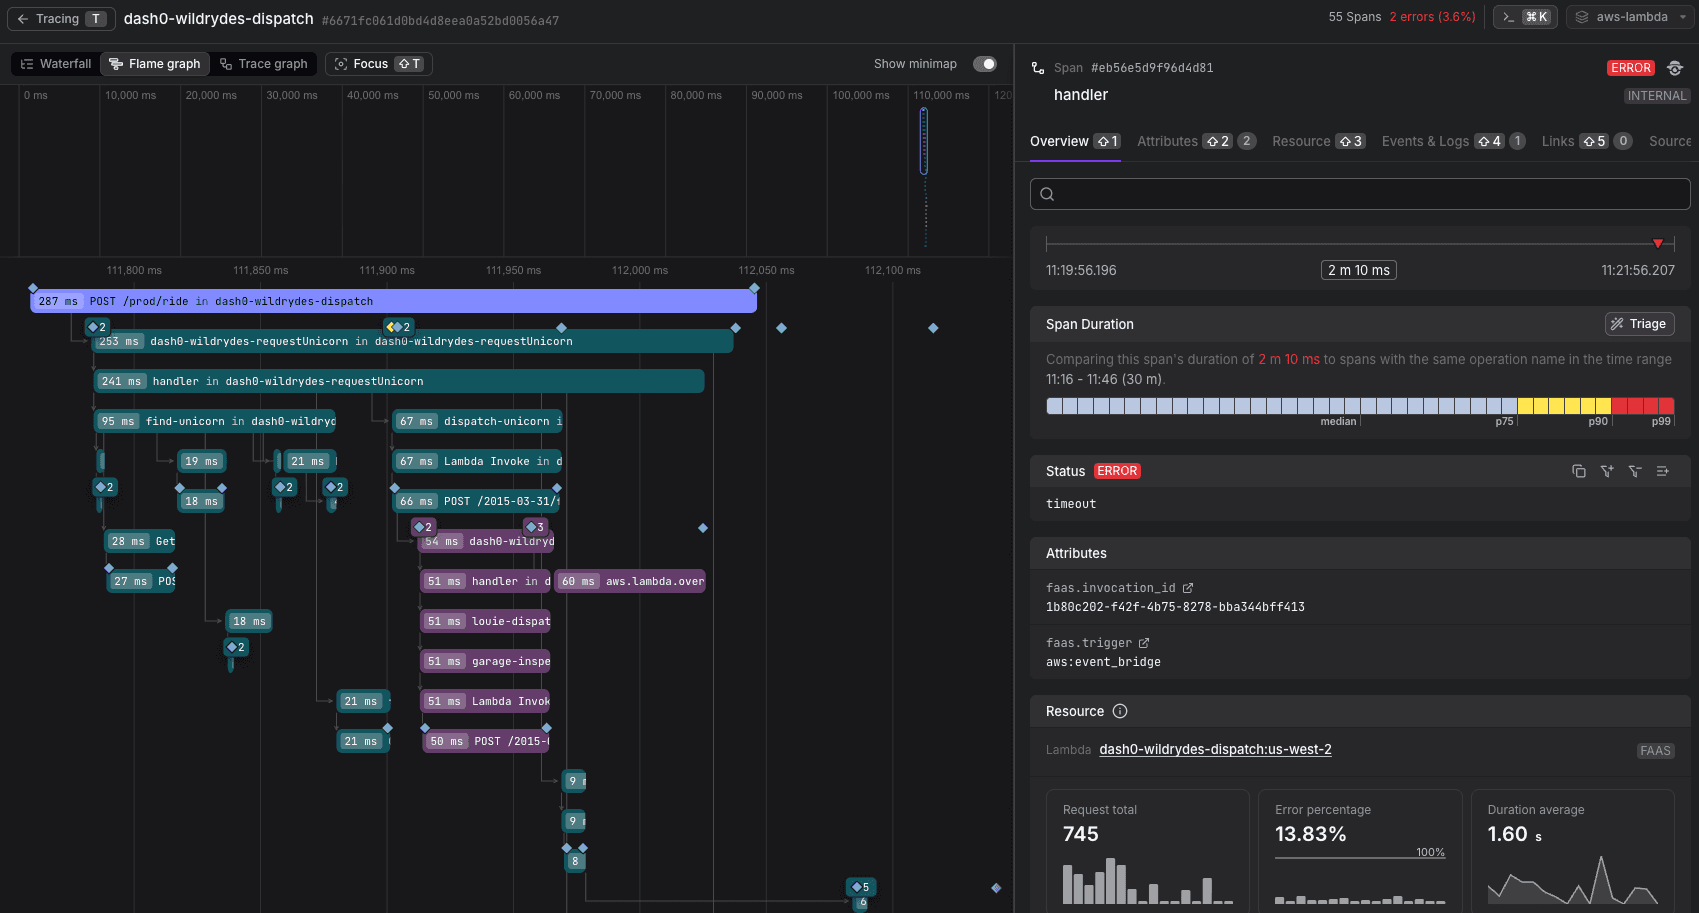
Key Capabilities
- Auto-instrumentation: No code changes needed to enable tracing for Python, Node.js, and Java.
- HTTP attributes on HTTP-triggered functions: Request method, matched route, client address, and response status code on the handler span for API Gateway REST and HTTP APIs and Lambda Function URLs, extracted by the extension for every supported runtime.
- Lambda context on every trace: Invocation ID, event source, cold start duration, batch record counts, and trigger ARNs for SQS, DynamoDB Streams, Kinesis, SNS, and EventBridge.
- Synthetic spans for timeouts and out-of-memory errors: Failures that standard OpenTelemetry can't capture because the function is killed before it can emit a trace.
- Log correlation: Automatic trace correlation through
faas.invocation_id. - Invocation metrics: Duration, cold start, billed duration, and memory used, generated per invocation.
- Secret masking: Configurable masking rules for sensitive values in payloads and HTTP bodies.
- Manual instrumentation path: For functions that already use the OpenTelemetry SDK.
- Serverless Framework plugin: The
serverless-dash0plugin automatically configures the Dash0 layer for functions marked withdash0-traced: true.
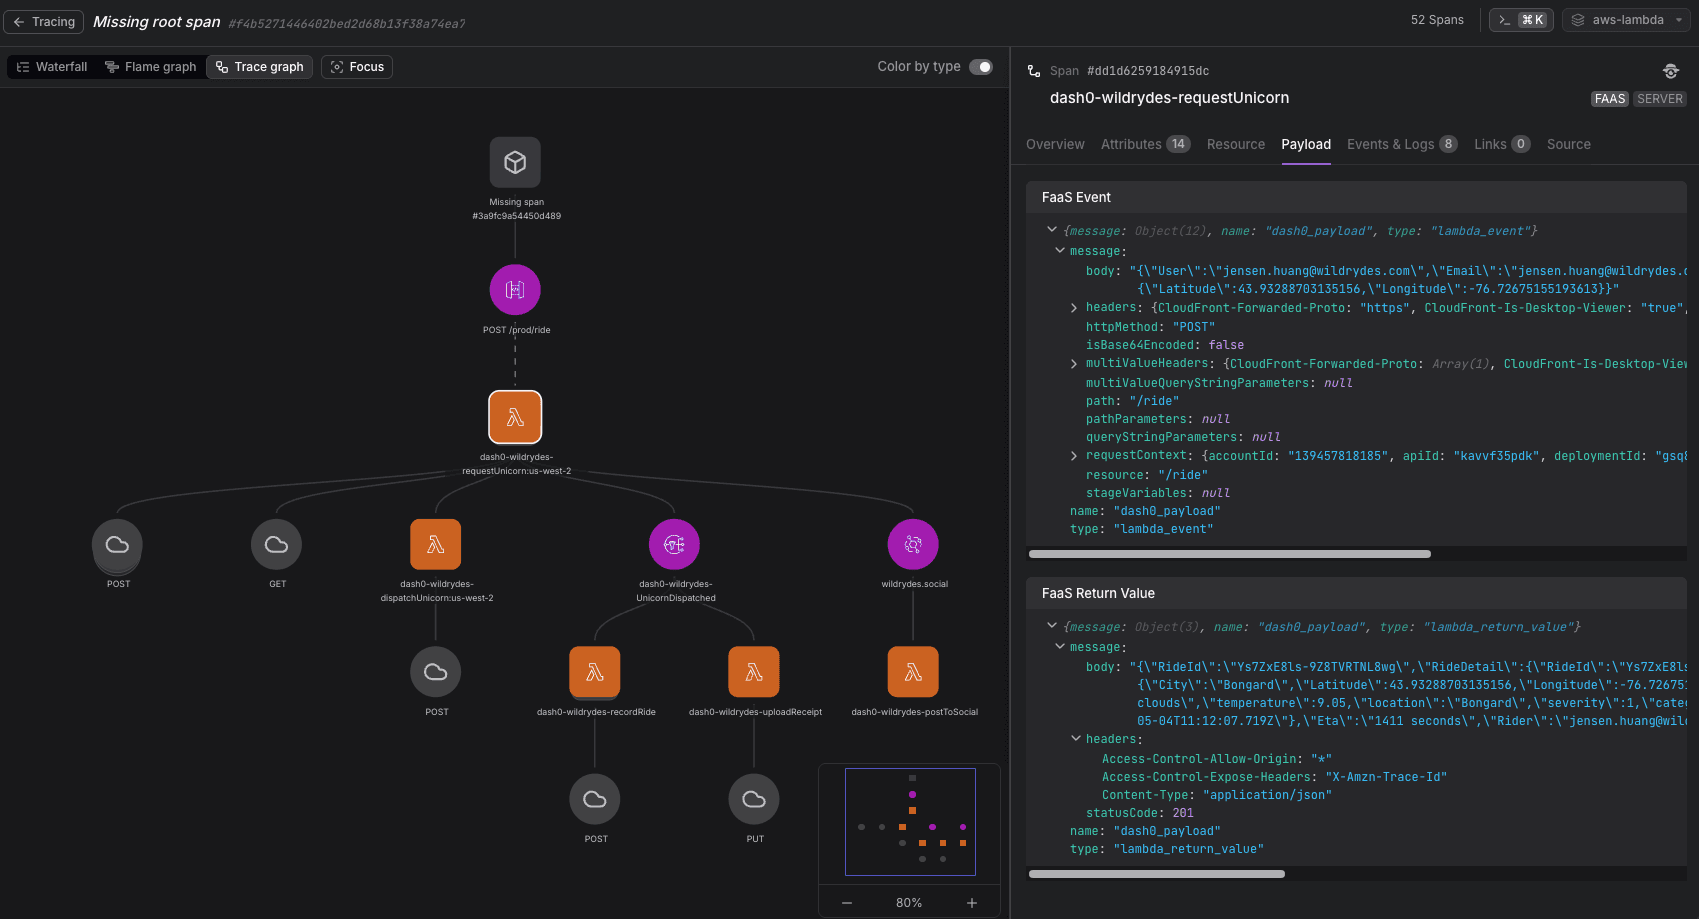
How It Works
The extension ships as a Lambda Layer that AWS mounts into your function's execution environment at /opt. It runs as a sidecar process with access to Lambda lifecycle events:
- Instruments your code at startup, before your handler runs.
- Captures lifecycle events your handler never sees, like timeout and out-of-memory terminations.
- Collects logs and forwards all telemetry to Dash0 via OTLP.
Because telemetry follows OpenTelemetry semantic conventions, it is portable. If you stop using Dash0, you can redirect the OTLP endpoint without re-instrumenting.
Supported Runtimes
Python, Node.js, and Java, on both x86_64 and arm64 (Graviton) architectures. All non-deprecated versions are supported. See the AWS page for current version support.
Next Steps
- Set Up AWS Lambda Auto Instrumentation — Add the layer and configure environment variables
- Trace Lambda Invocations — View traces in Dash0 with full Lambda context
- Debug Timeouts and Errors — Find failed invocations using synthetic traces
- Analyze Cold Starts — Measure and reduce cold start latency