
Last updated: October 9, 2026
Set Up AWS Lambda Auto Instrumentation
Lambda functions can be instrumented with the Dash0 Lambda Extension in two ways:
- UI auto-instrumentation flow (recommended): Select functions in the Dash0 UI and instrument them with one click. The UI validates compatibility, applies the layer, and configures environment variables automatically.
- Manual layer installation: Add the Dash0 Lambda Layer manually by following the Dash0 Lambda Extension repository README.
The prerequisites and steps below apply to the UI auto-instrumentation flow.
Prerequisites
Before instrumenting Lambda functions, ensure you have:
- AWS Integration Connected: The AWS account containing your Lambda functions must be connected to Dash0. See Set Up AWS Integration for instructions.
- IAM Permissions: The AWS integration must include the Resources Instrumentation role, which grants permissions to modify Lambda function configurations.
- Lambda Functions Discovered: Dash0 must have discovered your Lambda functions through AWS Resource Explorer. This happens automatically after the AWS integration is verified.
- Admin Access: Instrumentation requires organization admin permissions in Dash0.
Supported Lambda Configurations
The Dash0 Lambda Extension supports:
- Runtimes: Python, Node.js, Java
- Architectures: x86_64 and arm64 (Graviton)
- Package Type: ZIP only (container-based Lambda functions with PackageType Image are not supported via UI flow)
- Layer Slots: Functions must have fewer than 5 layers attached (AWS limit is 5; Dash0 needs 1 slot)
- Deployment Package Size: Must be under 250 MB (including the dash0 layer)
Step 1: Navigate to the Instrument View
- In the Dash0 UI, navigate to Infrastructure > AWS > Lambda.
- Click the Instrument button in the toggle group to switch from "View functions" mode to instrumentation mode.
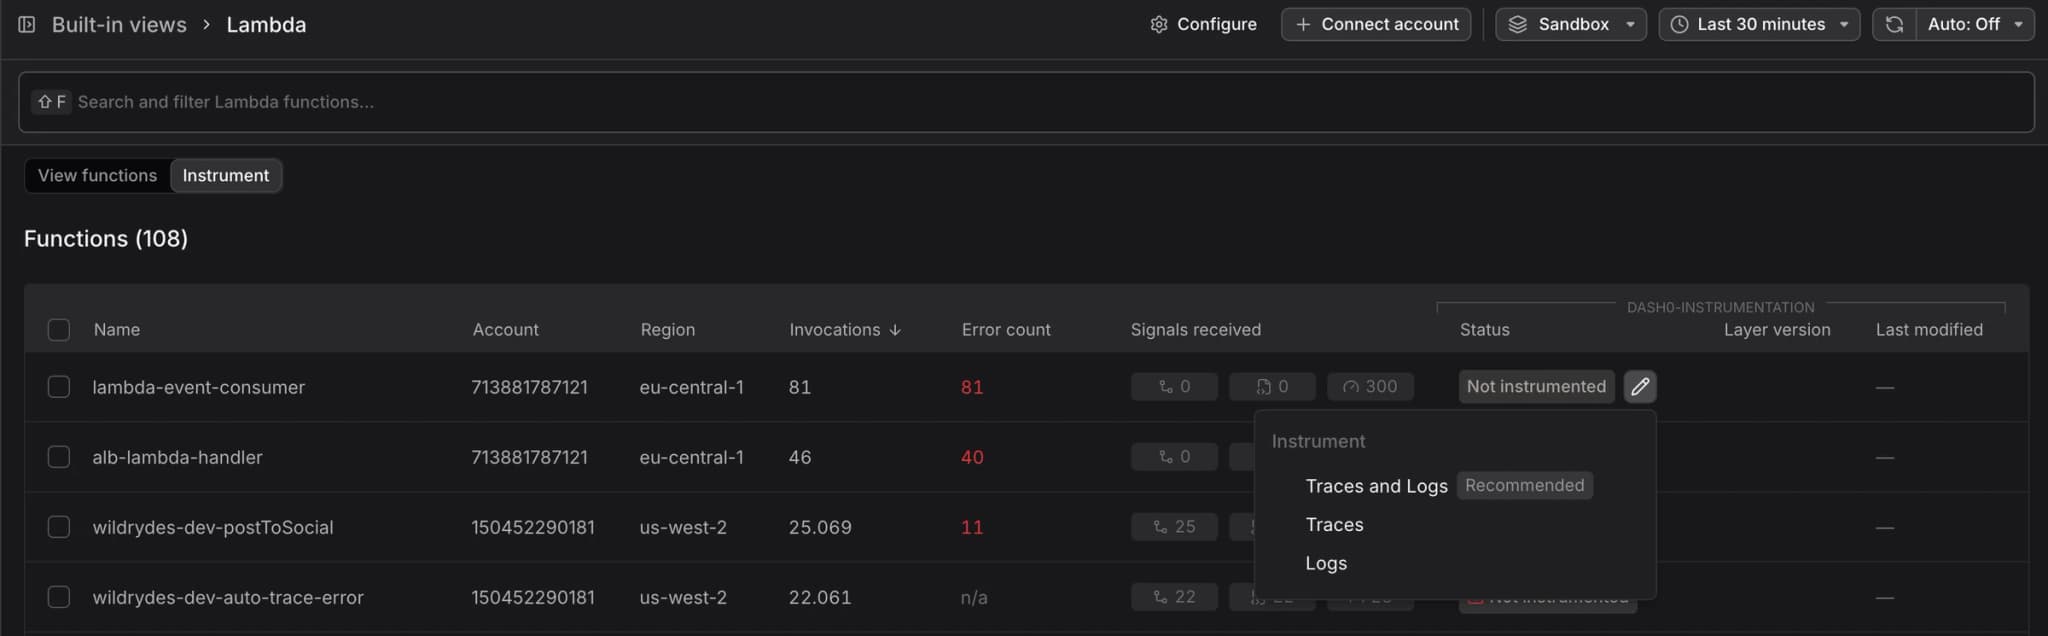
The Instrument view displays all discovered Lambda functions with their current instrumentation status:
- Not instrumented: Function is eligible for instrumentation.
- Instrumented: Dash0 Lambda Extension is configured on this function.
- Pending: Instrumentation is in progress.
- Unsupported: Function cannot be instrumented (see blockers below).
Step 2: Select Functions to Instrument
Browse the Lambda functions table and select the functions you want to instrument:
- Use the checkboxes in the leftmost column to select individual functions.
- Filter by region, account, or name using the search and filter controls above the table.
- Sort by status to group instrumented and uninstrumented functions together.
You can select multiple functions across different accounts and regions. Dash0 will instrument them in parallel.
Step 3: Choose Collection Options
When you select functions and click Instrument, you'll be prompted to choose what telemetry to collect:
- Traces and Logs (Recommended): Captures distributed traces, structured logs, and metrics. Enables full observability for your Lambda functions.
- Traces Only: Collects distributed traces and metrics without logs.
- Logs Only: Collects logs and metrics without distributed tracing. Use this if you only need log forwarding.
Traces and Logs mode sets AWS_LAMBDA_EXEC_WRAPPER=/opt/wrapper to enable OpenTelemetry auto-instrumentation. Logs Only mode omits the wrapper and collects logs via the Dash0 Lambda Extension binary in /opt/extensions/.
Step 4: Confirm and Apply Instrumentation
After selecting functions and collection options, Dash0 validates the function configuration and, if applicable, attaches the layer and sets up the environment variables.
Blockers and Warnings
Dash0 detects blockers that prevent instrumentation:
- Code Signing Enabled: Functions with code signing cannot be instrumented via layers. Resolution: Disable code signing on the function, or instrument manually using the OpenTelemetry SDK.
- Container-Based Function: PackageType Image is not supported. Resolution: Only ZIP-based Lambda functions can be instrumented via layers. For container-based functions, you need to copy the extension and SDK into the Docker image. See the steps in the GitHub repository README.
- Unsupported Runtime: Runtime is not in the supported list. Resolution: Upgrade to an LTS-supported runtime.
- Layer Limit Exceeded: Function already has 5 layers attached. Resolution: Remove unnecessary layers from the function in AWS Console or CLI.
- Deployment Package Too Large: Function package exceeds 250 MB. Resolution: Reduce deployment package size or split function logic.
- VPC Configuration Invalid: VPC subnets or security groups are misconfigured (validated for VPC-attached functions). Resolution: Fix VPC configuration in AWS Console.
- Conflicting Vendor Layers: Layers from Datadog, New Relic, Dynatrace, Lumigo, ADOT, or OpenTelemetry Lambda are detected. Resolution: Remove the conflicting layer manually in AWS before instrumenting with Dash0.
- Insufficient IAM Permissions: The AWS integration role is missing a permission required to modify the function's configuration. Resolution: Verify the role meets the IAM Permissions requirement under Prerequisites.
If a blocker is present, the function will be skipped during instrumentation. You can fix the blocker and retry later.
Dash0 applies the following changes during instrumentation:
- Validates Prerequisites: Checks runtime, architecture, layer count, package size, and code signing.
- Creates Changeset: Determines which layers to remove, which to add, and which environment variables to set.
- Applies Changeset: Calls Lambda UpdateFunctionConfiguration API with the new configuration. Uses optimistic locking (RevisionId) to prevent concurrent modification conflicts.
- Verifies Instrumentation: Polls Lambda API until the update completes and verifies the configuration.
Each instrumentation operation takes 10-30 seconds depending on AWS API response times. If a function update fails due to concurrent modification, Dash0 will retry automatically.
Step 5: Verify Telemetry
After instrumentation completes, telemetry will appear in Dash0 the next time your function is invoked.
Navigate to Infrastructure > AWS > Lambda in View functions mode to see CloudWatch metrics (invocations, errors, duration, cold starts). The Lambda functions page shows:
- All discovered functions with CloudWatch metrics
- Clicking a function opens the function detail page with invocation history
- Clicking an invocation shows individual invocation details and links to the full trace
For distributed traces, see Trace Lambda Invocations.
If no data appears after the function is invoked, check the Troubleshooting section below.
Instrumentation Status Details
The Dash0 Lambda Extension instrumentation configures your Lambda function with:
Lambda Layer:
- ARN format:
arn:aws:lambda:{region}:115813213817:layer:dash0-extension-{type}:{version} - Supported
{type}values:node,python,java,manual - Published from Dash0 AWS accounts: 115813213817 (prod)
- For the latest version, refer to the Dash0 Lambda Extension releases page.
Environment Variables:
DASH0_ENDPOINT: OTLP HTTP endpoint (e.g.,https://ingress.eu-west-1.aws.dash0.com:4318)DASH0_TOKEN: Organization authentication tokenDASH0_DATASET: Dataset slug for telemetry routingAWS_LAMBDA_EXEC_WRAPPER=/opt/wrapper: Enables OpenTelemetry auto-instrumentation (Traces and Logs mode only)
Tracing Configuration:
- X-Ray tracing mode set to
PassThroughto avoid conflicts with OpenTelemetry
Conflict Detection
Dash0 detects conflicting vendor layers from:
- Datadog
- New Relic
- Dynatrace
- Lumigo
- AWS Distro for OpenTelemetry (ADOT)
- OpenTelemetry Lambda
If a conflicting vendor layer is detected, Dash0 instrumentation will be skipped for that function. Remove the conflicting layer manually in AWS before retrying.
Removing Instrumentation
To remove Dash0 instrumentation from Lambda functions:
- Navigate to Infrastructure > AWS > Lambda and switch to Instrument mode.
- Select the instrumented functions you want to uninstrument.
- Click the Actions dropdown and select Remove Instrumentation.
- Confirm the action in the dialog.
Dash0 will:
- Remove the Dash0 Lambda Layer from the function.
- Remove Dash0 environment variables (
DASH0_ENDPOINT,DASH0_TOKEN,DASH0_DATASET,AWS_LAMBDA_EXEC_WRAPPER).
User-defined layers and environment variables are preserved during uninstrumentation. Only Dash0-specific configuration is removed.
Troubleshooting
Functions not appearing in the Instrument view:
- Verify the AWS integration is active and the IAM roles can be assumed.
- Check that AWS Resource Explorer is enabled and has indexed Lambda resources in your account.
- Ensure the regions containing your functions are selected in the AWS integration settings.
- Wait 2-5 minutes for the initial discovery crawl to complete after connecting the AWS account.
Instrumentation fails with "Precondition failed":
- Another process (AWS console, CLI, or automation) modified the function configuration concurrently.
- Wait a few seconds and retry instrumentation.
- Avoid making manual changes to Lambda functions while instrumentation is in progress.
Function shows "Blocked: Code signing enabled":
- Lambda functions with code signing enabled cannot be instrumented via layers.
- Options: Disable code signing on the function, or instrument manually using the OpenTelemetry SDK in your function code.
Function shows "Blocked: Layer limit exceeded":
- Function already has 5 layers attached (AWS maximum).
- Remove unnecessary layers from the function in the AWS console or CLI, then retry instrumentation.
No telemetry data appears after instrumentation:
- Verify the function has been invoked at least once after instrumentation.
- Check the function's CloudWatch Logs for Dash0 extension output:
- Look for
[dash0-extension]log entries indicating successful initialization. - Check for errors related to
DASH0_ENDPOINTorDASH0_TOKEN.
- Look for
- Verify the dataset selected during AWS integration setup is accessible and has correct permissions.
- Confirm the Dash0 ingress endpoint is reachable from the Lambda execution environment (check VPC configuration if the function is VPC-attached).
Extension errors in CloudWatch Logs:
- "401 Unauthorized":
DASH0_TOKENis invalid or expired. Verify the AWS integration is active and tokens are current. - "Connection refused" or "Timeout": Network connectivity issue. Check VPC security groups, NACLs, and route tables if the function is VPC-attached.
- "Extension.InitError": Extension failed to initialize. Check CloudWatch Logs for detailed error messages. Common causes: incorrect Lambda Layer ARN, architecture mismatch, or insufficient permissions.
High cold start duration after instrumentation:
- The Dash0 Lambda Extension adds minimal overhead (typically <100ms) to cold start initialization. However, the OpenTelemetry SDK can add additional overhead depending on language and code size.
- If cold starts are significantly higher, check:
- Is your function code bundled or not. Smaller bundle sizes are better.
- Strip unnecessary dependencies.
- Layer count (each layer adds initialization time; remove unnecessary layers).
- If timeouts occur at cold start:
- Increase the function timeout, as the additional init time can make your function more likely to hit timeouts.
Next Steps
- Trace Lambda Invocations — View traces in Dash0 with full Lambda context
- Debug Timeouts and Errors — Find failed invocations using synthetic traces
- Analyze Cold Starts — Measure and reduce cold start latency
- About AWS Lambda Monitoring — Learn more about Lambda monitoring capabilities