
Last updated: October 9, 2026
About AWS Monitoring
Dash0 integrates with your Amazon Web Services account to provide immediate visibility into your AWS infrastructure. Once connected, you get metrics out of the box and can see all your Lambda functions.
The AWS integration uses CloudFormation to deploy IAM roles with cross-account access. After setup completes (about 2-3 minutes), Dash0 automatically:
- Discovers all Lambda functions across your selected AWS regions using AWS Resource Explorer
- Streams CloudWatch metrics for Lambda invocations, errors, duration, and cold starts
- Enables optional auto-instrumentation to add distributed tracing and logs to specific functions
Connect your AWS account via a read-only cross-account role—no AWS credentials are stored by Dash0.
Use Cases
- Discover and instrument Lambda functions: One-click auto-instrumentation for Python, Node.js, and Java functions to capture traces, logs, and metrics.
- Collect CloudWatch metrics: Stream Lambda invocation metrics, errors, duration, and cold starts to Dash0.
Supported Services
The AWS account integration provides:
- AWS Lambda: Auto-instrumentation for Python, Node.js, and Java functions. Captures traces, logs, and metrics including cold starts, timeouts, and out-of-memory errors.
- CloudWatch Metrics: Streams Lambda function metrics (invocations, errors, duration, cold starts) from CloudWatch to Dash0.
Container-based Lambda functions (PackageType Image) are not currently supported for auto-instrumentation. Only ZIP-based Lambda functions can be instrumented.
How It Works
The Dash0 AWS integration operates through CloudFormation-managed infrastructure:
-
Authentication: Dash0 connects to your AWS account using cross-account IAM role assumption via STS. No AWS credentials are stored by Dash0. The External ID provided in the CloudFormation template ensures secure, auditable access. All API calls include session names formatted as
dash0-{orgID}-{integrationID}for CloudTrail tracking. -
Discovery and Inventory: For Lambda functions, Dash0 uses AWS Resource Explorer to discover functions across all regions. EventBridge rules forward CloudTrail lifecycle events (CreateFunction, DeleteFunction, UpdateFunctionConfiguration) to keep the inventory synchronized automatically.
-
Data Collection: Once configured, metrics flow automatically from CloudWatch into Dash0, and Lambda functions send traces, logs, and metrics via OpenTelemetry. All telemetry follows OTel semantic conventions and correlates naturally with your application data in Dash0.
-
Lambda Instrumentation: When you select Lambda functions to instrument through the Dash0 UI, the system injects a Dash0 Lambda Layer and configures environment variables via the Lambda UpdateFunctionConfiguration API. The layer includes OpenTelemetry auto-instrumentation that runs as a sidecar alongside your function code. Dash0 validates configurations before instrumentation to detect blockers such as code signing, conflicting vendor layers, or unsupported runtimes.
Getting Started
To start monitoring AWS infrastructure in Dash0:
- Select your dataset to store discovered AWS resources and metrics.
- Choose AWS regions where Dash0 should collect metrics. Only metrics from selected regions will be streamed to your dataset.
- Launch the CloudFormation template by clicking the button in the Dash0 UI, which opens AWS CloudFormation with the pre-filled template. This deploys IAM roles, permissions, and resources for data collection. Review the stack parameters and confirm deployment.
- Return to Dash0 after the CloudFormation stack completes (about 2-3 minutes) to verify the integration.
For all the details, see Set Up AWS Integration.
Once verified, discovered resources and telemetry will appear in the Infrastructure section of the navigation sidebar under AWS.
Viewing AWS Data
Navigate to Infrastructure > AWS in the Dash0 sidebar to see discovered Lambda functions.
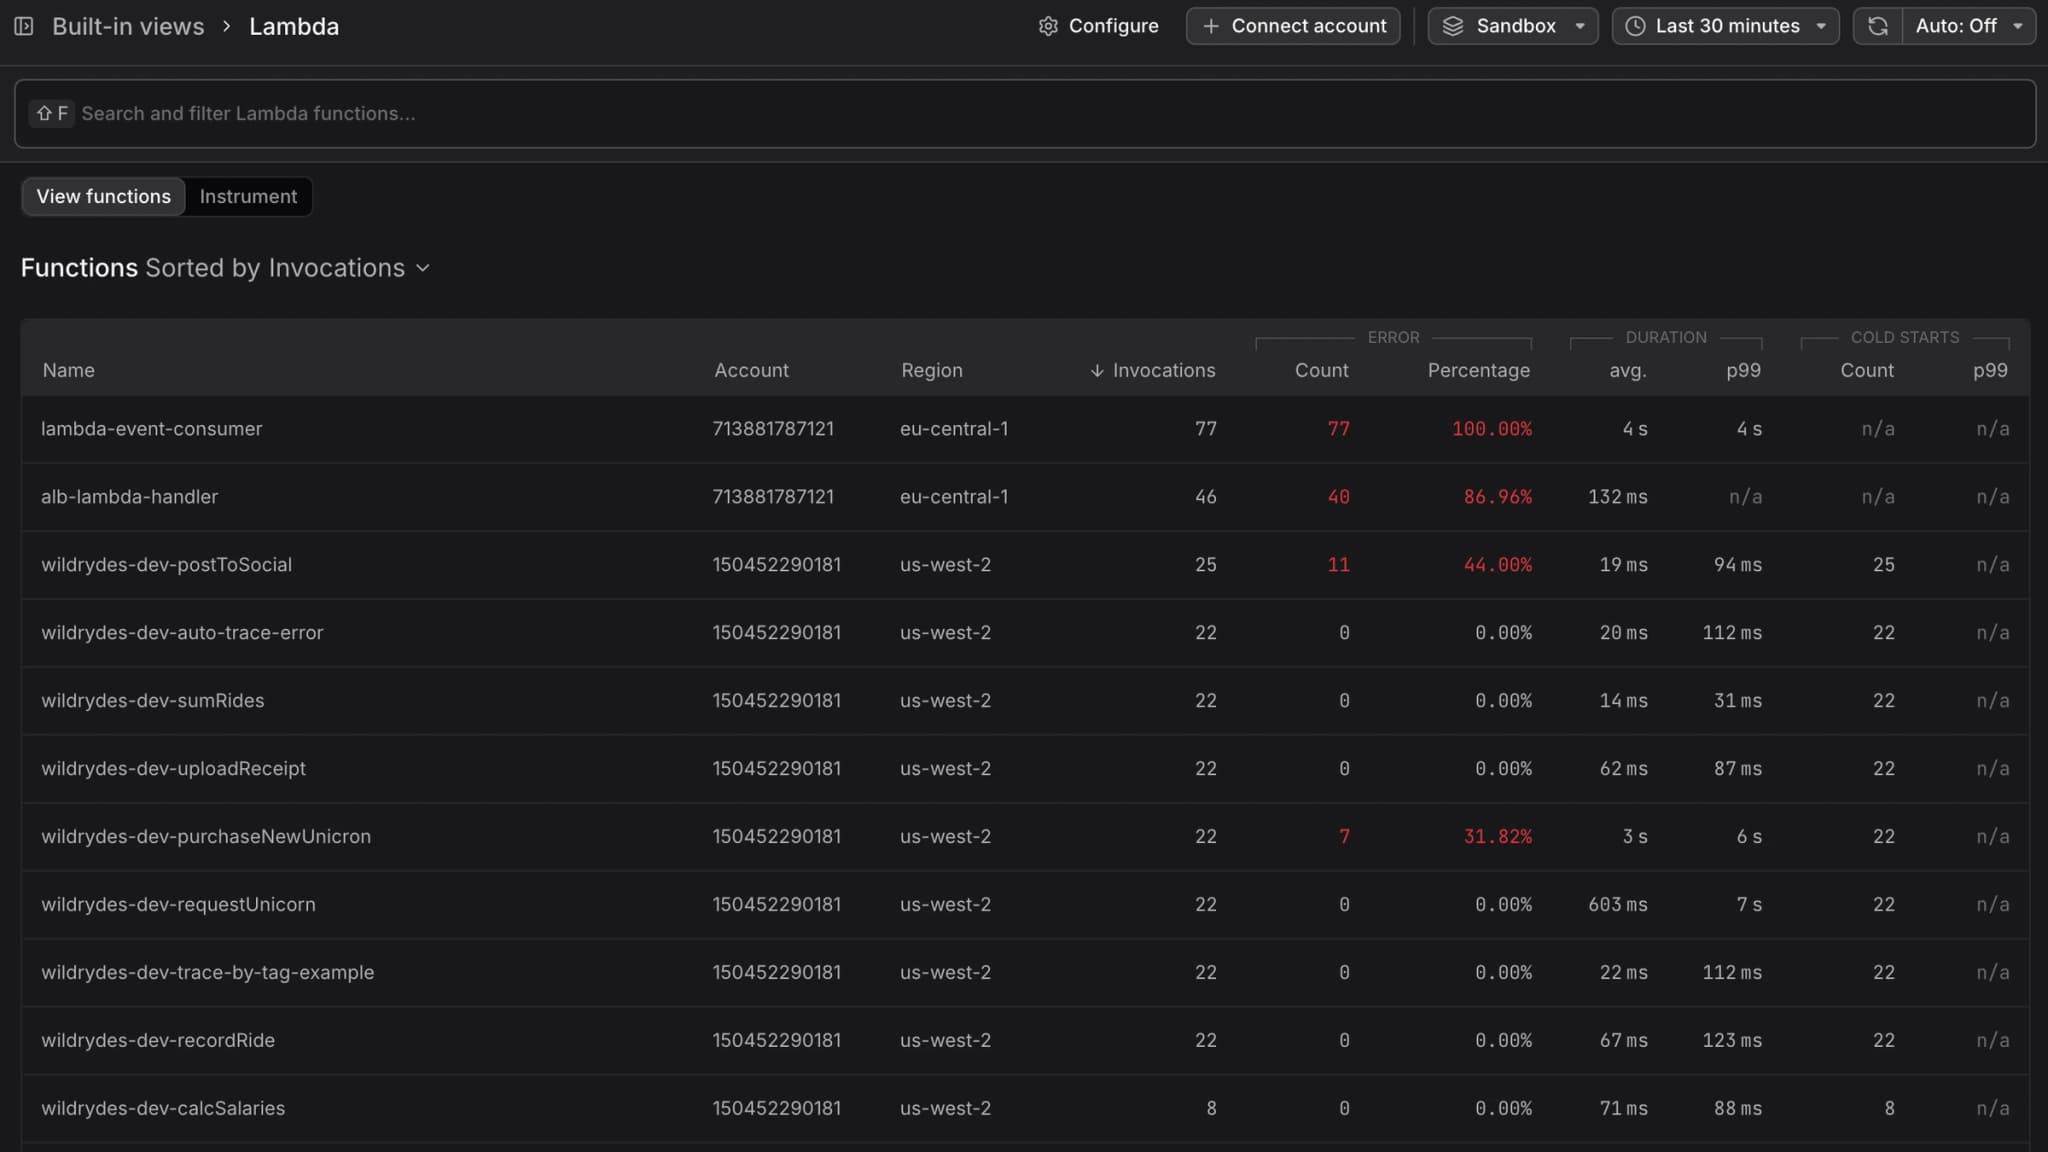
The Lambda functions page shows:
- All discovered Lambda functions with CloudWatch metrics out of the box
- Metrics include invocations, errors, duration, and cold starts
- Individual function pages with invocation details and links to distributed traces
For details on viewing Lambda traces and instrumentation, see:
You can also query AWS infrastructure metrics using PromQL in the Query Builder or create custom dashboards combining infrastructure and application metrics.
Related Integrations
The AWS integration works alongside other AWS-specific integrations available in Dash0:
- AWS EKS with AWS Fargate: Dedicated integration for Fargate log forwarding.
- AWS CloudWatch Logs: Stream logs directly from CloudWatch.
- AWS CloudWatch Metrics: Forward metrics via Metric Streams.
- Amazon CloudWatch Transaction Search (X-Ray): Integrate distributed traces from X-Ray.
- AWS PrivateLink: Establish private connectivity for secure data transmission.
Next Steps
- Set Up AWS Integration — Deploy the CloudFormation template and configure IAM roles
- About AWS Lambda Monitoring — Learn about Lambda auto-instrumentation capabilities
- Set Up AWS Lambda Auto Instrumentation — Instrument Lambda functions via the Dash0 UI
- Trace Lambda Invocations — View traces with full Lambda context
- Debug Timeouts and Errors — Find failed invocations using synthetic traces
- Analyze Cold Starts — Measure and reduce cold start latency