
Last updated: October 12, 2026
Debug Timeouts and Errors
When a Lambda function times out or runs out of memory, AWS kills it before your handler can emit a trace. The standard OpenTelemetry SDK cannot capture these failures because no user code is running to create spans.
The Dash0 Lambda Extension listens to AWS lifecycle events and automatically creates synthetic traces for these failures.
Prerequisites
The extension must be attached to your function. See Set Up AWS Lambda Auto Instrumentation for installation instructions.
Timeout Traces
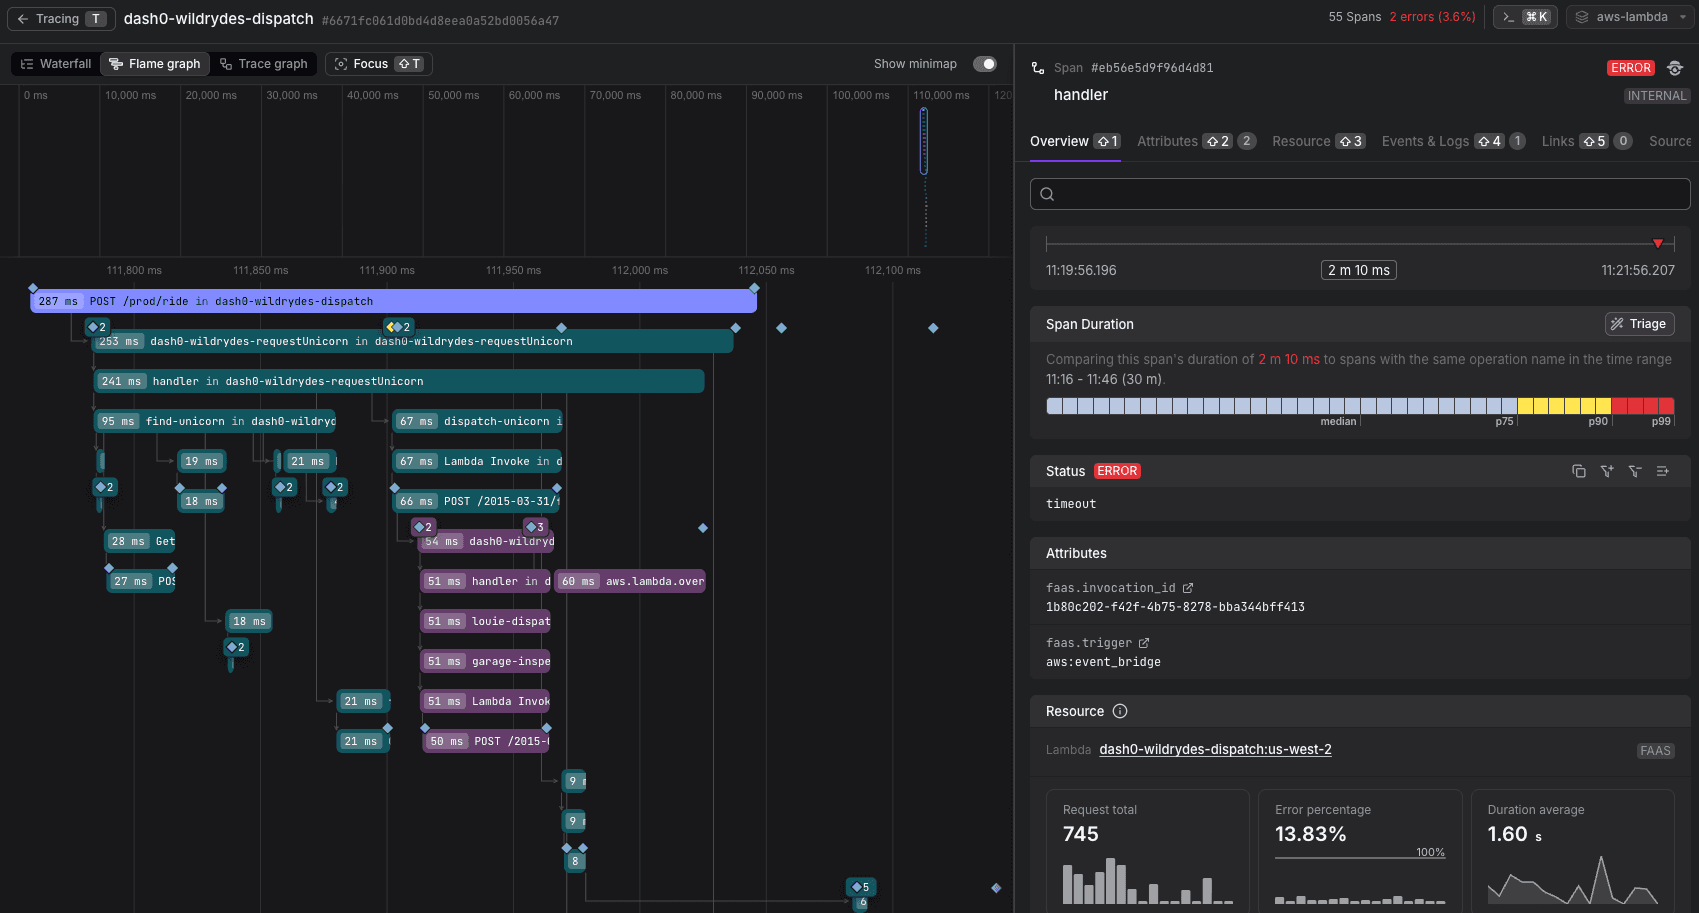
When a function exceeds its configured timeout, the extension creates a trace showing:
- The invocation duration up to the point of termination.
- The event source that triggered the invocation.
- The invocation ID for correlation with CloudWatch logs.
- A span status of
ERRORwith the reason set totimeout.
Out-of-Memory Traces
Out-of-memory errors produce the same synthetic trace structure, with the error reason set to out_of_memory.
The trace includes the memory used at termination.
How to Find Failed Invocations
In the Dash0 Traces view, filter by:
otel.span.status.code = ERROR: Surface all failed invocations.faas.trigger: Narrow by event source.service.nameorcloud.resource_id: Target a specific function.
You can create a Dash0 check rule with these filters to alert when failure rates exceed a threshold.