
Last updated: October 9, 2026
Analyze Cold Starts
A cold start occurs when AWS initializes a new execution environment for your function. The initialization phase runs before your handler and adds latency that users experience, but standard invocation metrics do not capture it separately.
The Dash0 Lambda Extension sets boolean value faas.coldstart on every invocation and captures cold start duration as both a span attribute and a standalone histogram metric.
Prerequisites
Cold start analysis requires the Dash0 Lambda Extension to be attached to your function. See Set Up AWS Lambda Auto Instrumentation for installation instructions.
Finding Cold Starts in Traces
Filter by faas.coldstart = true in the Dash0 Traces view to surface all cold start invocations.
Each matching trace includes a faas.init_duration attribute on the root span with the initialization time in milliseconds, separate from the handler duration. This shows exactly how much of the total invocation time was initialization versus execution.
Cold Start Metrics in Dashboards
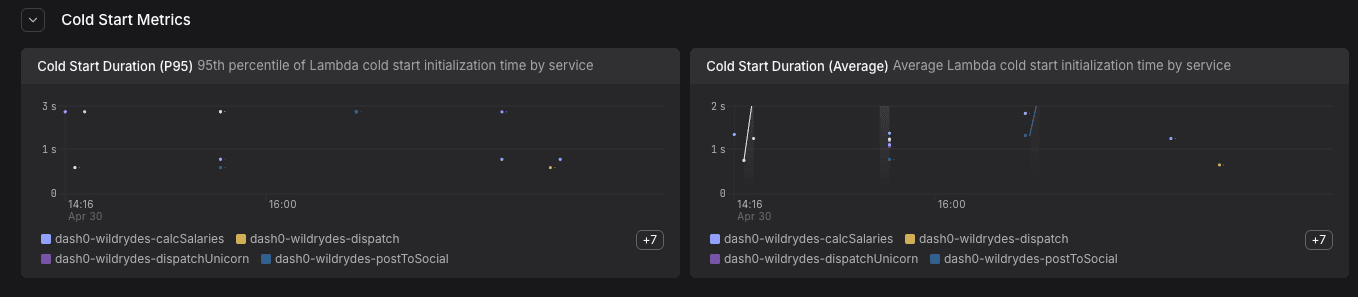
The extension generates a faas.init_duration histogram metric on every cold start. Use this metric in Dash0 dashboards to:
- Track cold start frequency and duration over time.
- Compare cold start rates across runtimes (Python, Node.js, Java) and memory configurations.
- Correlate cold start spikes with deployment events or traffic increases.
Reducing Cold Starts
Common approaches to reduce cold starts based on what the data reveals:
- Provisioned Concurrency: Pre-initializes execution environments and eliminates cold starts up to the provisioned count.
- Runtime choice: Python and Node.js typically have shorter cold start times than Java for equivalent function complexity.
The faas.init_duration metric provides the baseline to measure the impact of any change.