
Last updated: October 11, 2026
Trace Lambda Invocations
The Dash0 Lambda Extension automatically captures distributed traces for every Lambda invocation—no code changes required for Python, Node.js, and Java functions.
Prerequisites
The extension must be attached to your function. See Set Up AWS Lambda Auto Instrumentation for installation instructions.
What You See in Dash0
Each invocation produces a trace containing:
- An entry span for the Lambda function, tagged with invocation ID, event source, and cold start duration.
- HTTP attributes on the handler span for functions invoked over HTTP, including the request method, matched route, and response status code.
- Child spans for outbound calls (HTTP requests, DynamoDB, SQS, SNS, EventBridge).
- Spans from downstream Lambda functions if they are also instrumented.
- Event payload (raw event input and return value visible in the Payload tab).
- Correlated logs accessible from the same trace view.
HTTP Attributes on HTTP-Triggered Functions
For functions invoked over HTTP, the extension reads the raw invocation and response payloads and sets OpenTelemetry HTTP semantic convention attributes on the handler span. The extension parses both payloads itself, so these attributes do not depend on the function's runtime or on an in-function OpenTelemetry SDK. They are set for every supported runtime.
Supported Triggers
- API Gateway REST API (v1): Proxy integrations.
- API Gateway HTTP API (v2): Proxy integrations.
- Lambda Function URLs: Recognized through the same payload format as HTTP API (v2).
Attributes
The extension sets the following attributes on the handler span:
http.request.method: The HTTP method of the request.url.path: The path component of the request target.url.scheme: The URI scheme of the request.http.route: The route template the request matched.server.address: The host that served the request.server.port: The port that served the request.client.address: The address of the calling client.network.protocol.version: The HTTP version of the request.http.response.status_code: The status code the function returned.
Response attributes are set only when the invocation's request was an HTTP event. A function triggered by SQS or EventBridge that happens to return a statusCode field does not receive them.
Because these are standard span attributes, you can use them in synthetic metrics to chart request rate, error rate, and duration per route without defining any metrics upfront.
HTTP attribute extraction requires Dash0 Lambda Extension version 23 or higher.
Optional Capture
The following settings are off by default, because each one either changes span names or can expose sensitive values. Set them as environment variables on your function:
DASH0_ENABLE_API_GATEWAY_SPAN_NAME: Renames the handler span to<method> <route>, for exampleGET /pets/{id}. Off by default so existing span names do not change.DASH0_API_GATEWAY_REQUEST_HEADERS_TO_CAPTURE: Comma-separated, case-insensitive list of request header names to capture ashttp.request.header.<name>. Empty by default, because headers can carry PII, authentication tokens, and cookies.DASH0_API_GATEWAY_RESPONSE_HEADERS_TO_CAPTURE: The same as above for response headers, captured ashttp.response.header.<name>.DASH0_CAPTURE_API_GATEWAY_QUERY_STRING: Captures the request query string asurl.query. Off by default, because query strings can carry signed-URL tokens and other sensitive values.
Navigating to Invocation Details
To view an individual invocation and its trace:
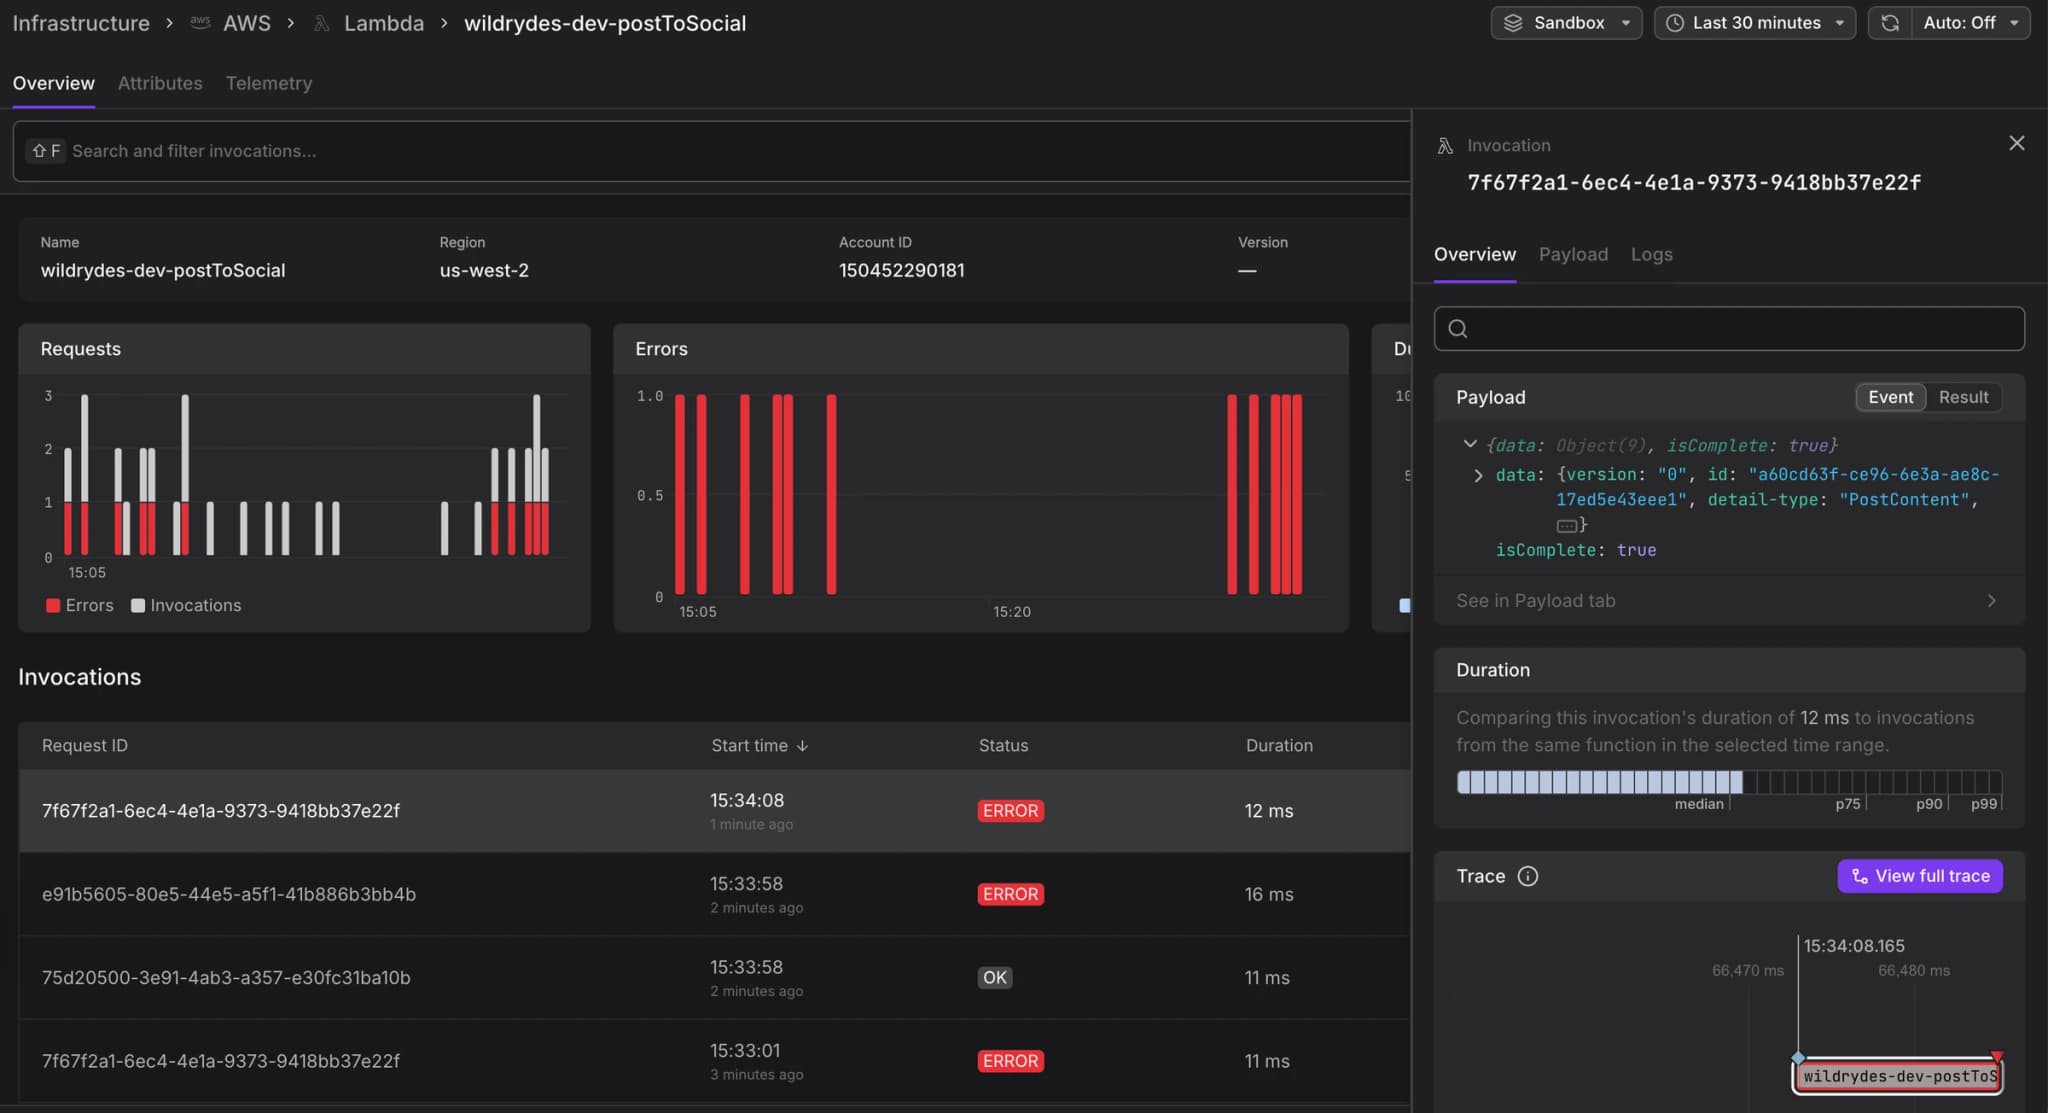
- Navigate to Infrastructure > AWS > Lambda and click on a function name.
- The function detail page shows metrics charts and an invocations table.
- Click on any invocation row to open the invocation detail panel.
- The panel displays the payload, duration comparison, and a link to View full trace.
To narrow the table, use the Search and filter invocations box above it, or press SHIFT+F to focus it. Typing an attribute key suggests matching keys along with their observed values and the number of matching spans, so you can filter by http.route, http.request.method, or http.response.status_code on the function page itself without moving to the Trace Explorer.
Viewing the Event Payload
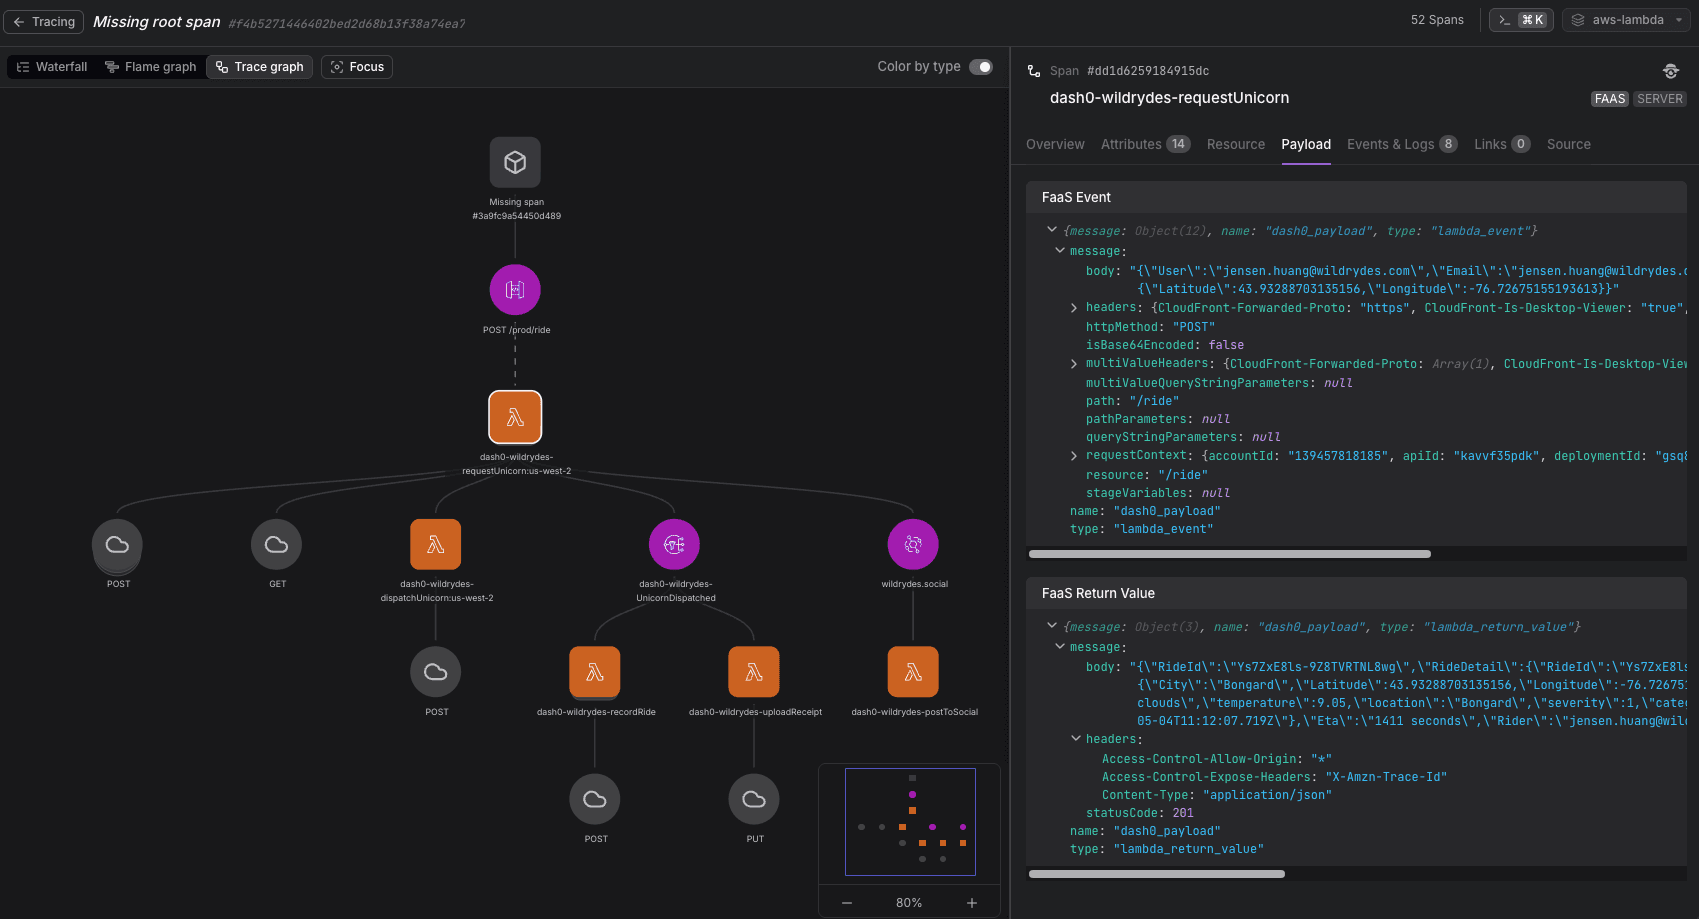
Select any Lambda span and open the Payload tab to view the raw Lambda event and the function's return value as structured log records.
Sensitive values are automatically masked before leaving the function. Default patterns cover passwords, API keys, secrets, and credentials. For documentation on how to configure additional masking rules beyond the defaults, see the Dash0 Lambda Extension repository README.
Connecting Traces Across Brokers
Standard OpenTelemetry loses trace context when a Lambda function is triggered via SQS, SNS, or EventBridge because these brokers do not propagate trace headers by default.
The extension reconstructs the connection by enriching spans with the event source ARN and batch record counts, so you can follow the full chain from producer to consumer in Dash0.
Filtering and Searching Traces
Use standard Dash0 trace filters to find Lambda invocations, for example:
faas.invocation_id: The AWS request ID for a specific invocation.faas.trigger: The event source type (e.g.,aws:sqs,aws:event_bridge).service.name: Set via theOTEL_SERVICE_NAMEenvironment variable on your function.cloud.resource_id: The full Lambda function ARN.http.route: The route template matched by an HTTP-triggered invocation.http.response.status_code: The status code returned by an HTTP-triggered invocation.