
Last updated: October 1, 2026
Create Dashboards
Agent0 generates dashboards from natural language descriptions. Describe what you want to visualize, and Agent0 creates the dashboard with panels, queries, and visualizations based on your actual telemetry.
How It Works
Agent0 analyzes your natural language description and automatically:
- Generates valid PromQL queries based on your telemetry
- Selects appropriate visualization types (time series, pie chart, gauge, etc.)
- Configures panel layouts and groupings
- Sets meaningful panel titles and descriptions
- Validates that the underlying queries return real data before creating the dashboard
No broken panels are emitted — if a query doesn't resolve, Agent0 reports the failure rather than creating a non-functional dashboard.
Start with Your Context
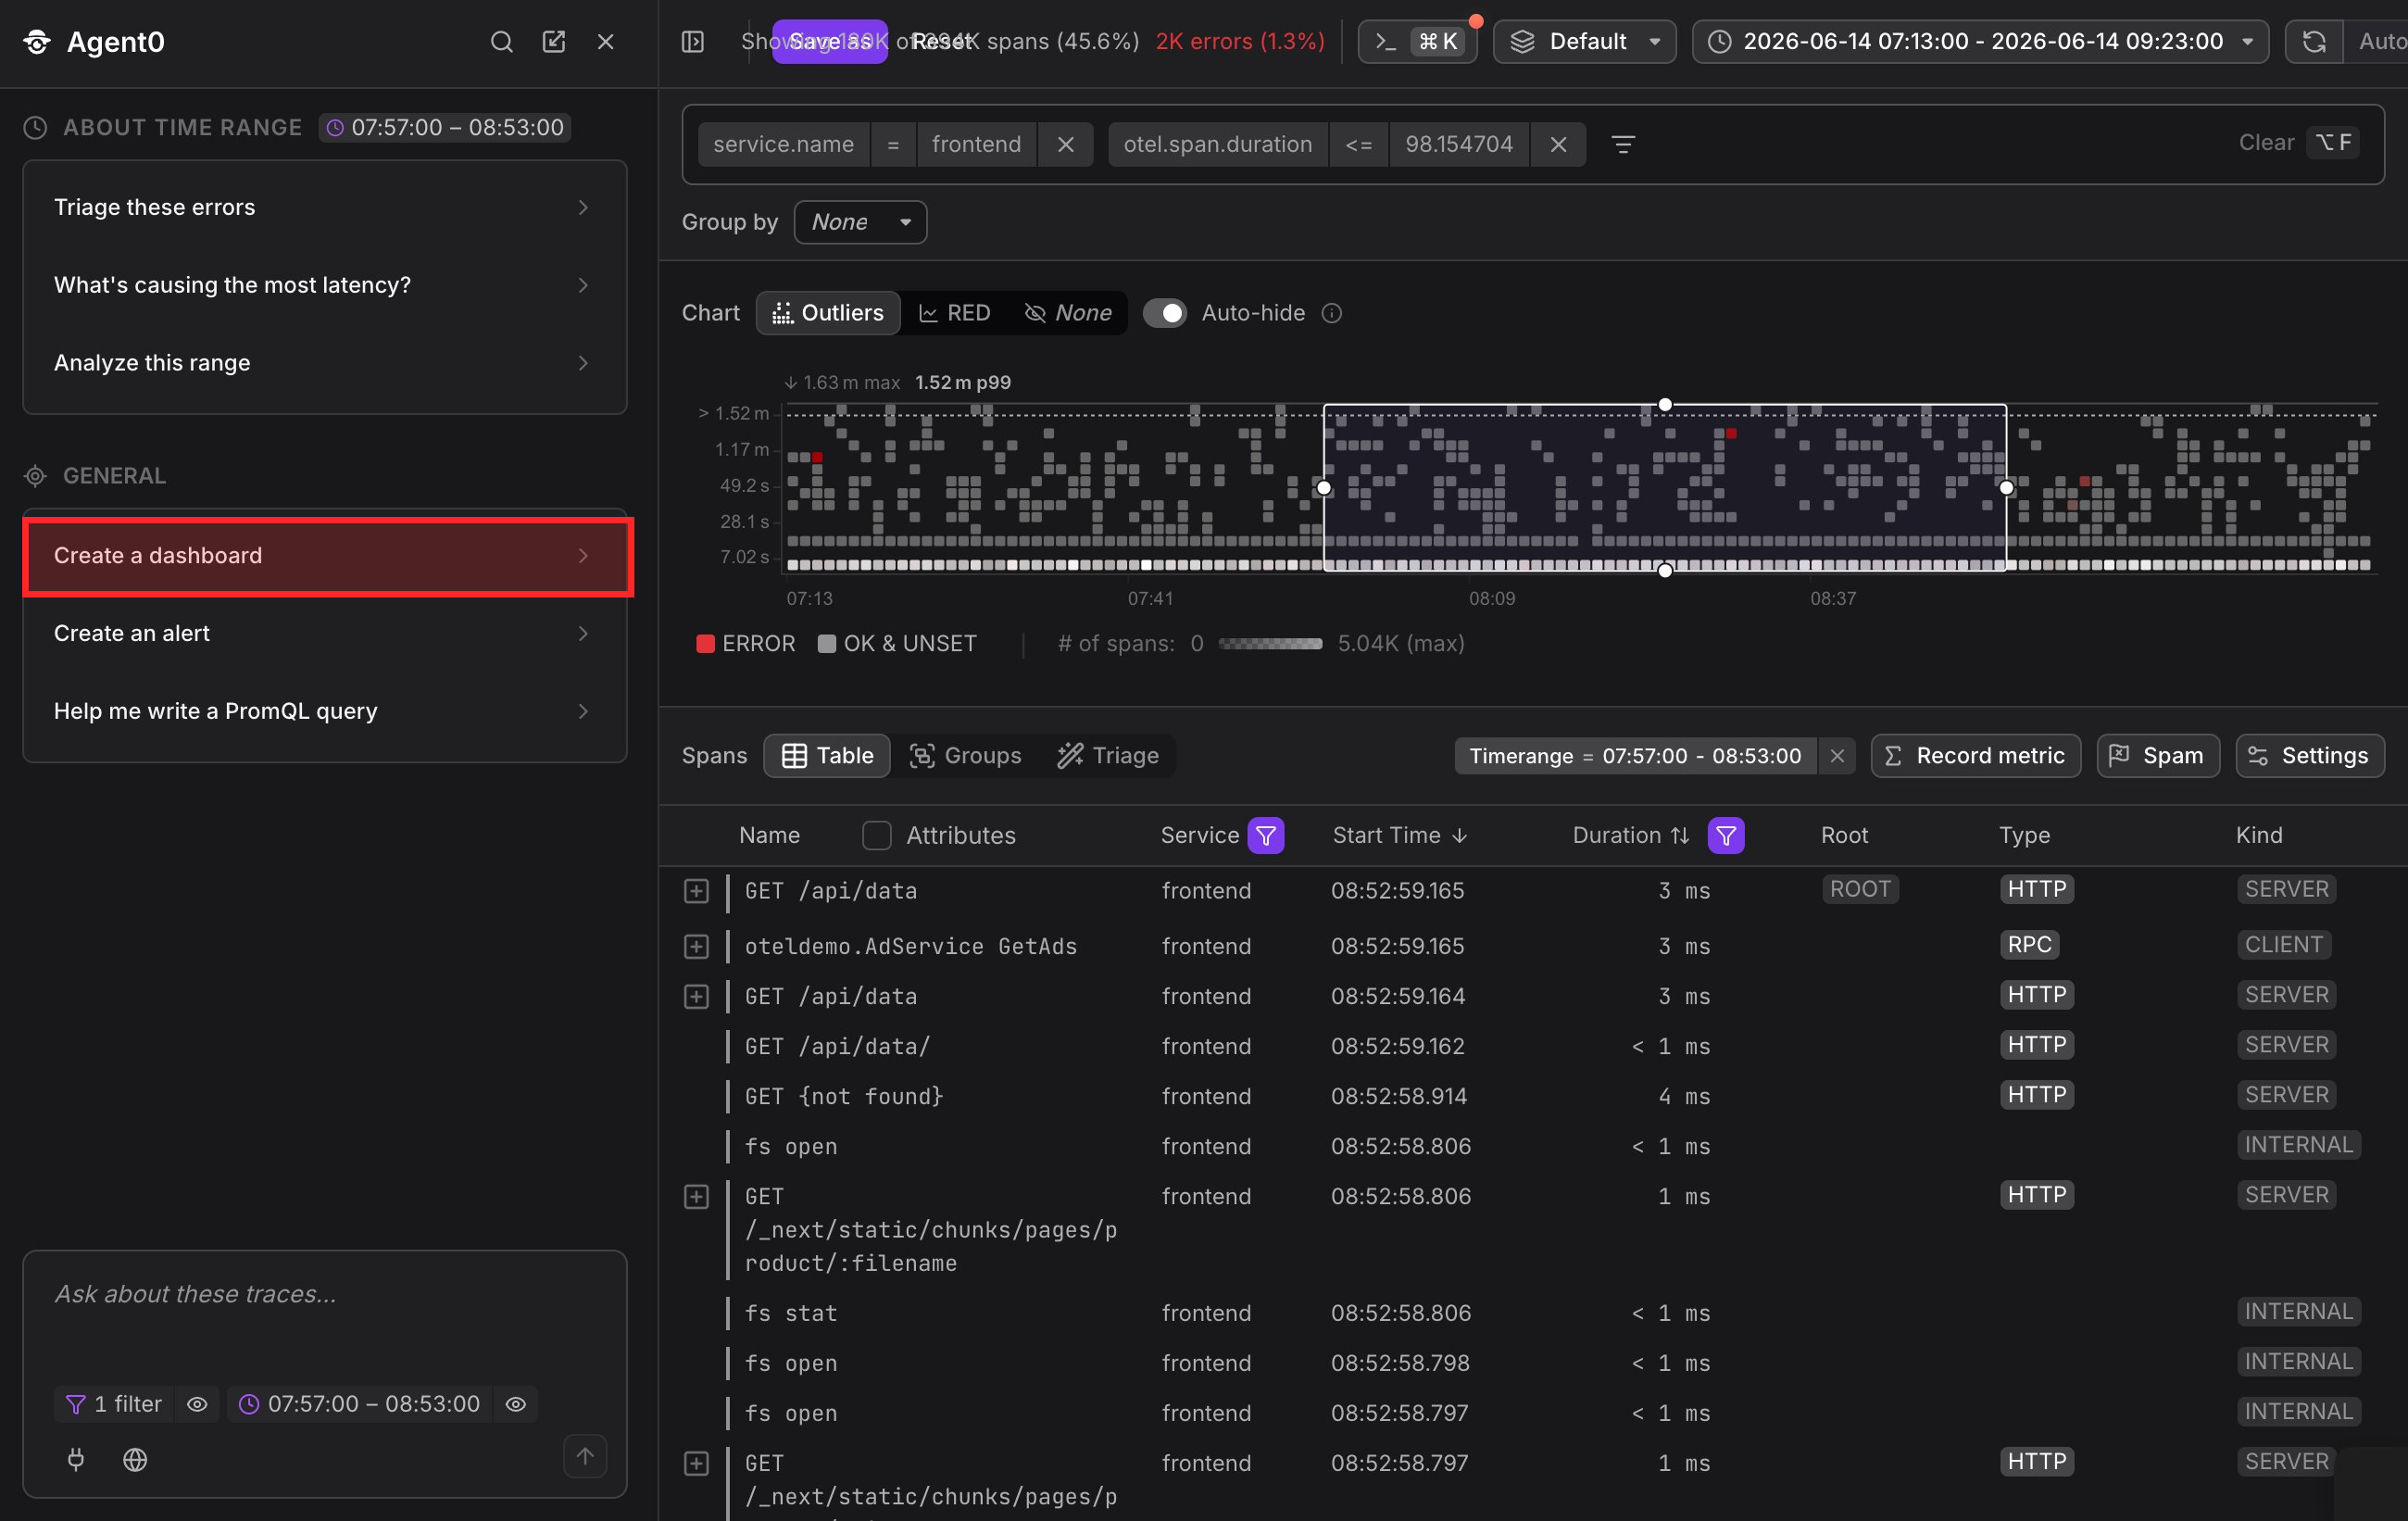
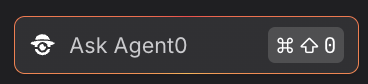
Begin by exploring your telemetry data and click Ask Agent0 in the navigation bar on the left to open the Agent0 Chat panel.
Set filters to focus on the specific service or component you want to visualize. Once you have the relevant data in view, click the Create a dashboard prompt in the Agent0 Chat panel.
Describe What You Want to Visualize
Click Create a dashboard in the Agent0 Chat panel. A prompt appears to help you describe what you want to visualize.
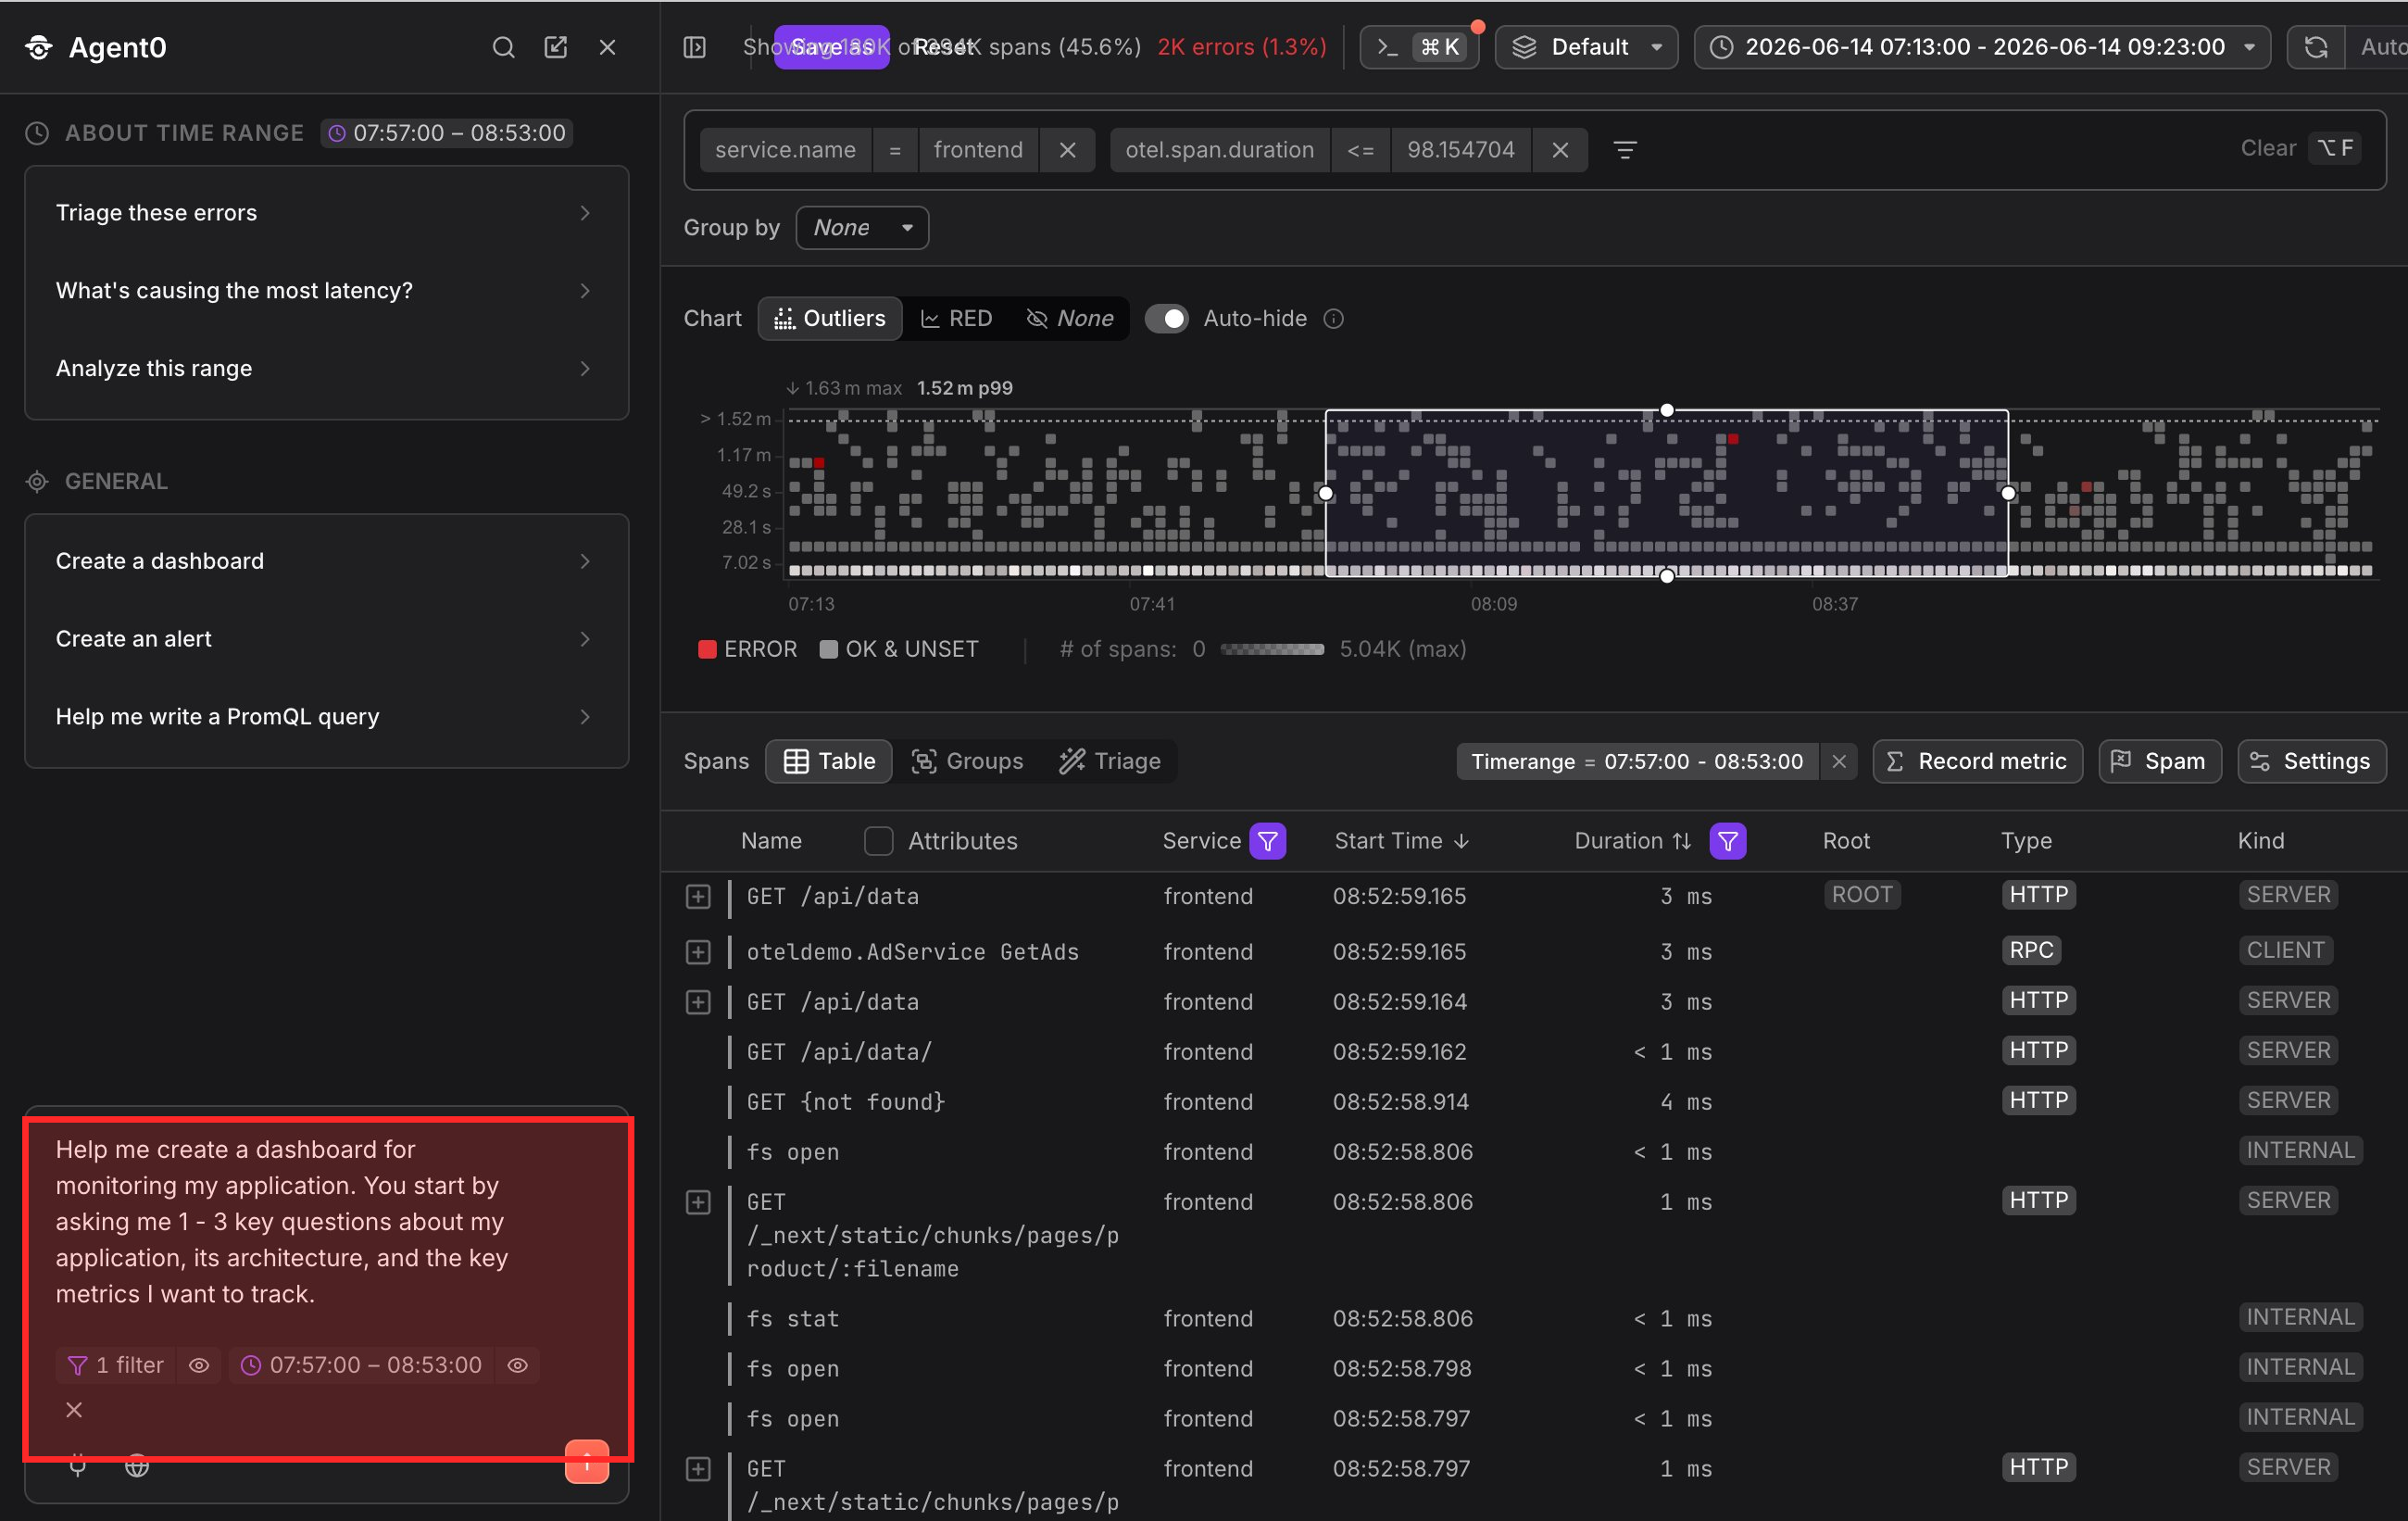
The prompt shown above appears automatically when you click Create a dashboard.
Be specific about:
- The services or components you want to monitor
- The metrics you want to track (latency, errors, throughput, resource usage, etc.)
- The time range or granularity
- Optional: visualization preferences (charts, gauges, tables)
Example prompts:
- "Create a dashboard showing RED metrics for the frontend service"
- "Build a dashboard tracking database performance with connection pool, query latency, and error rates"
- "Show me a dashboard for Kubernetes pod health with CPU, memory, and restart counts"
- "Create a service overview dashboard with latency, error rate, and throughput for all services"
- "Build a dashboard comparing p50, p95, and p99 latency across microservices"
- "Show infrastructure metrics for the payment service: CPU, memory, network, and disk I/O"
The more specific your prompt, the better Agent0 can configure the dashboard. Include service names, metric types, and visualization preferences for optimal results.
Agent0 Analyzes Your Request
Agent0 loads its dashboards skill and begins analyzing your requirements and identifying the key components needed for your dashboard.
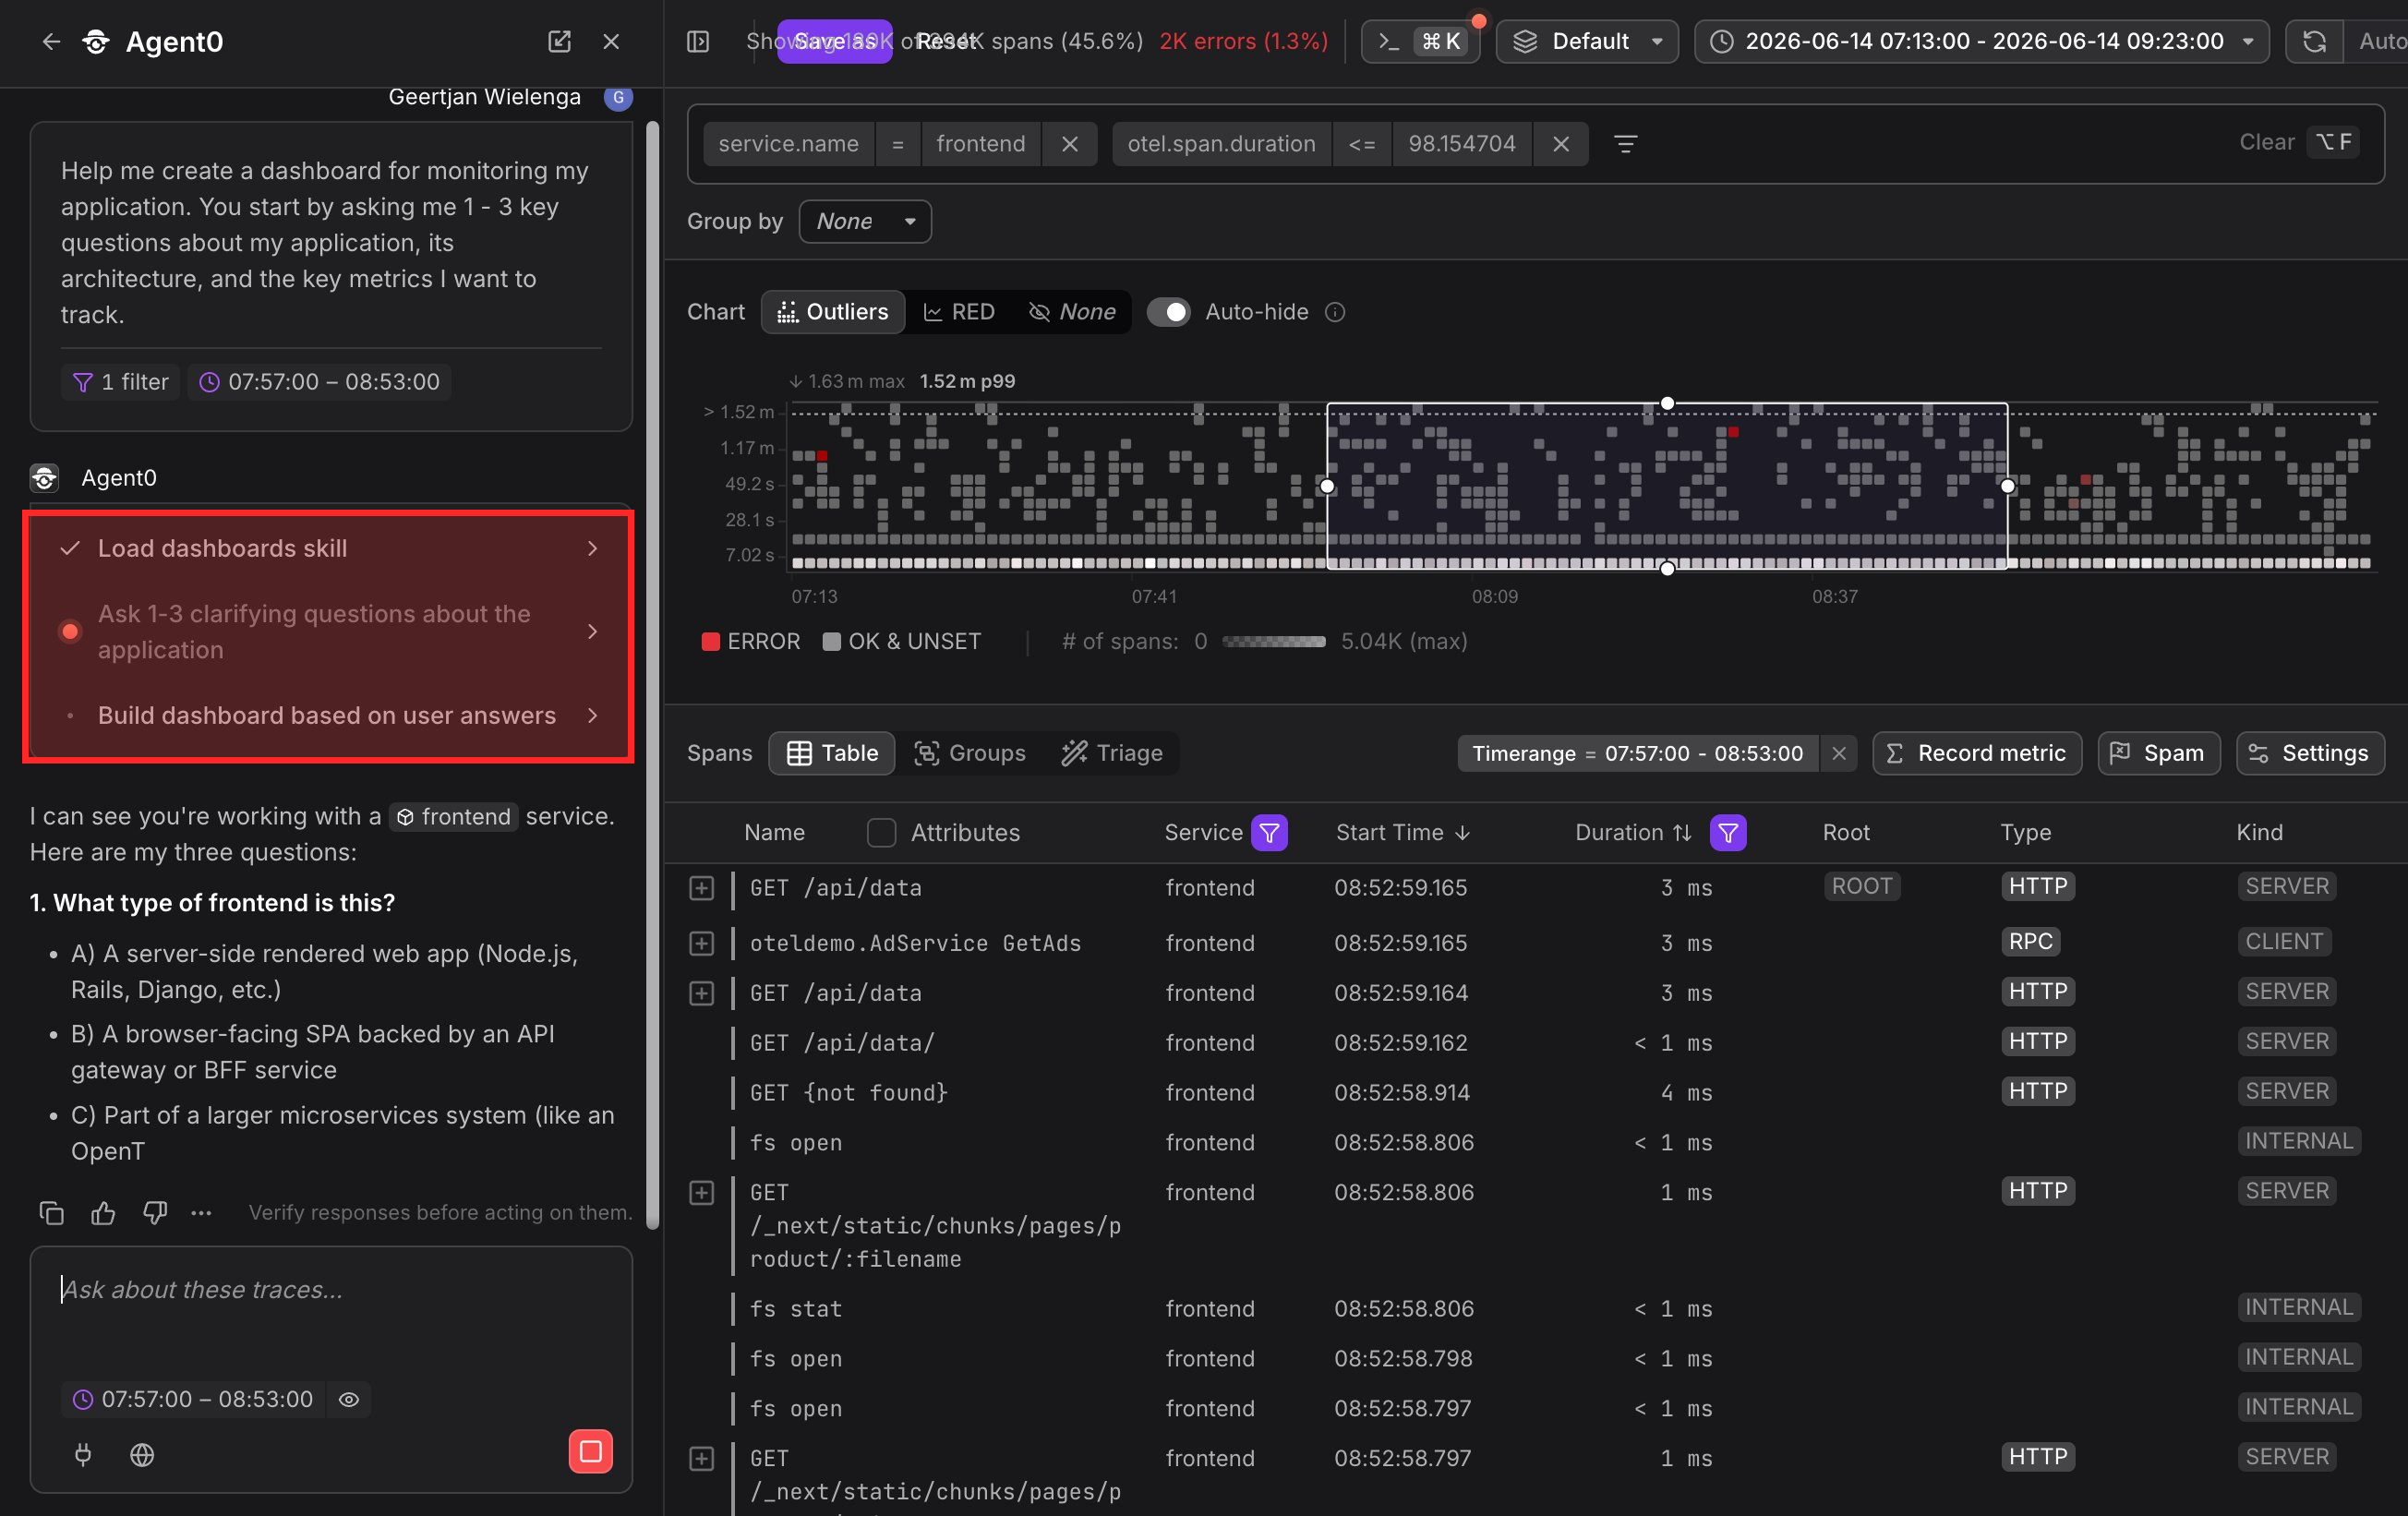
Agent0 asks clarifying questions to understand your goals better, such as the primary concern, dashboard scope, and specific metrics needed.
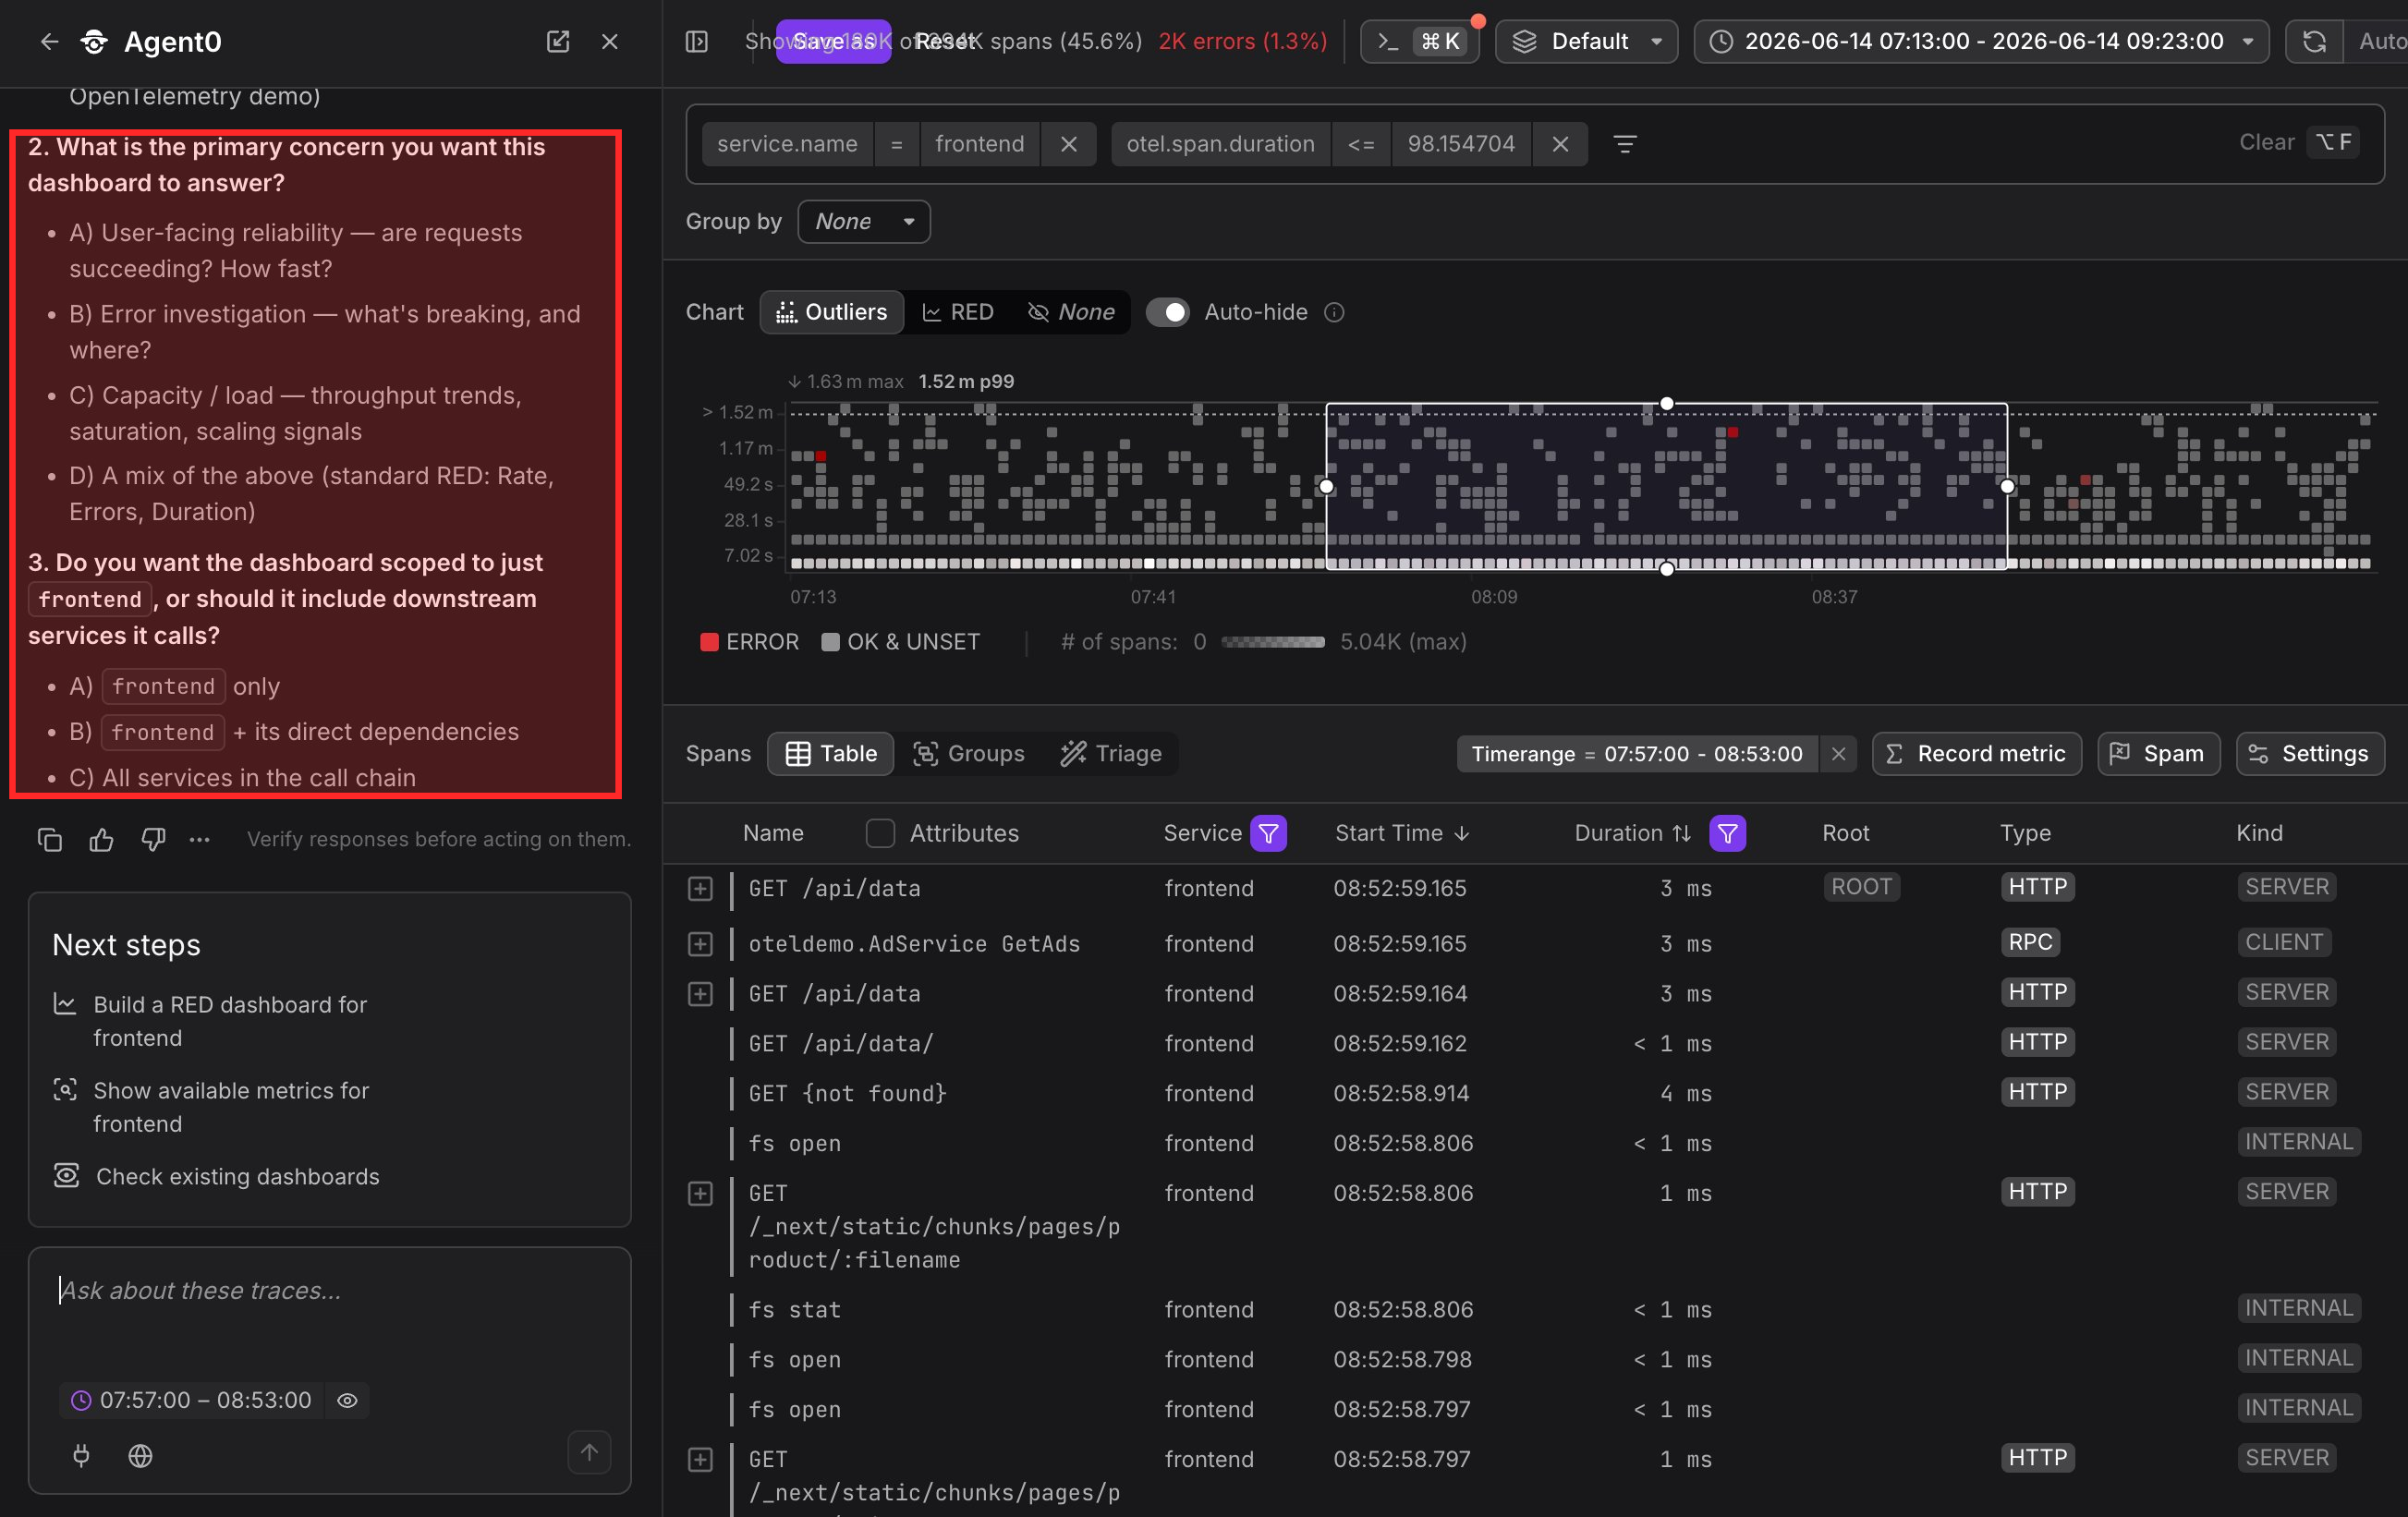
Provide answers to help Agent0 refine the dashboard structure. For example, specify whether you want to focus on frontend-only metrics or include downstream dependencies.
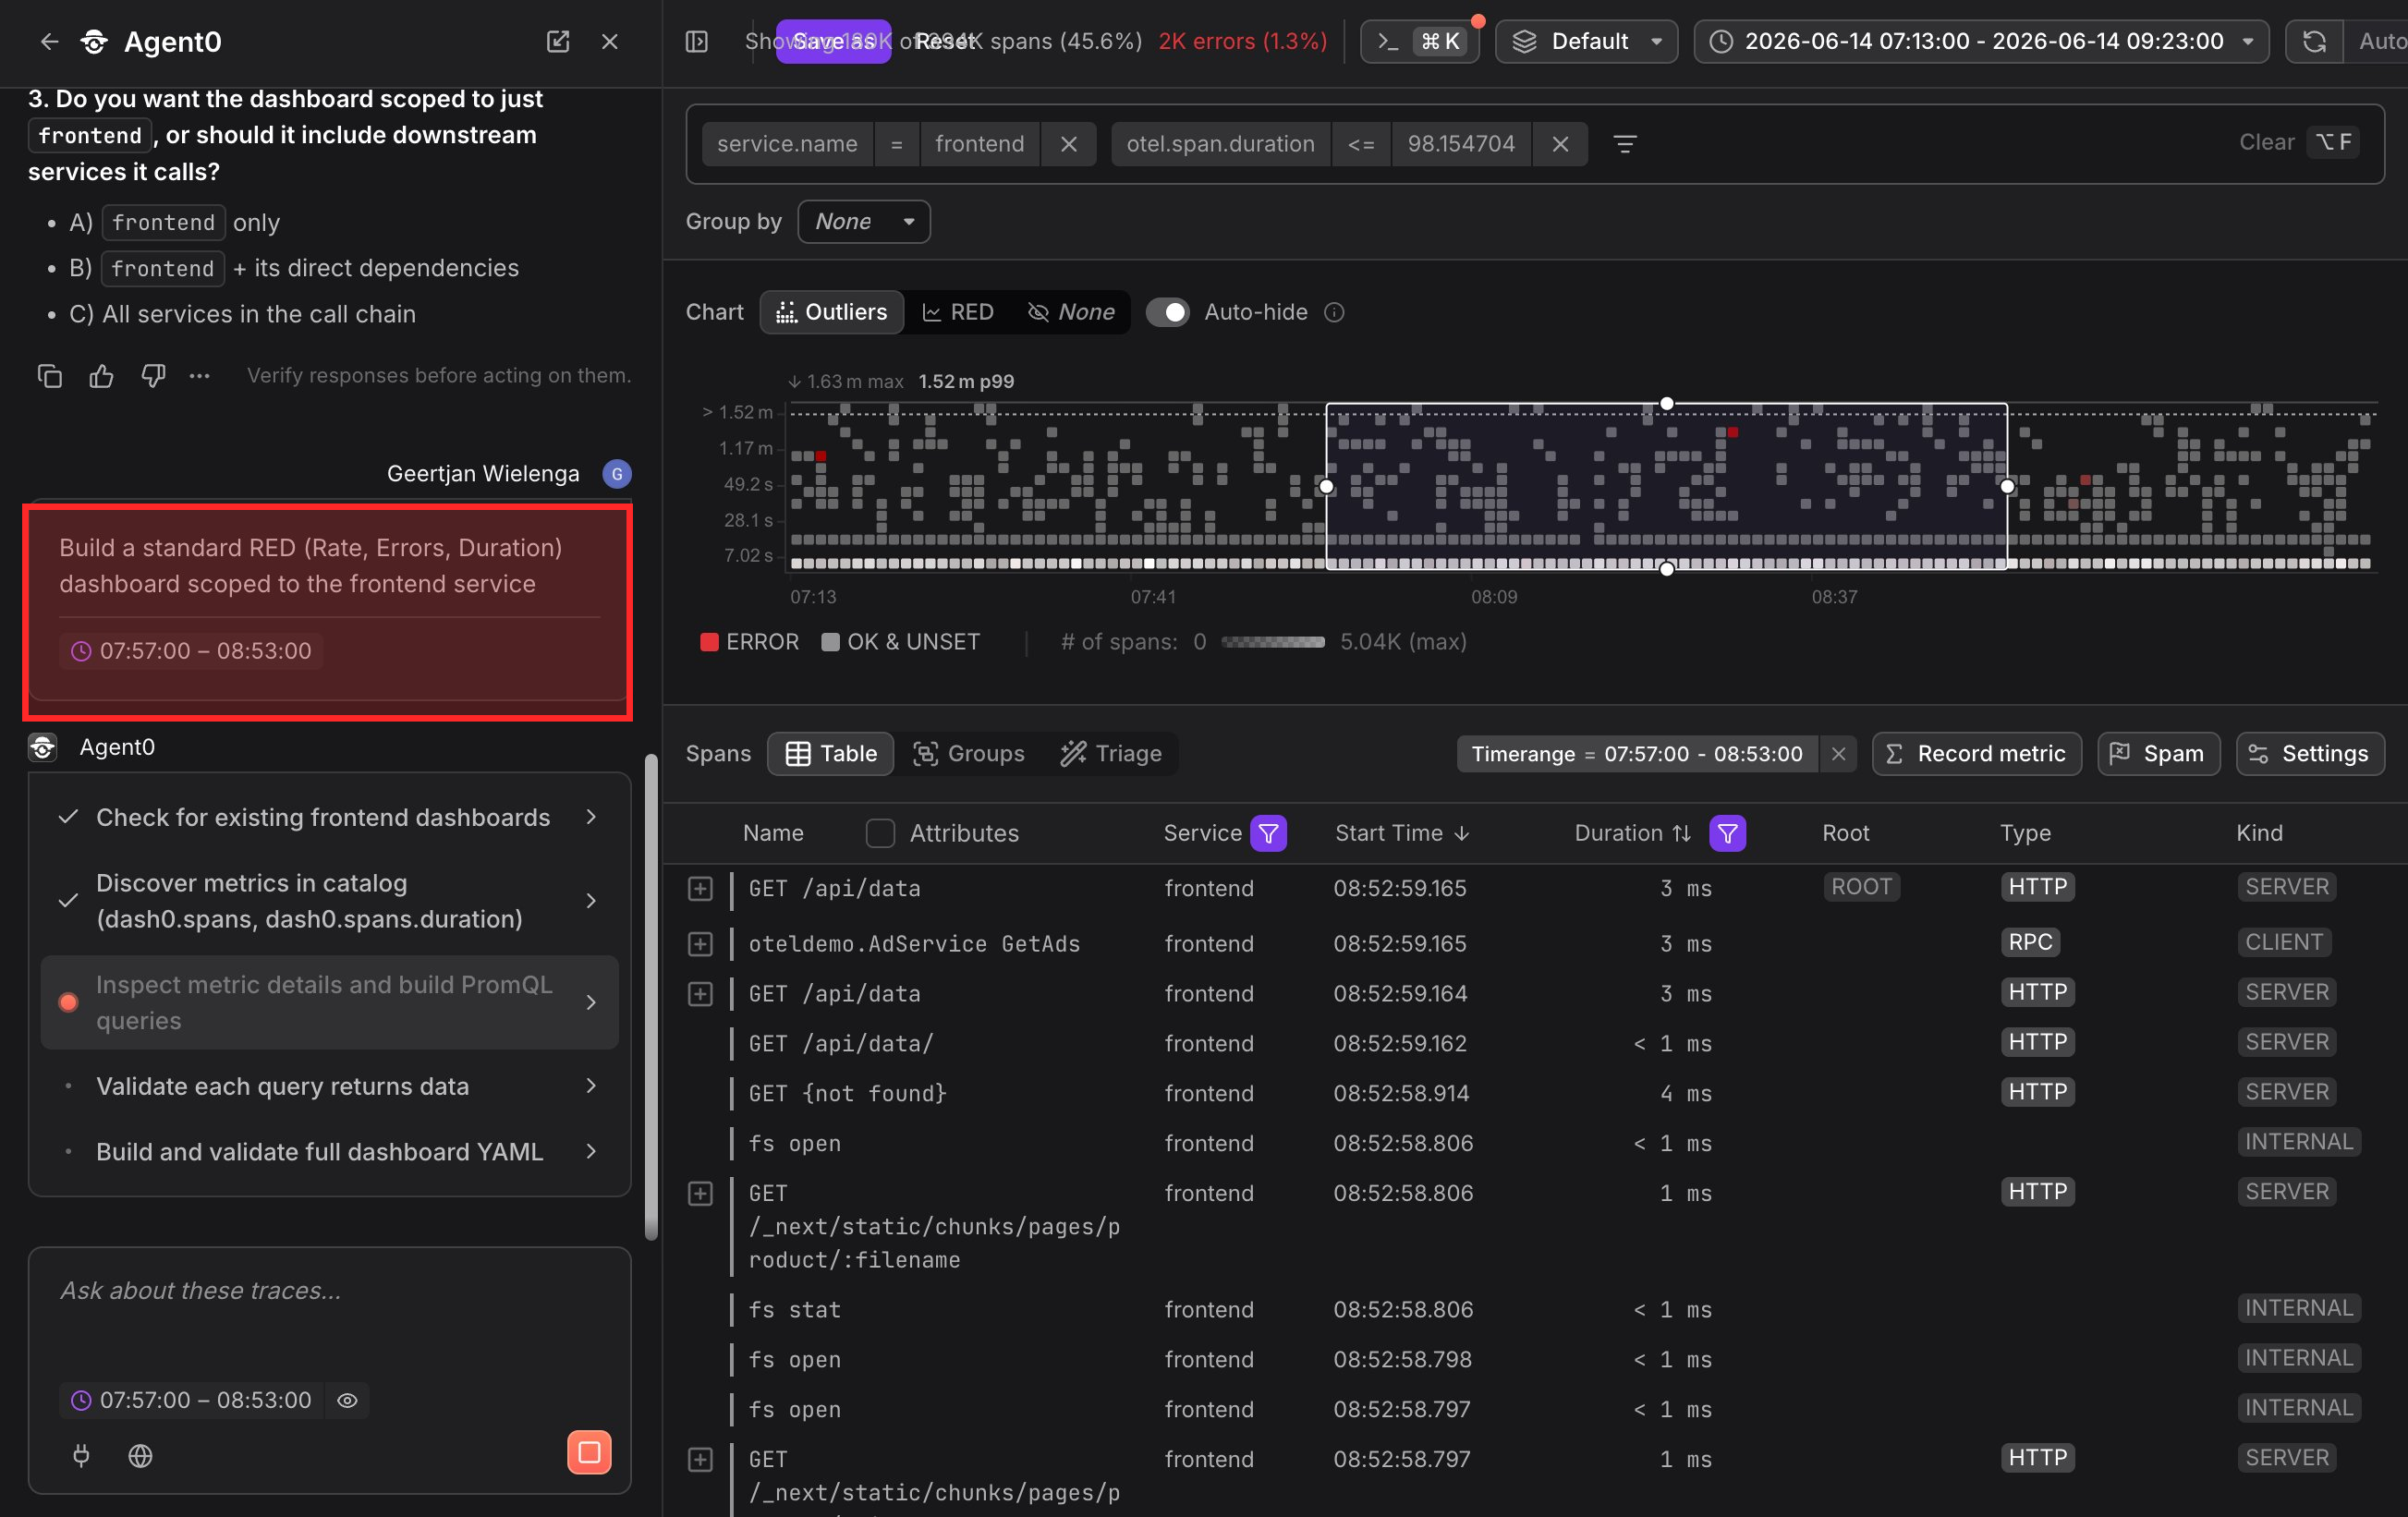
Building the Dashboard
Agent0 validates the approach and begins building the dashboard structure. It checks for existing dashboards, validates query data, and builds the full dashboard YAML.
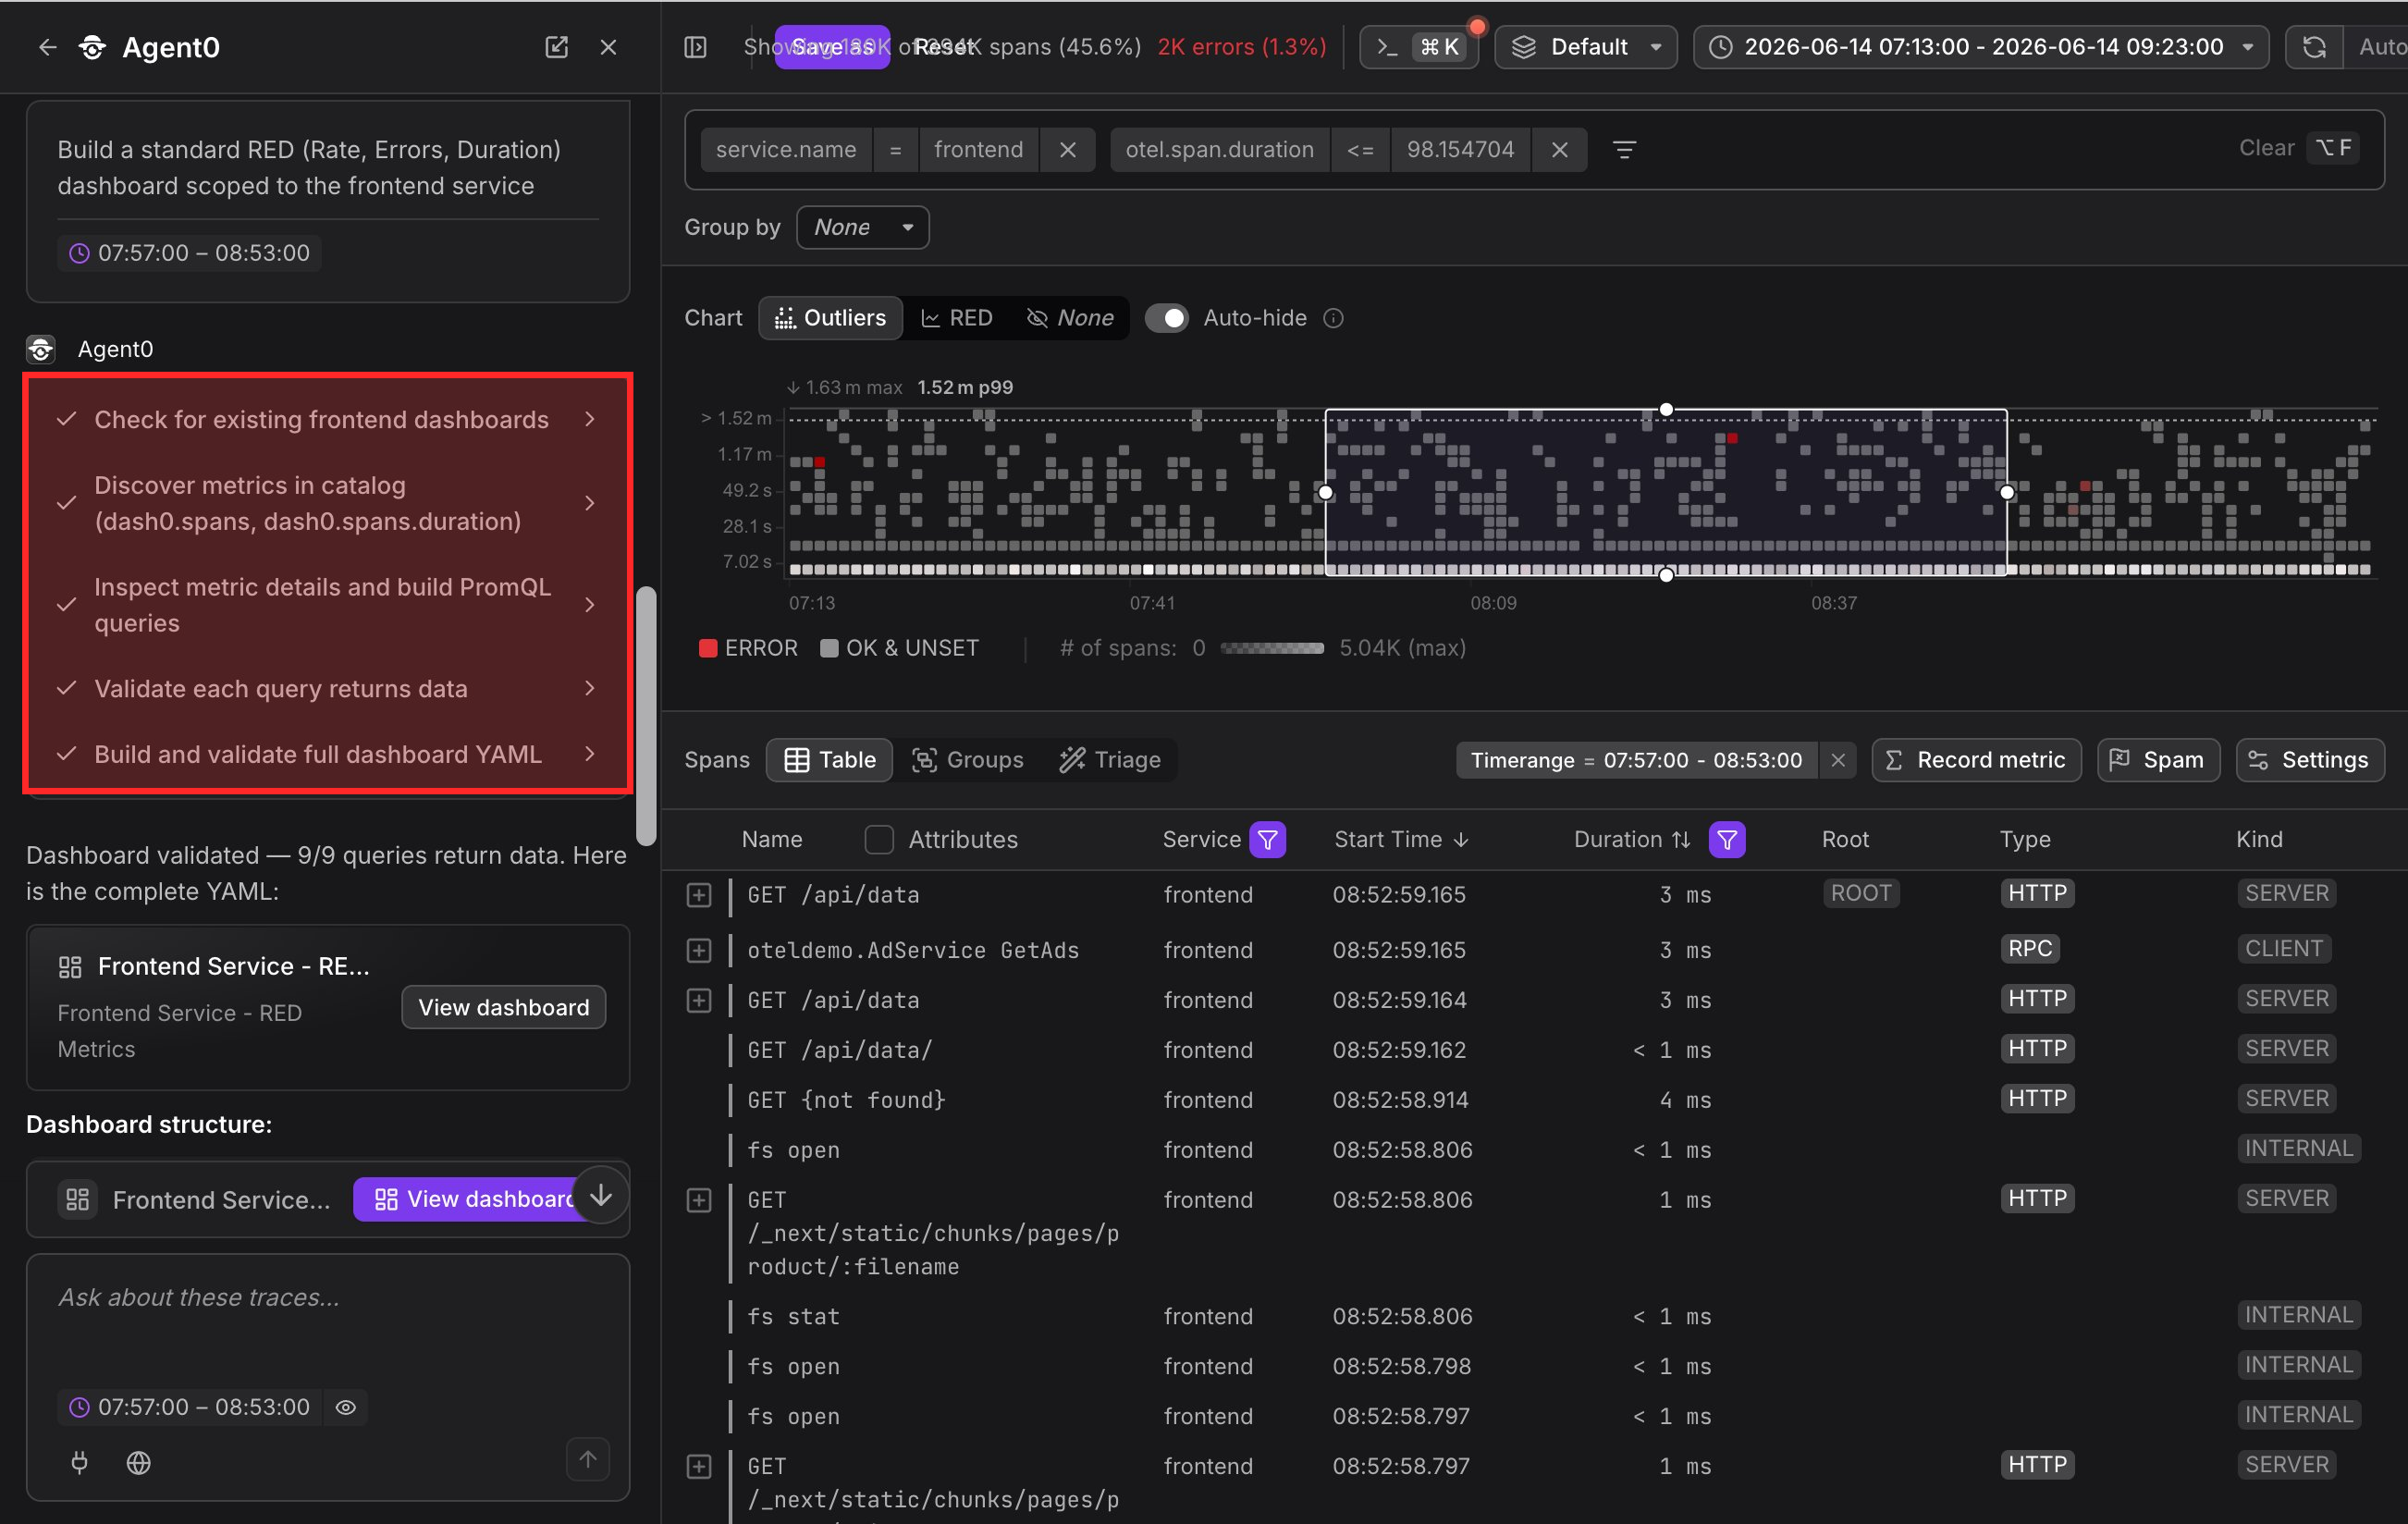
Review the Generated Dashboard
Agent0 generates a complete dashboard configuration and displays the structure in the chat.
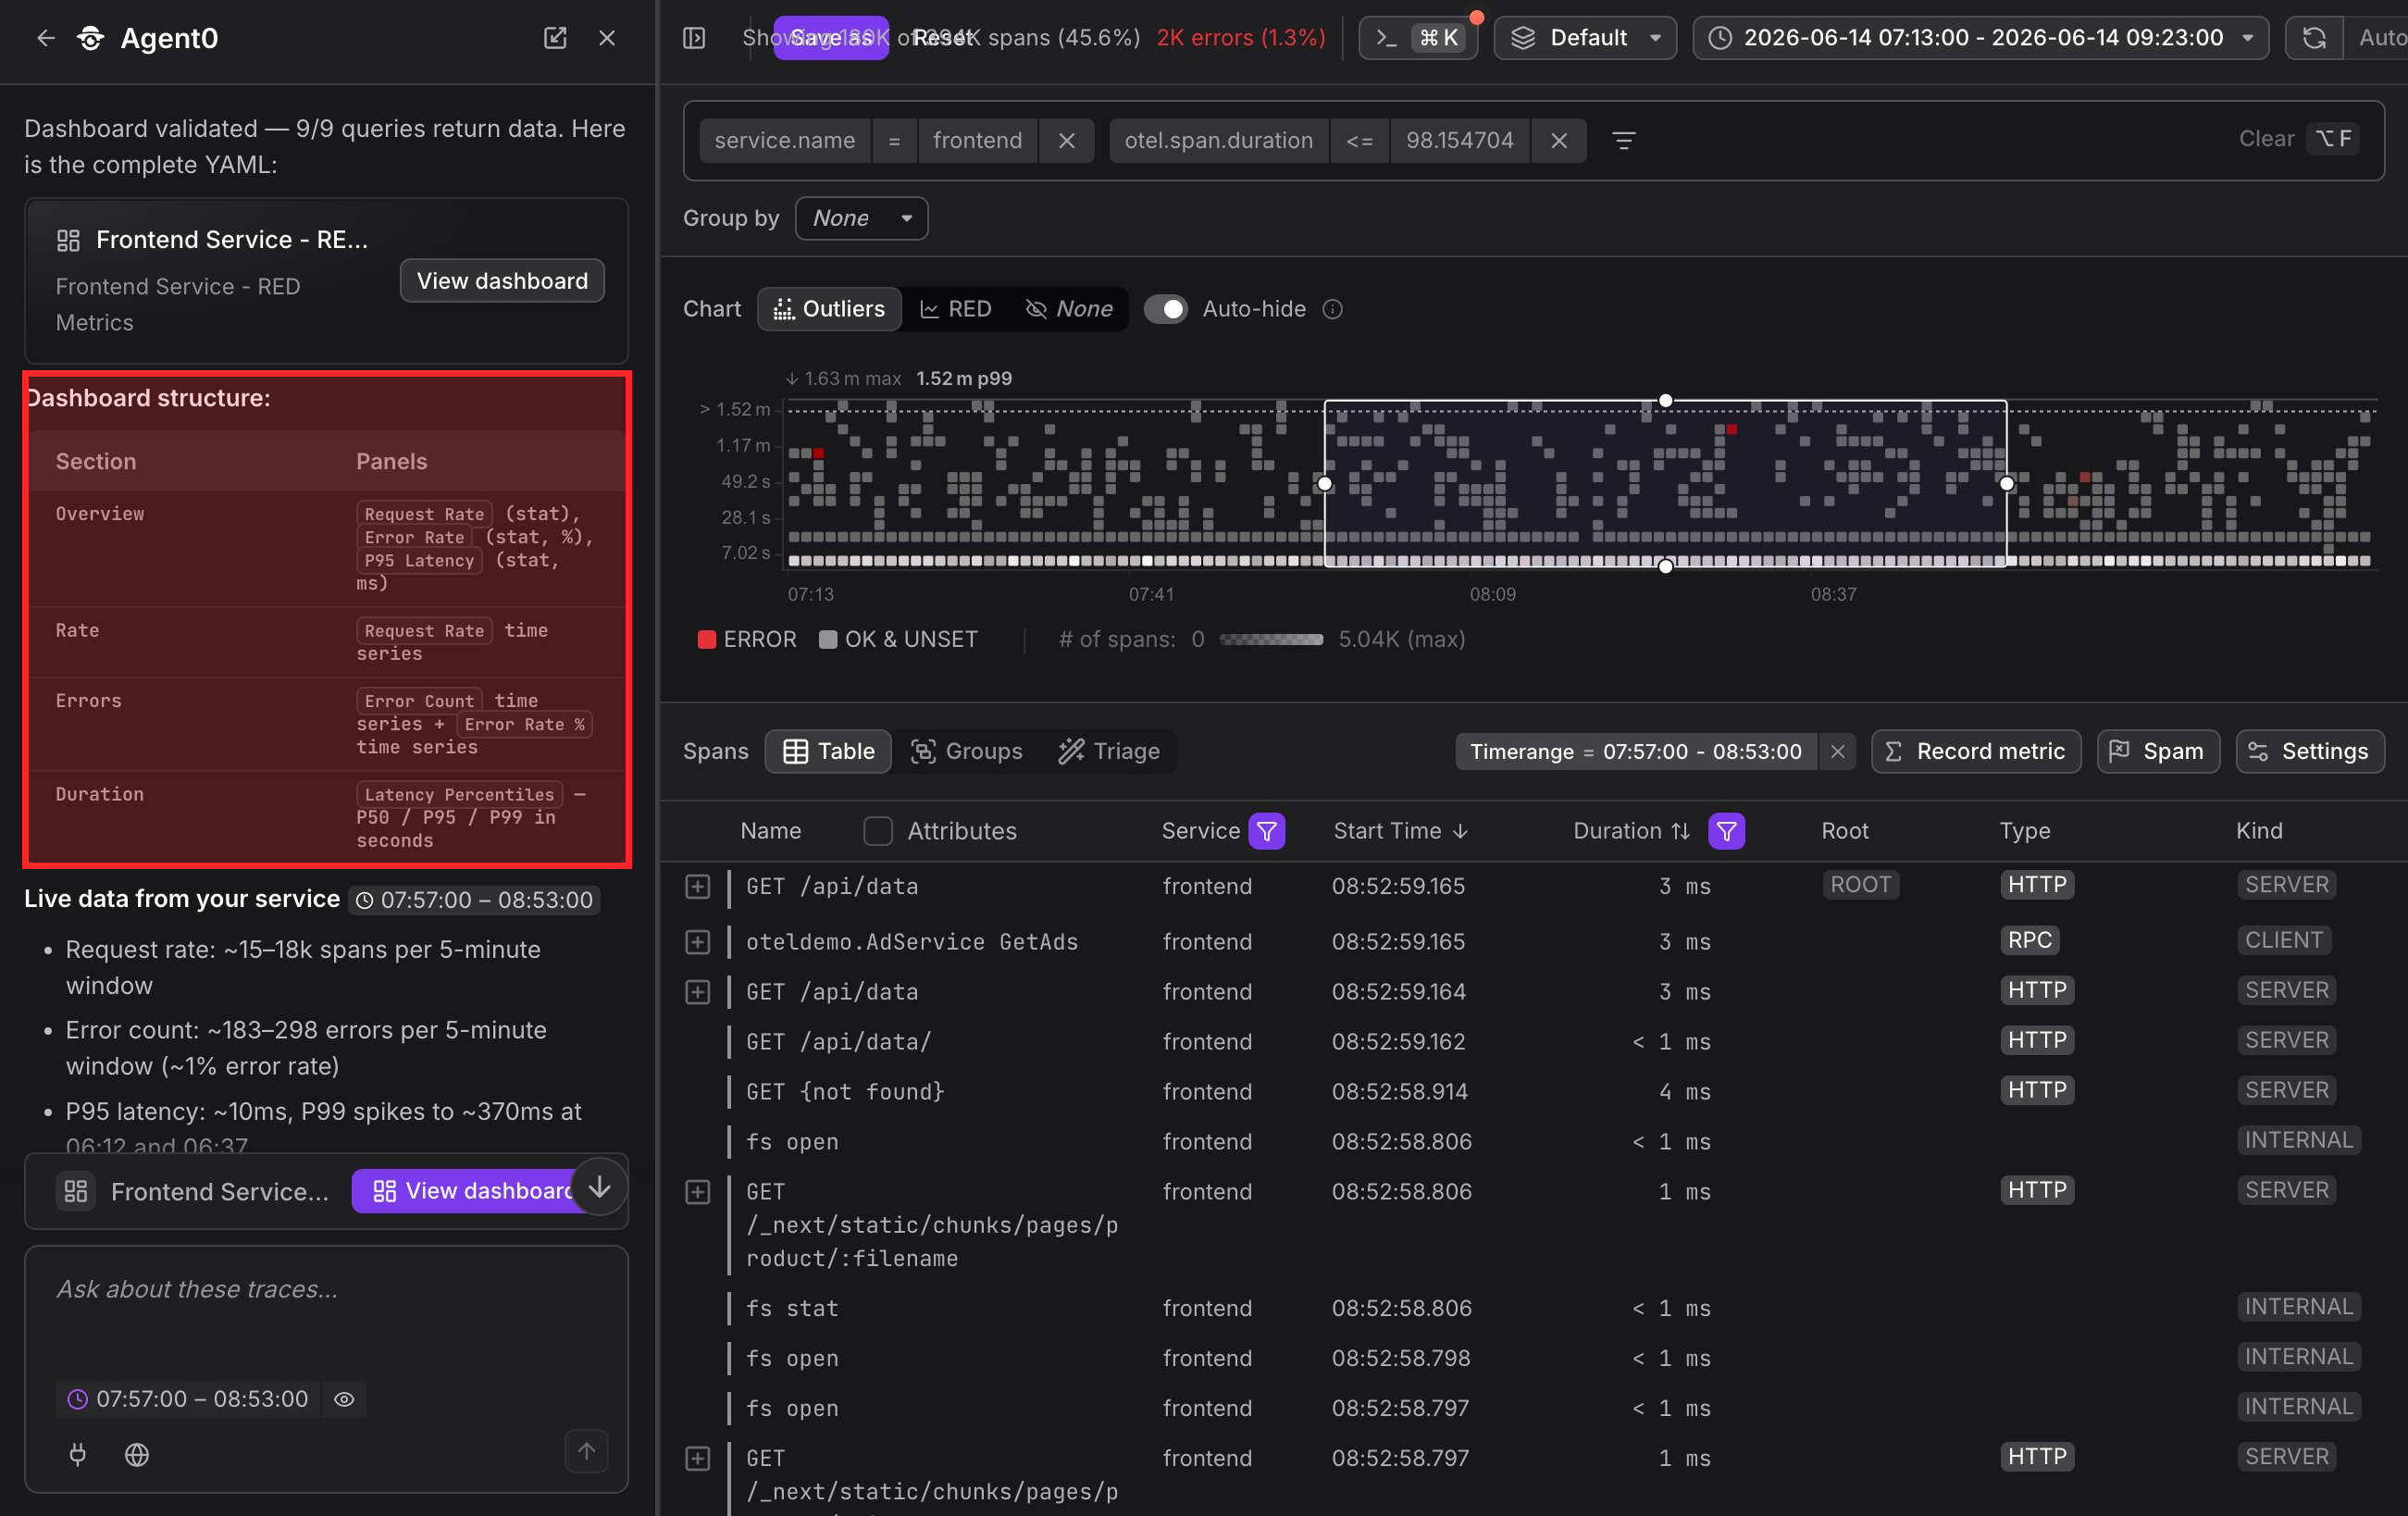
The configuration includes:
- Panels — Individual visualizations with queries and display settings
- Layout — Panel positioning and sizing
- Queries — PromQL expressions validated against your telemetry
- Visualizations — Appropriate chart types for each metric
- Variables — Dashboard-level filters (e.g., service selector, environment)
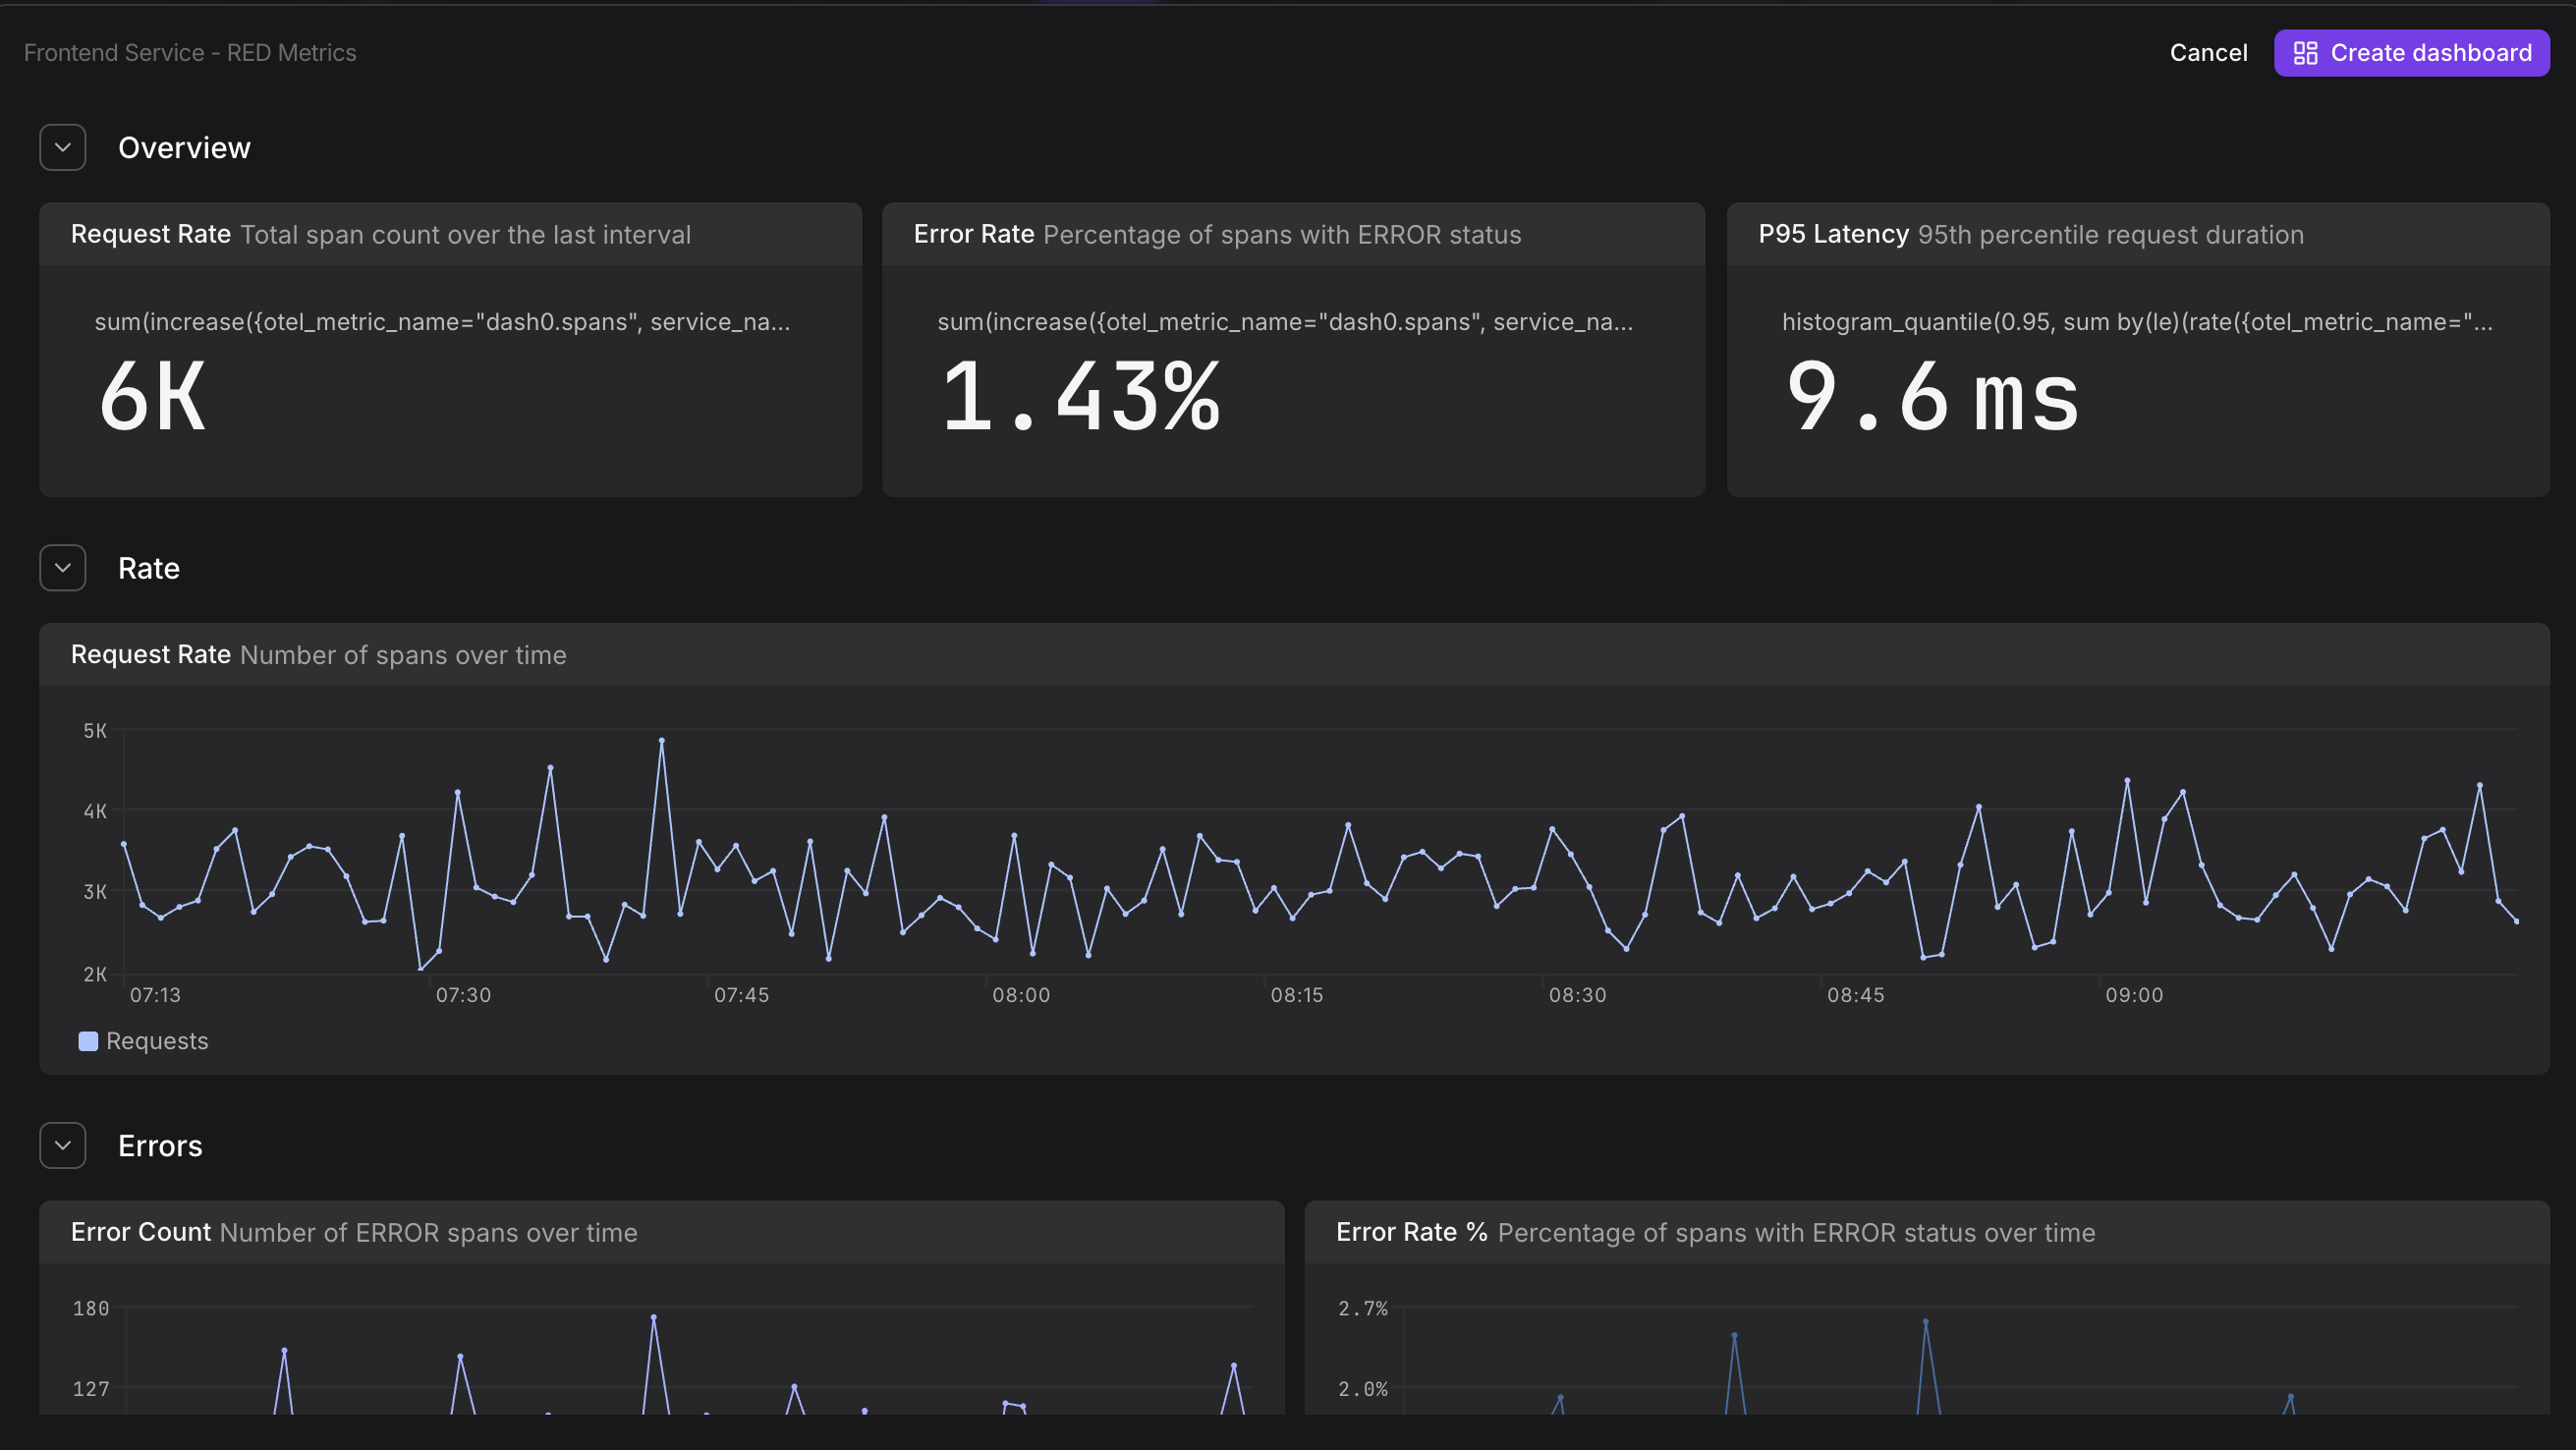
Example for "Create a dashboard showing RED metrics for the frontend service":
- Panel 1: Request Rate — Time series chart showing requests per second
- Panel 2: Error Rate — Time series chart showing error percentage
- Panel 3: Latency — Time series chart showing p50, p95, p99 latency
- Variables — Service selector defaulting to "frontend"
Agent0 provides live data from your service, showing what metrics are available and how they'll appear in the dashboard.
If the generated dashboard needs adjustments, iterate with Agent0:
- "Add a panel showing top 10 endpoints by latency"
- "Change the latency panel to show only p99"
- "Add memory and CPU usage panels"
- "Group panels by service instead of metric type"
- "Add a variable to filter by environment"
Save the Dashboard
Once satisfied with the configuration, click View dashboard in the Agent0 response. The dashboard opens in edit mode with all panels pre-configured.
Review the layout and visualizations, then click Save dashboard to persist it.
The dashboard is immediately available in your dashboard list and can be shared with teammates through access control permissions.
Further Reading
- About Dashboards — Overview of Dash0's dashboard capabilities
- Create Dashboards from Scratch — Step-by-step guide to creating dashboards
- Manage Dashboards as Code — Version control dashboard configurations
- Create Check Rules — Generate alert rules with Agent0
- Create Pull Requests — Raise IaC configurations as PRs