
Last updated: October 1, 2026
Create Check Rules
Agent0 generates check rules from natural language descriptions. Describe what you want to monitor, and Agent0 creates the PromQL query, sets thresholds, configures grace periods, and suggests notification channels.
Creating check rules requires Admin privileges or a Maintainer role in the dataset. See About Alert Monitoring for details on access restrictions.
How It Works
Agent0 analyzes your natural language description and automatically:
- Generates valid PromQL queries based on your telemetry
- Sets reasonable thresholds based on the metric type
- Configures appropriate grace periods to prevent noise
- Suggests notification channels and severity levels
- Creates summary and description templates with variables
- Validates that the query returns real data before creating the check rule
Start with Your Context
Begin by exploring your telemetry data and click Ask Agent0 in the navigation bar on the left to open the Agent0 Chat panel.
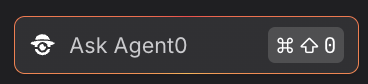
Set filters to focus on the specific service or component you want to monitor. Once you have the relevant data in view, click the Create an alert prompt in the Agent0 Chat panel.
Describe What You Want to Monitor
Provide a detailed description of what you want to monitor. Be specific about:
- The service or component you're monitoring
- The metric type (latency, error rate, resource usage, etc.)
- The threshold value
- Optional: notification preferences
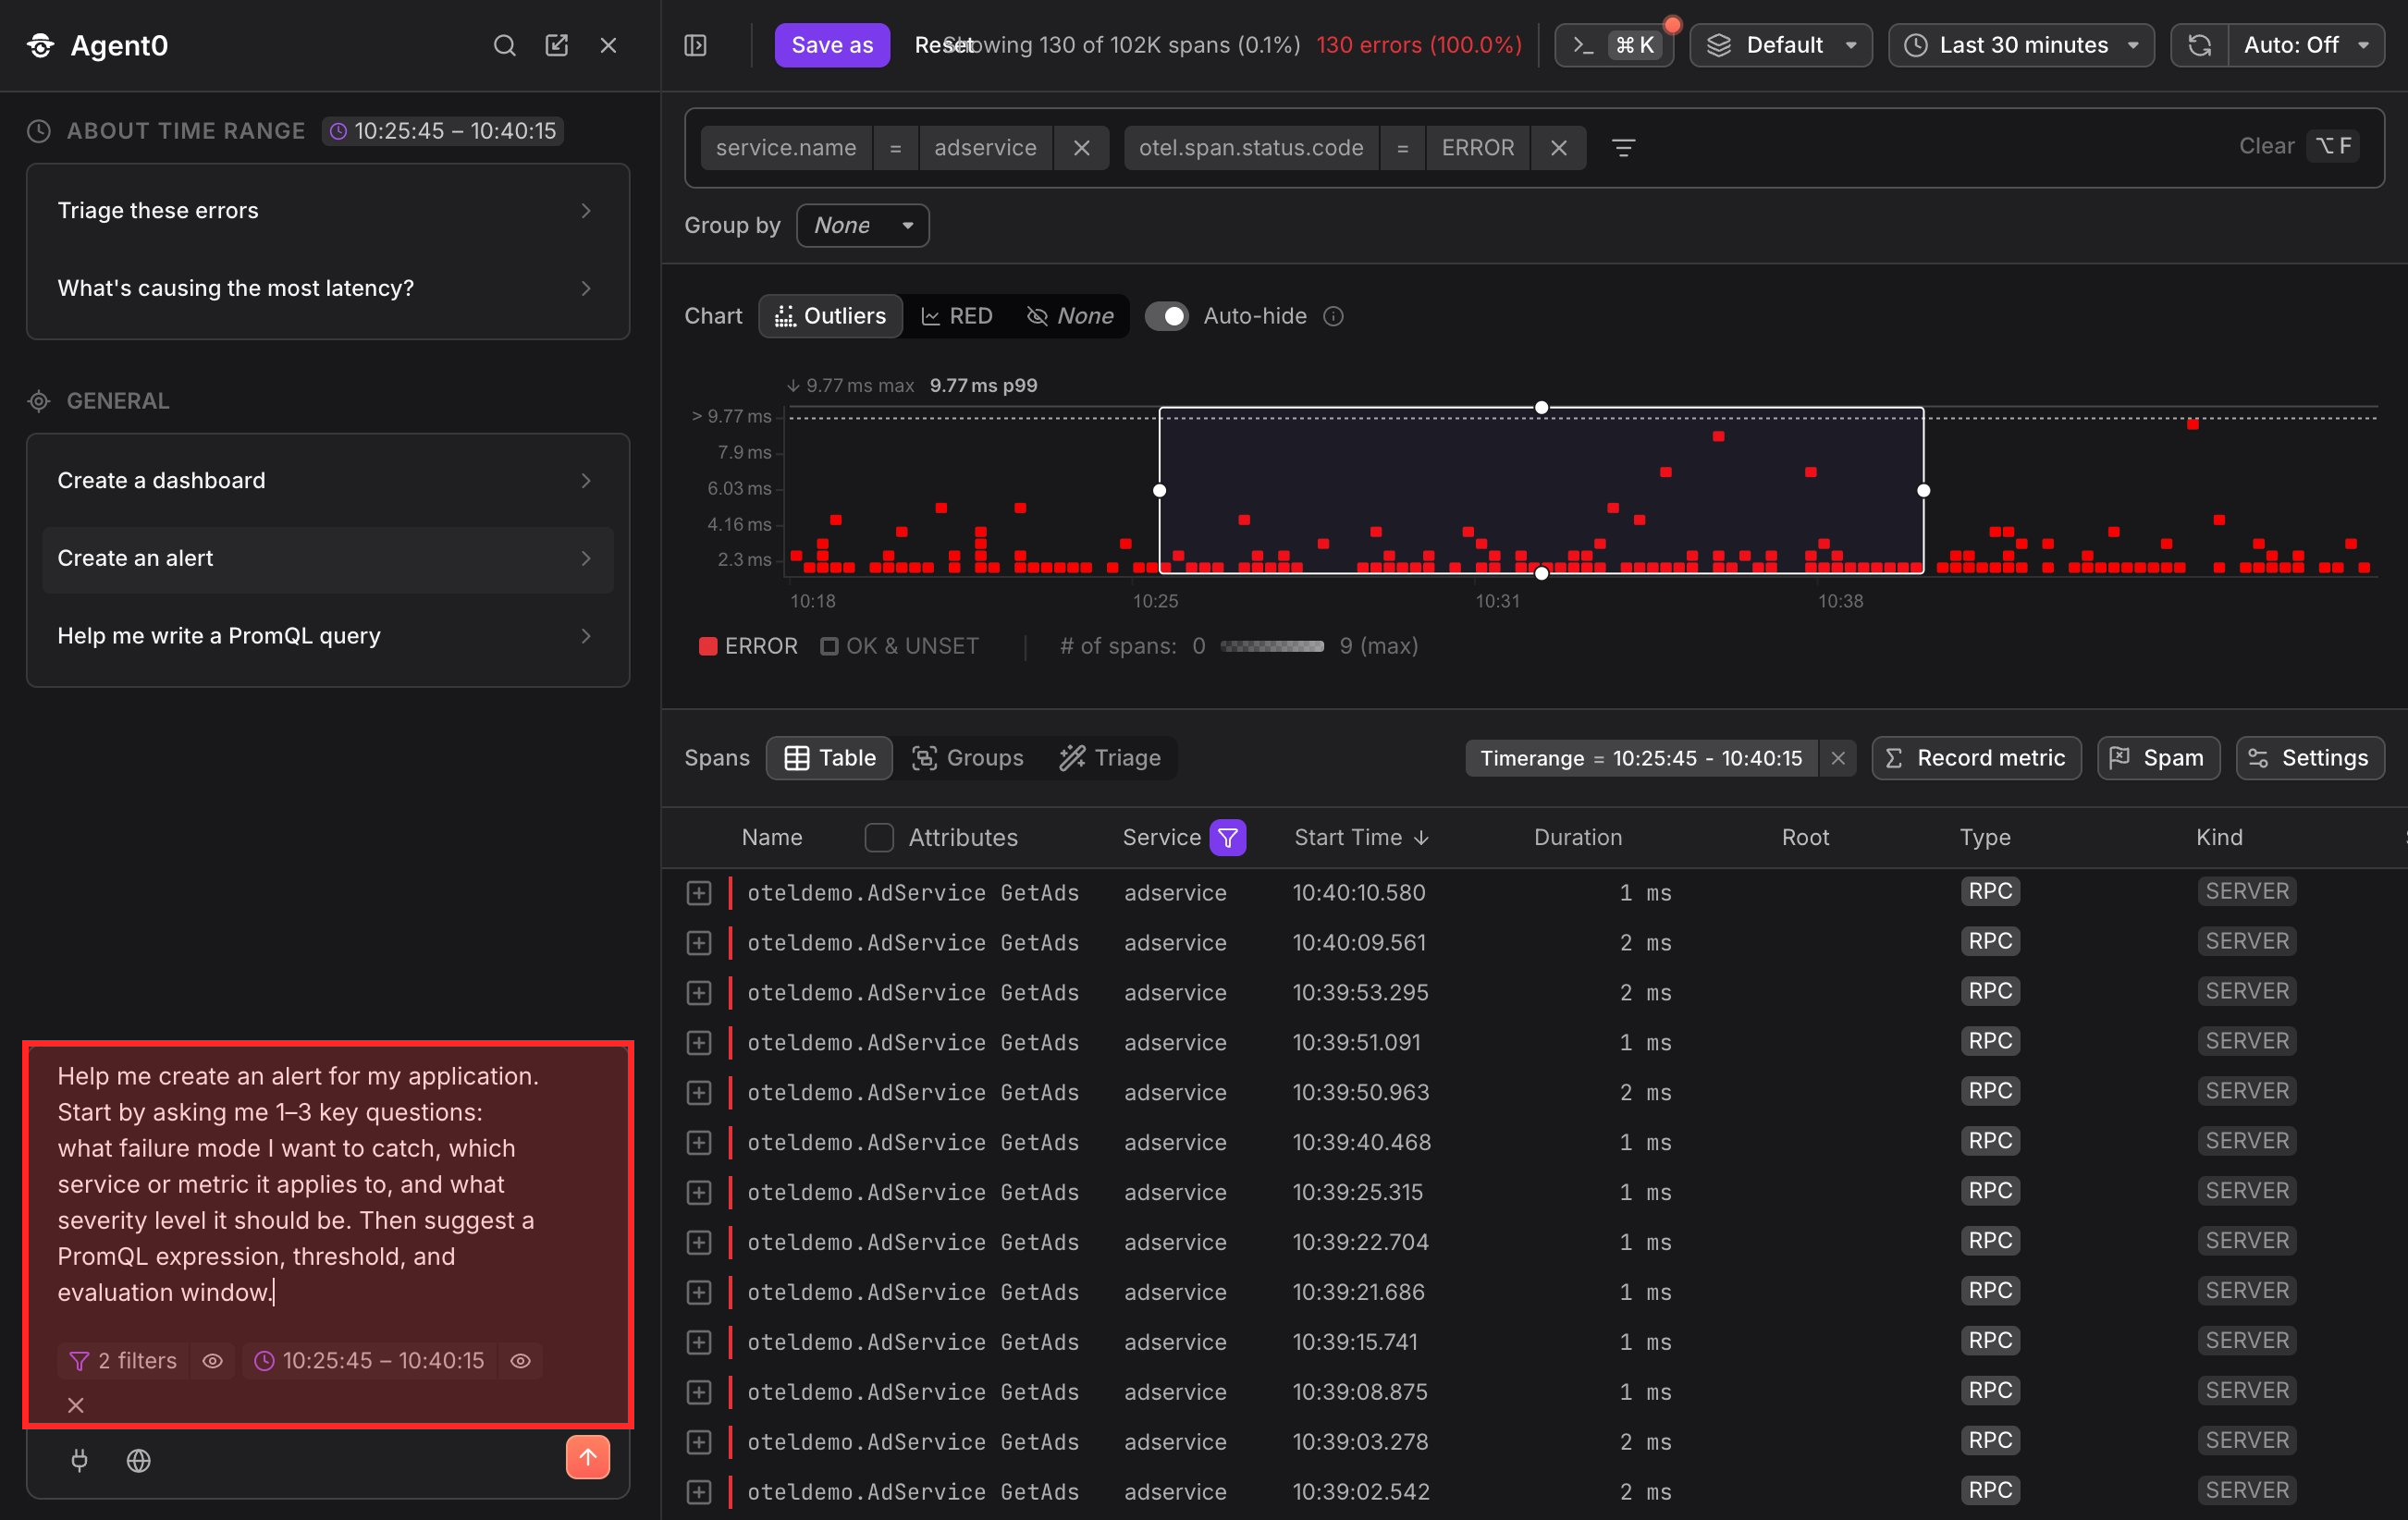
The prompt shown above appears automatically when you click Create an alert.
Example prompts:
- "Alert me when frontend latency exceeds 500ms"
- "Monitor error rate for payment-service and notify me when it's above 5%"
- "Create a check for database connection pool exhaustion"
- "Alert when the checkout endpoint P99 latency is over 2 seconds"
- "Monitor log errors in the auth service and send to Slack"
- "Track when CPU usage on backend services exceeds 80%"
- "Alert if any service's request rate drops below 10 requests per minute"
The more specific your prompt, the better Agent0 can configure the check rule. Include service names, metric types, thresholds, and notification preferences for optimal results.
Agent0 Analyzes Your Request
Agent0 loads its alerts skill and begins analyzing your requirements. It identifies the key components needed for your check rule and prepares to validate the configuration.
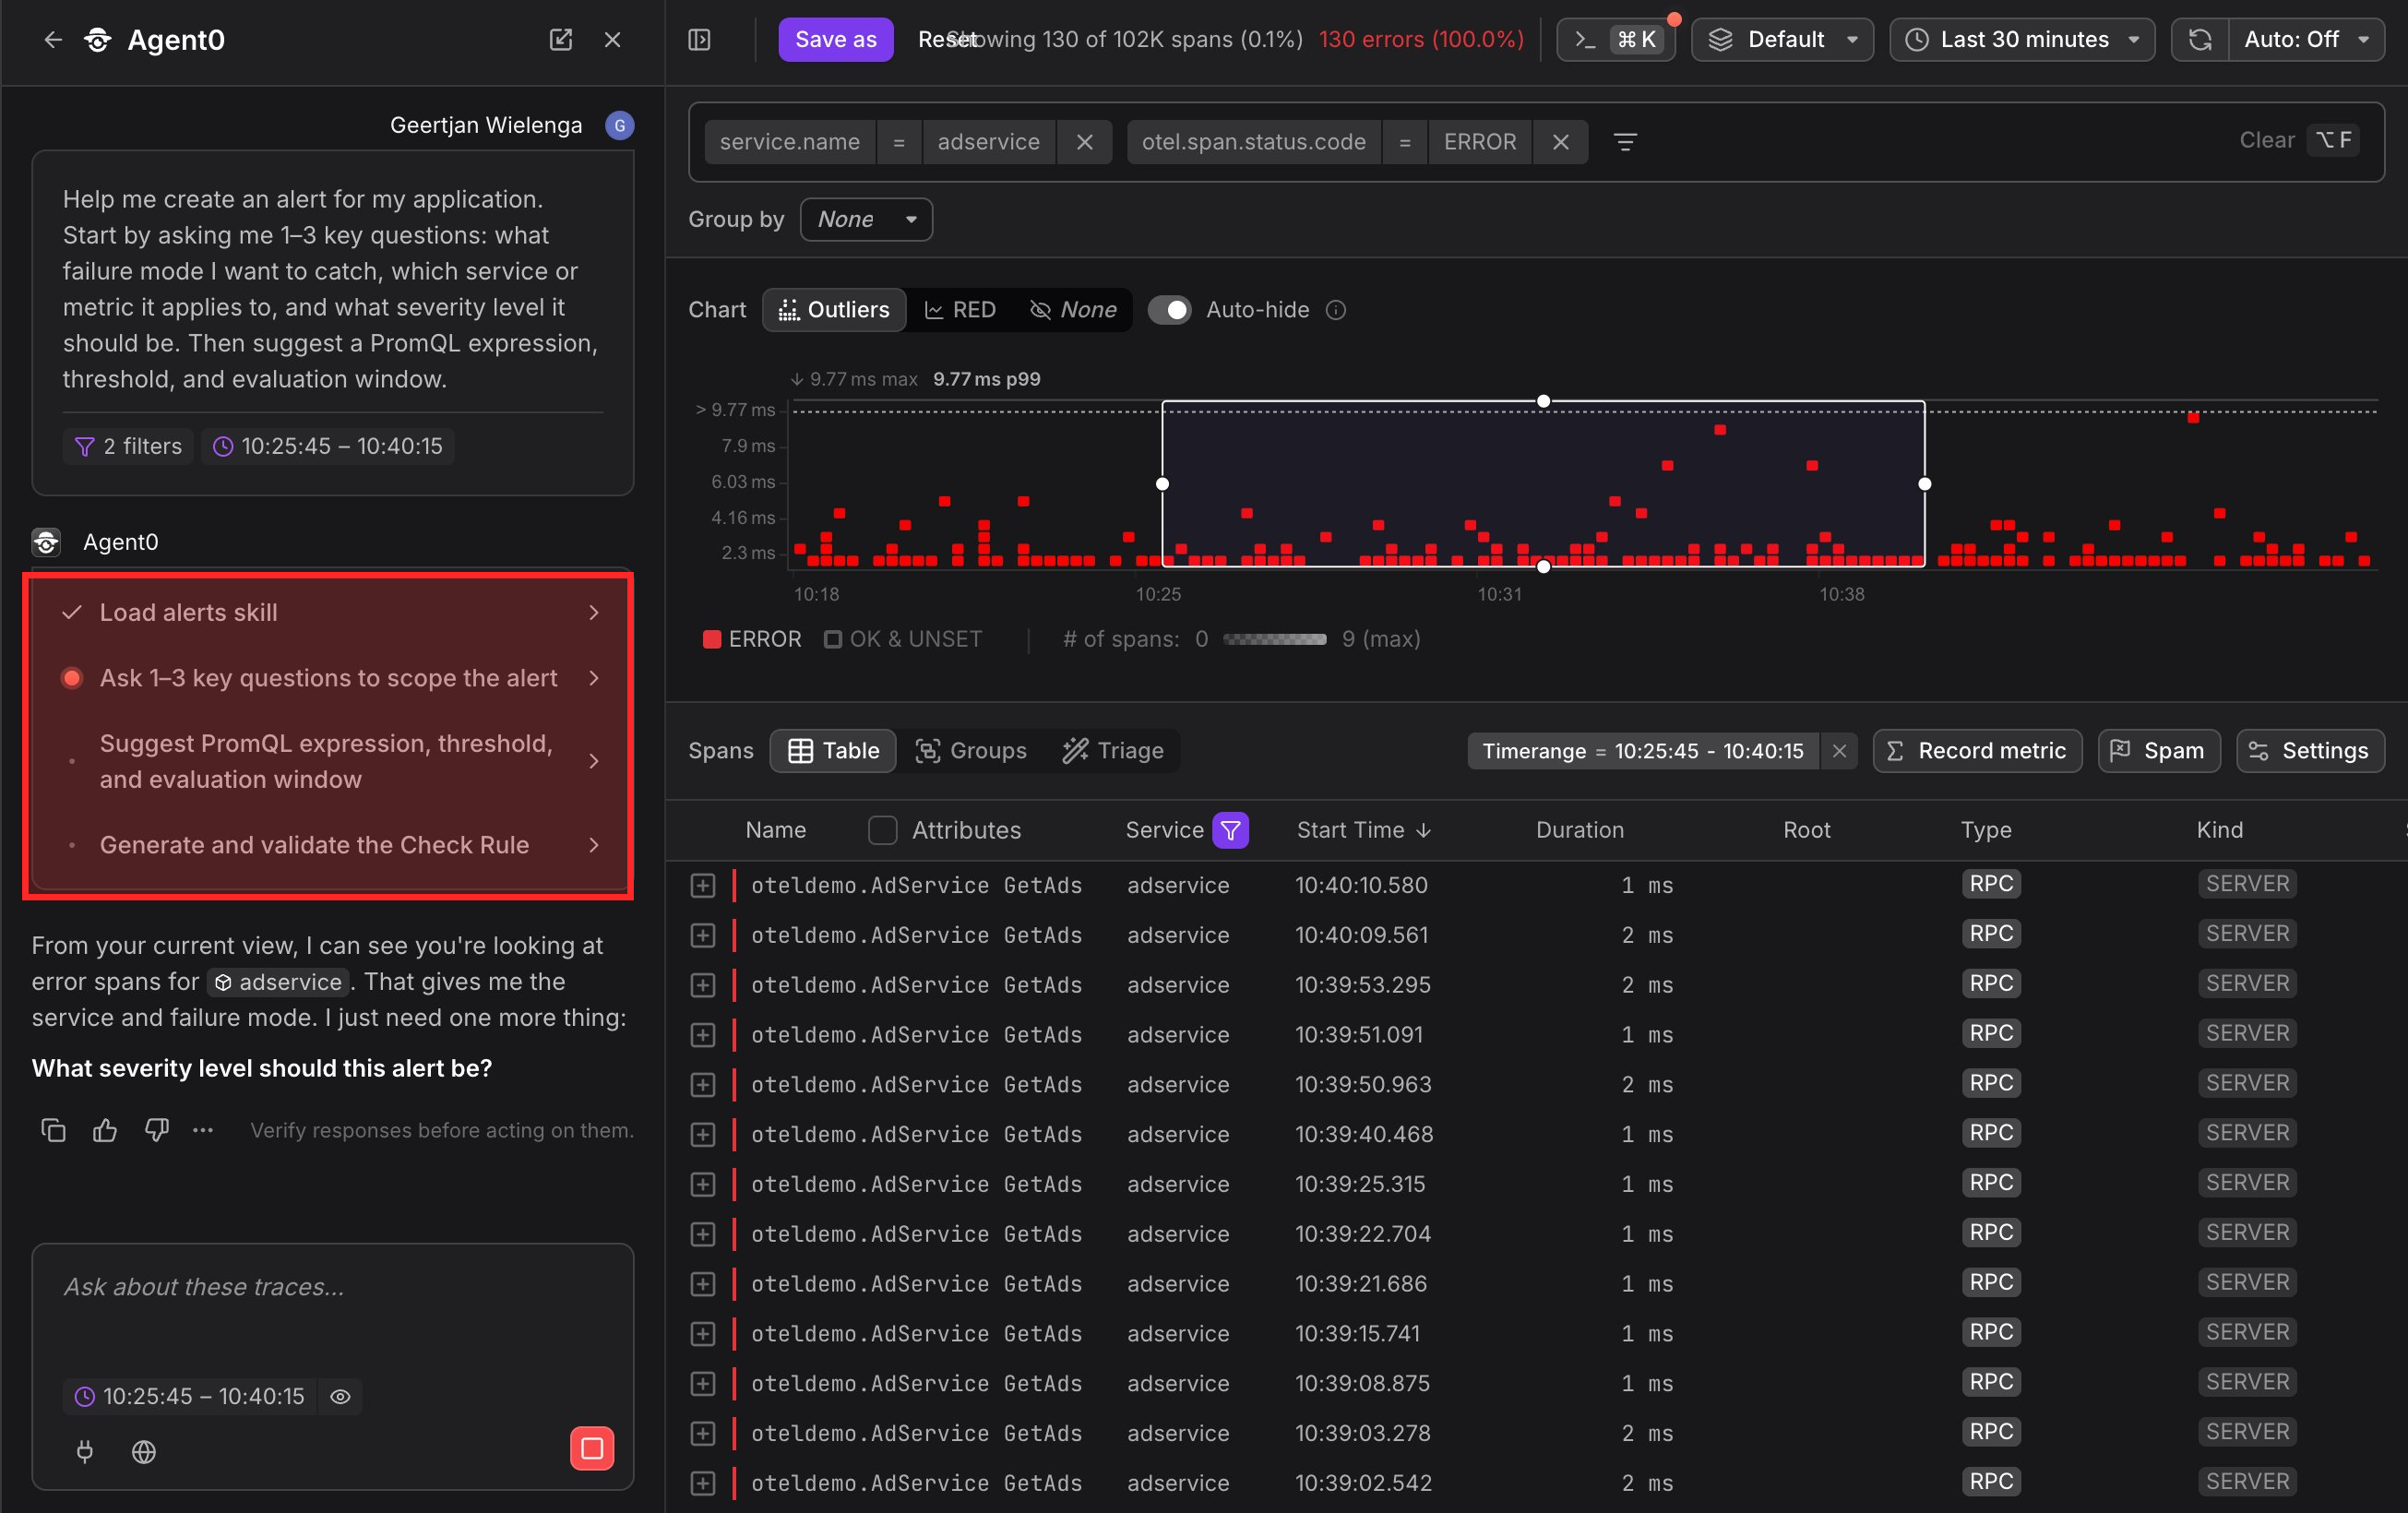
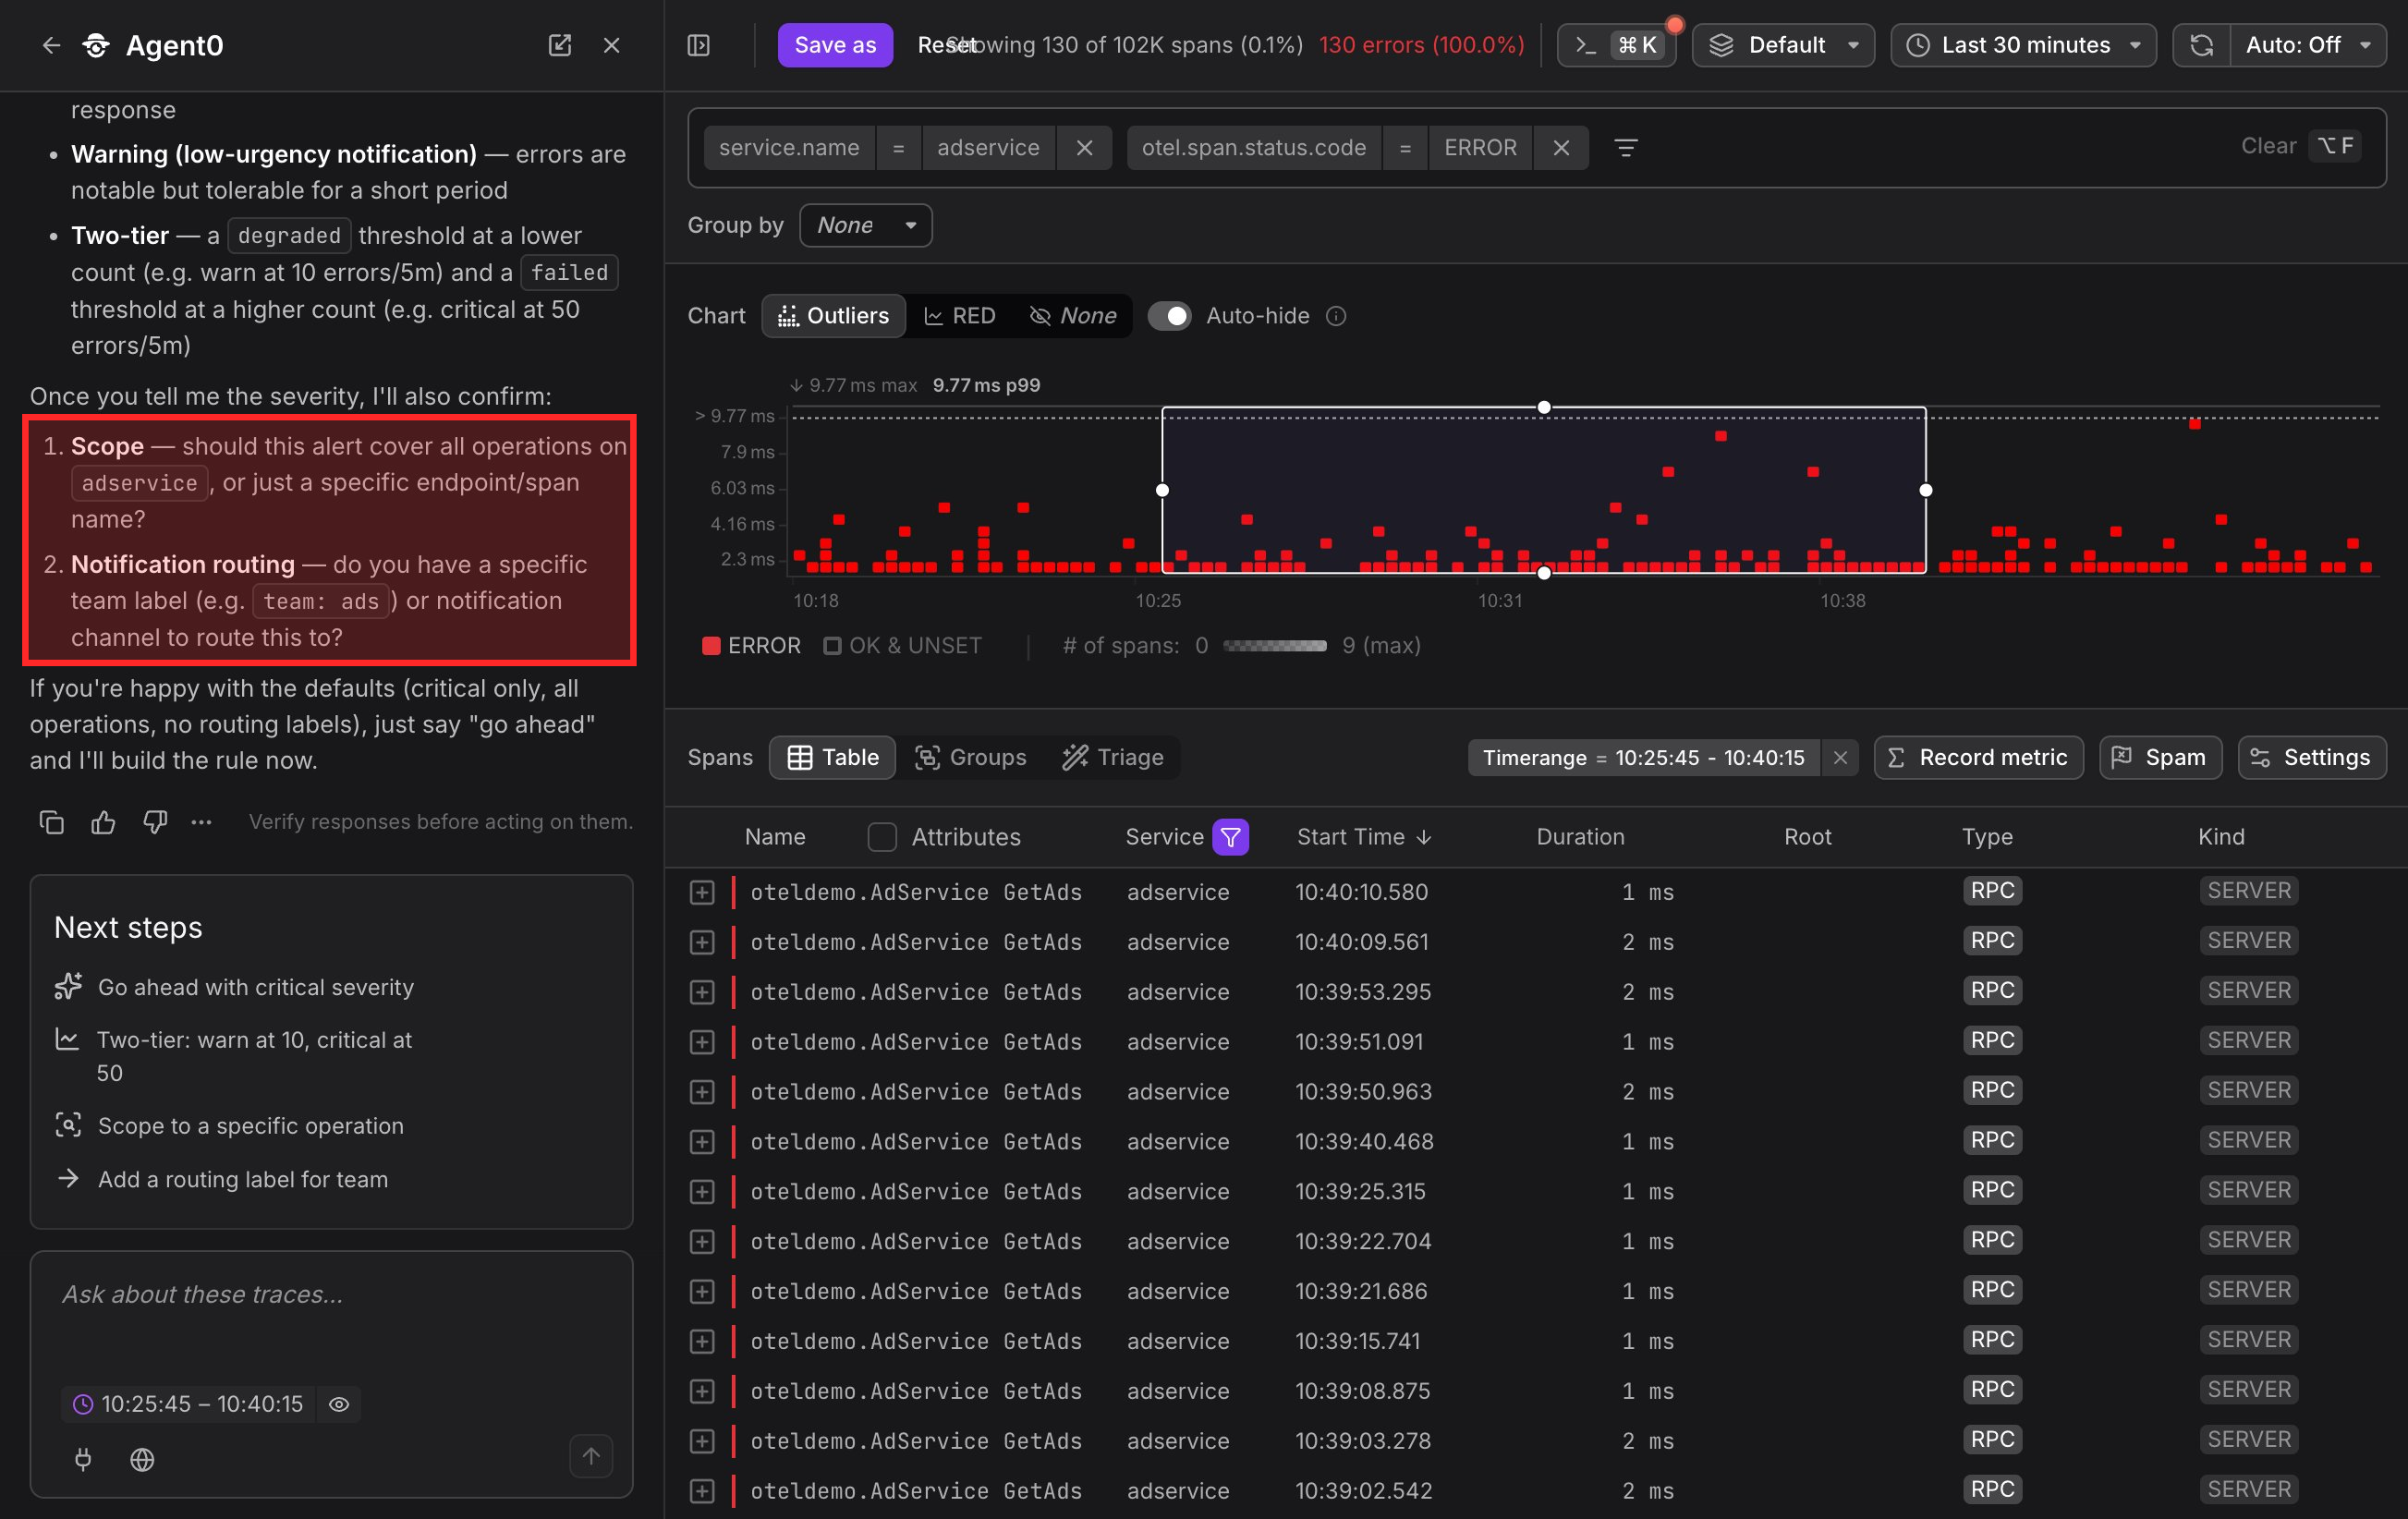
Agent0 provides context about the configuration it will create, including severity levels, notification routing, grace periods, and scope definitions.
Validation Against Existing Rules
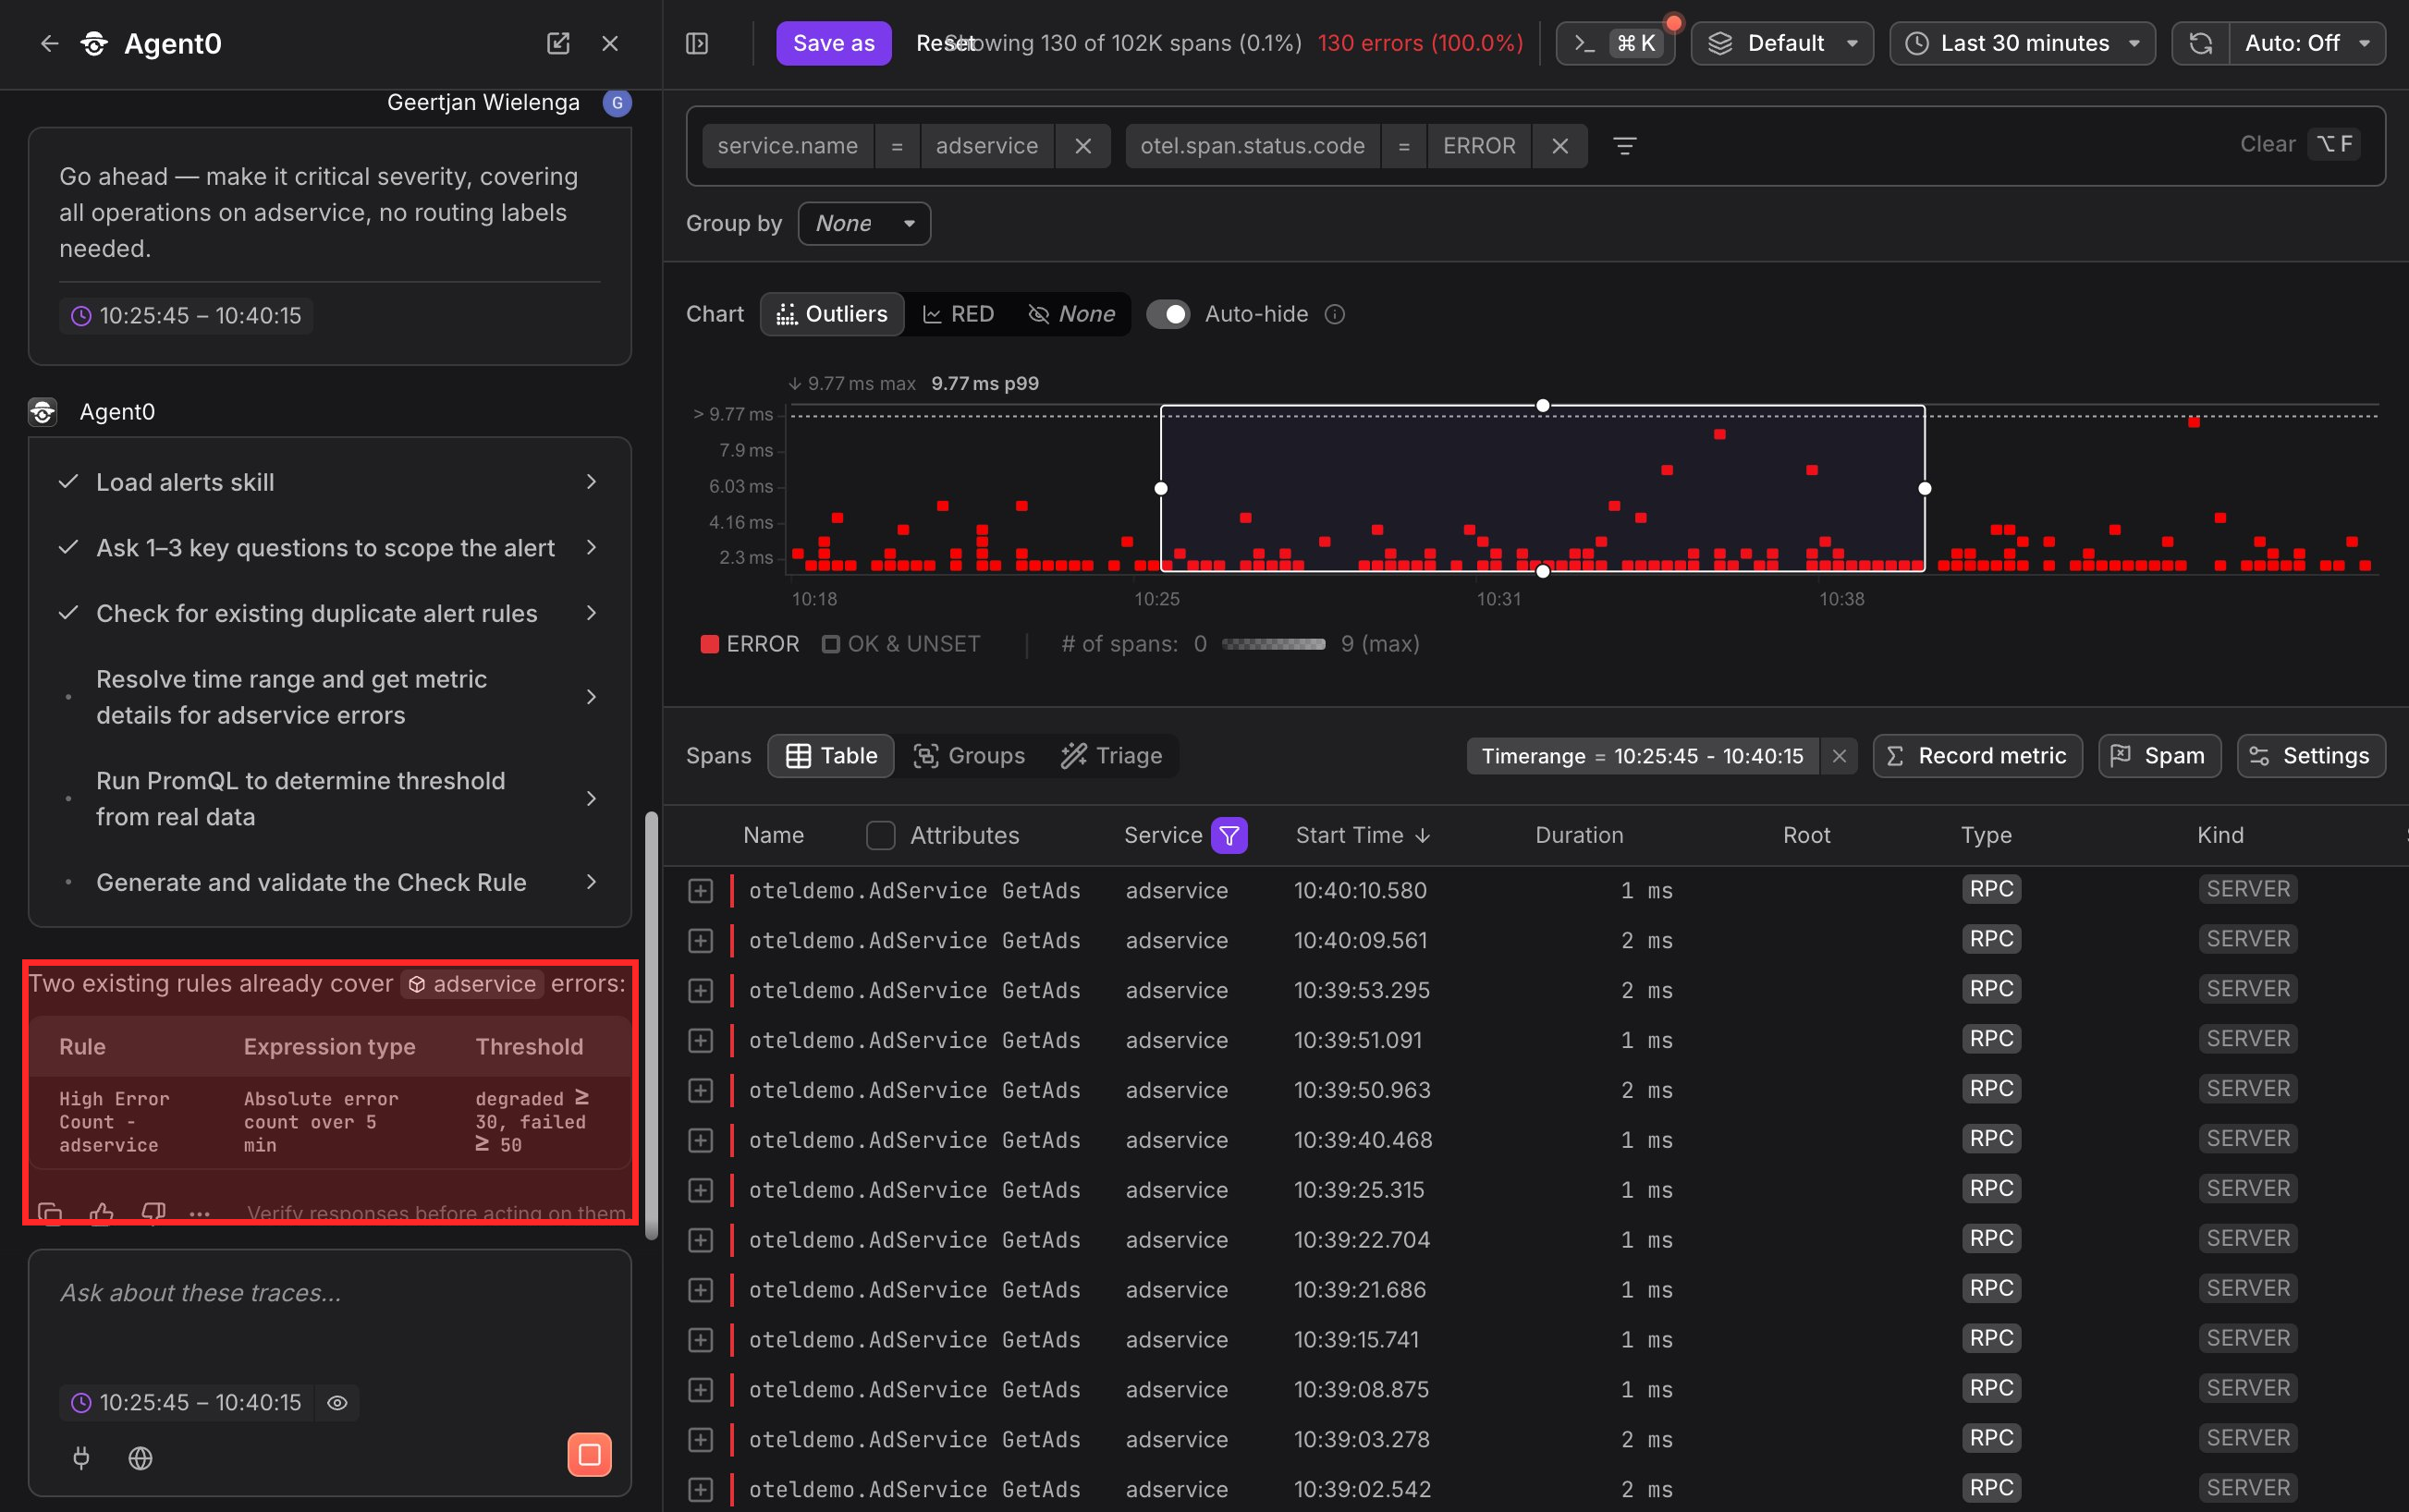
Agent0 checks existing check rules in your dataset to avoid duplicates and ensure consistency with your alerting strategy.
Review the Generated Configuration
Agent0 generates a complete check rule configuration and displays it in the chat. The configuration includes:
- Query — The PromQL expression that monitors your telemetry
- Thresholds — Critical and degraded values
- Grace periods — Evaluation frequency and trigger delays
- Summary and description — Alert message templates with variables
- Notification channels — Suggested channels (if mentioned in prompt)
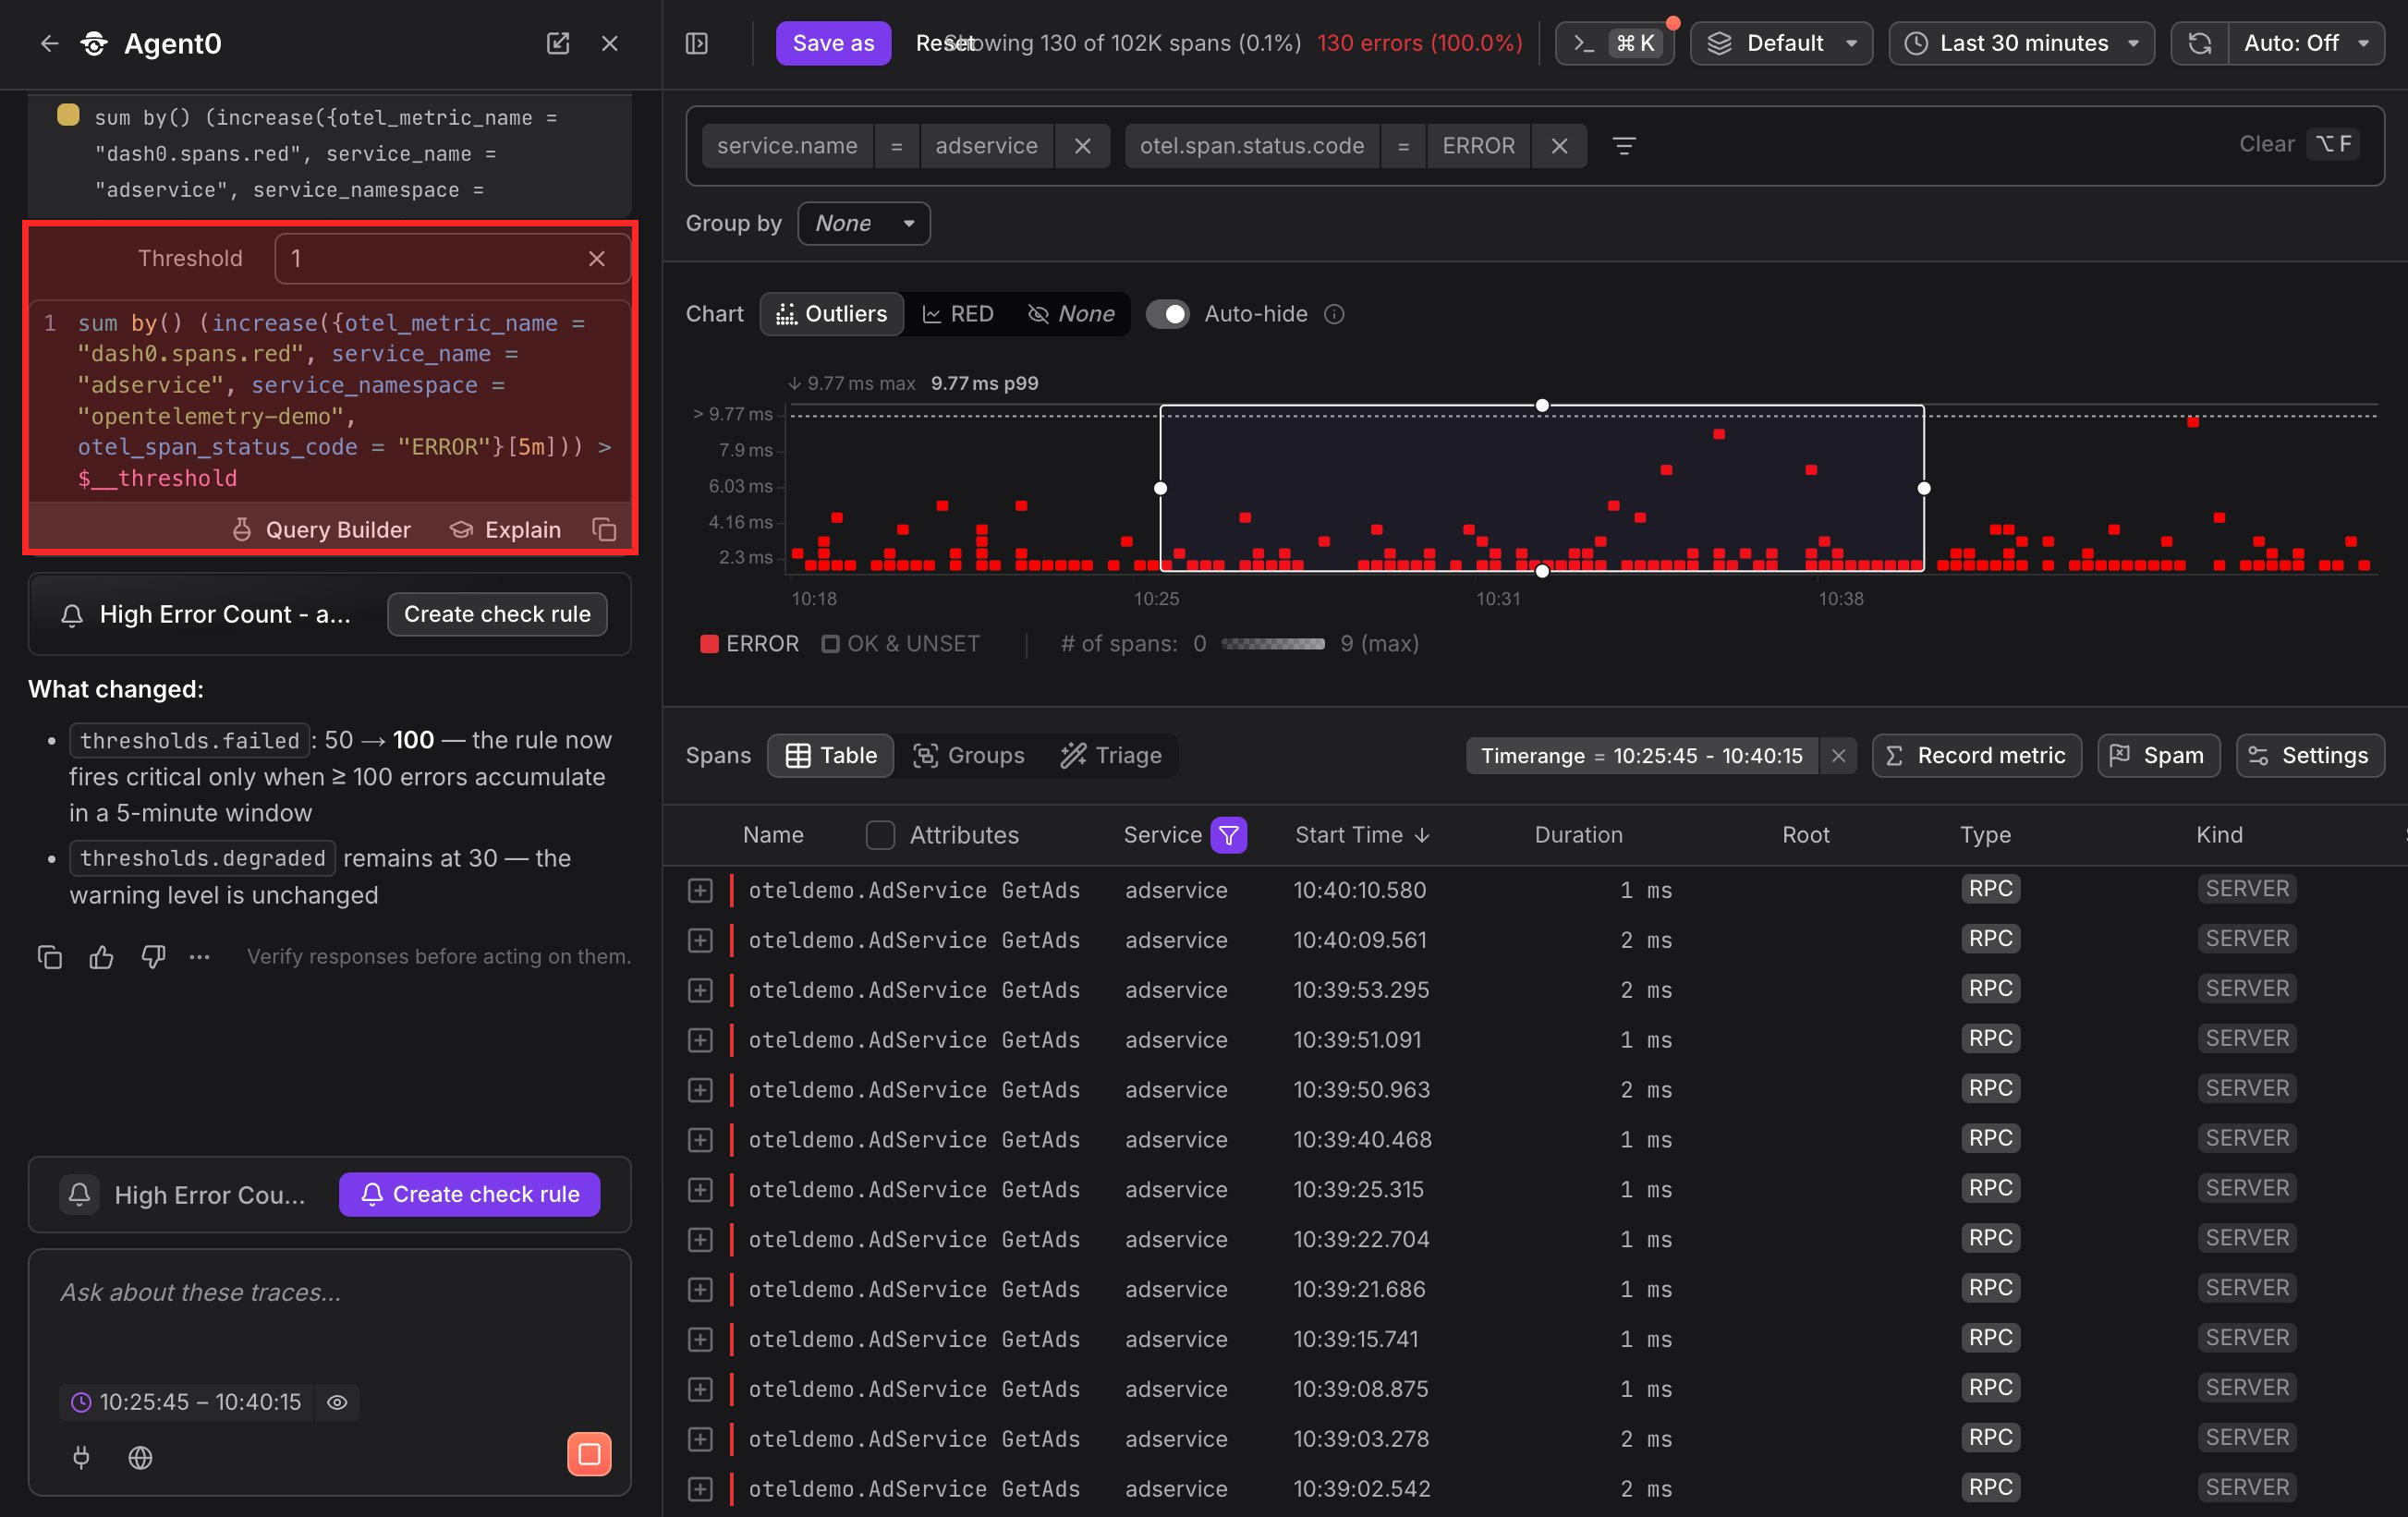
Agent0 shows the PromQL query it generated based on your requirements. You can review the query logic and verify it matches your intent.
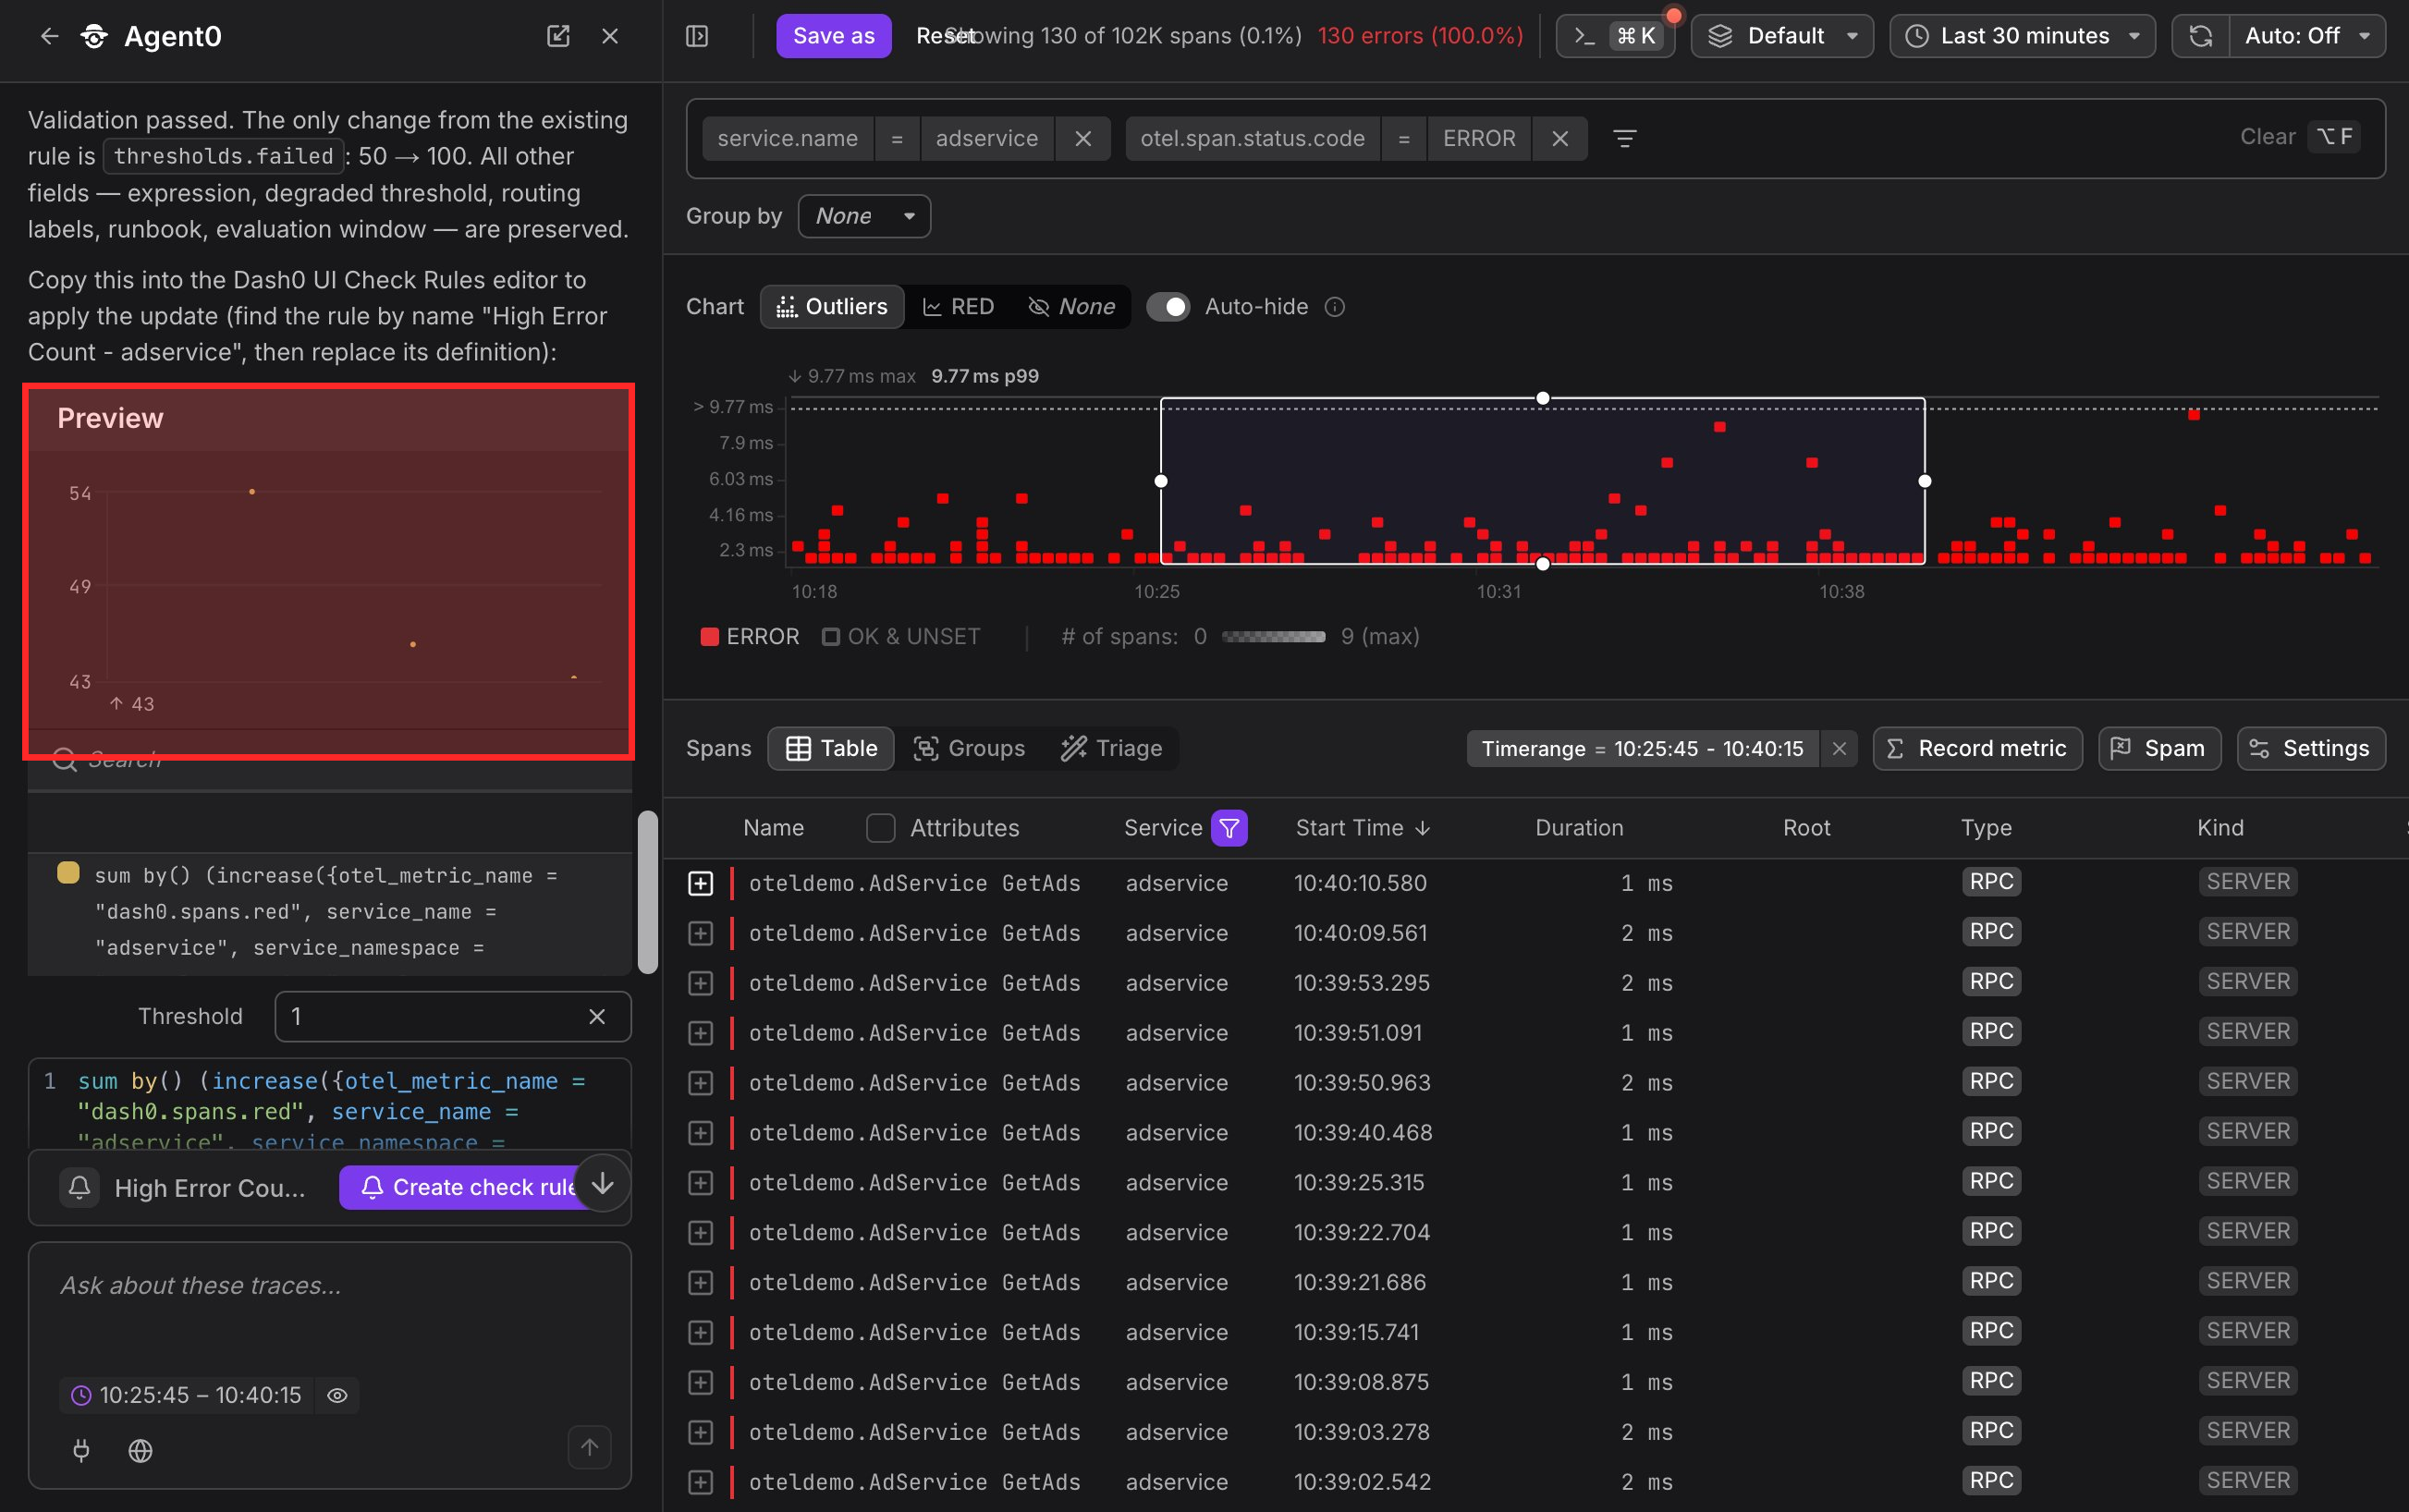
The configuration includes details about what changed, such as the rate calculation window, critical threshold values, and grace periods.
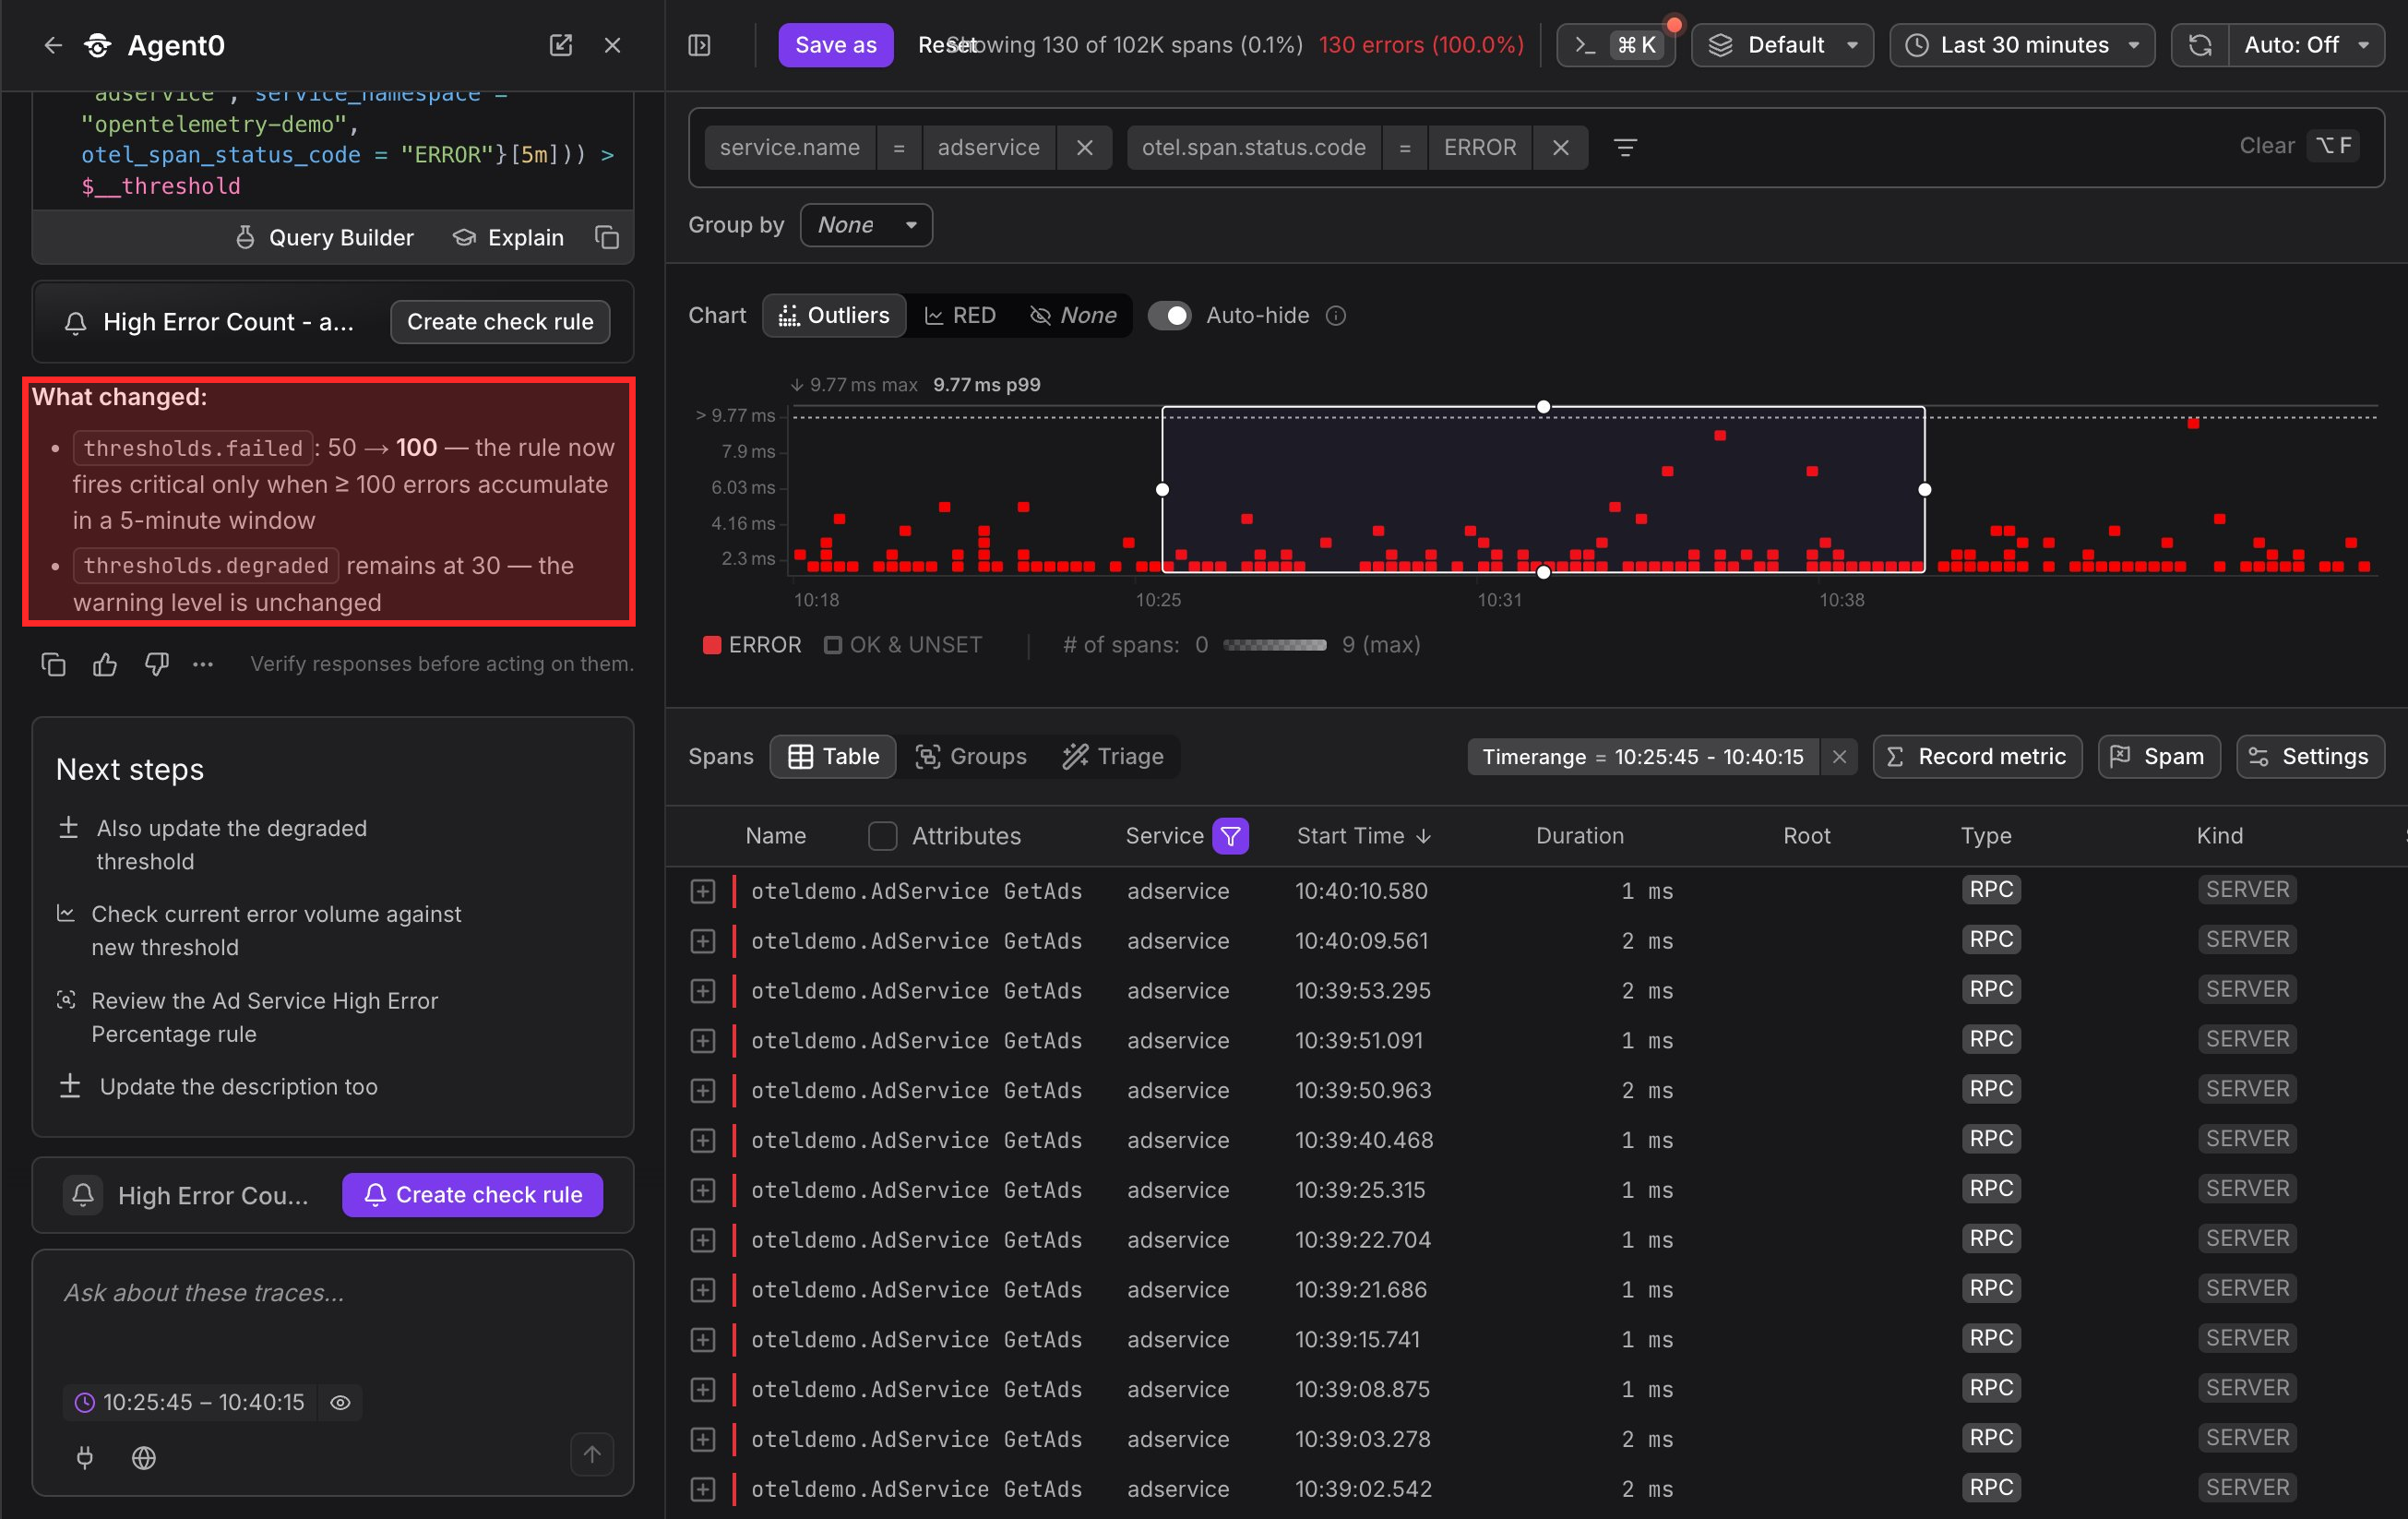
If the generated check rule needs adjustments, iterate with Agent0:
- "Change the critical threshold to 1000ms"
- "Add degraded threshold at 700ms"
- "Also send notifications to PagerDuty for critical alerts"
- "Change the grace period to 2 minutes"
- "Monitor all services, not just frontend"
Save the Check Rule
Once satisfied with the configuration, click Create check rule in the Agent0 response. The check rule editor opens with the query, thresholds, and configuration pre-filled.
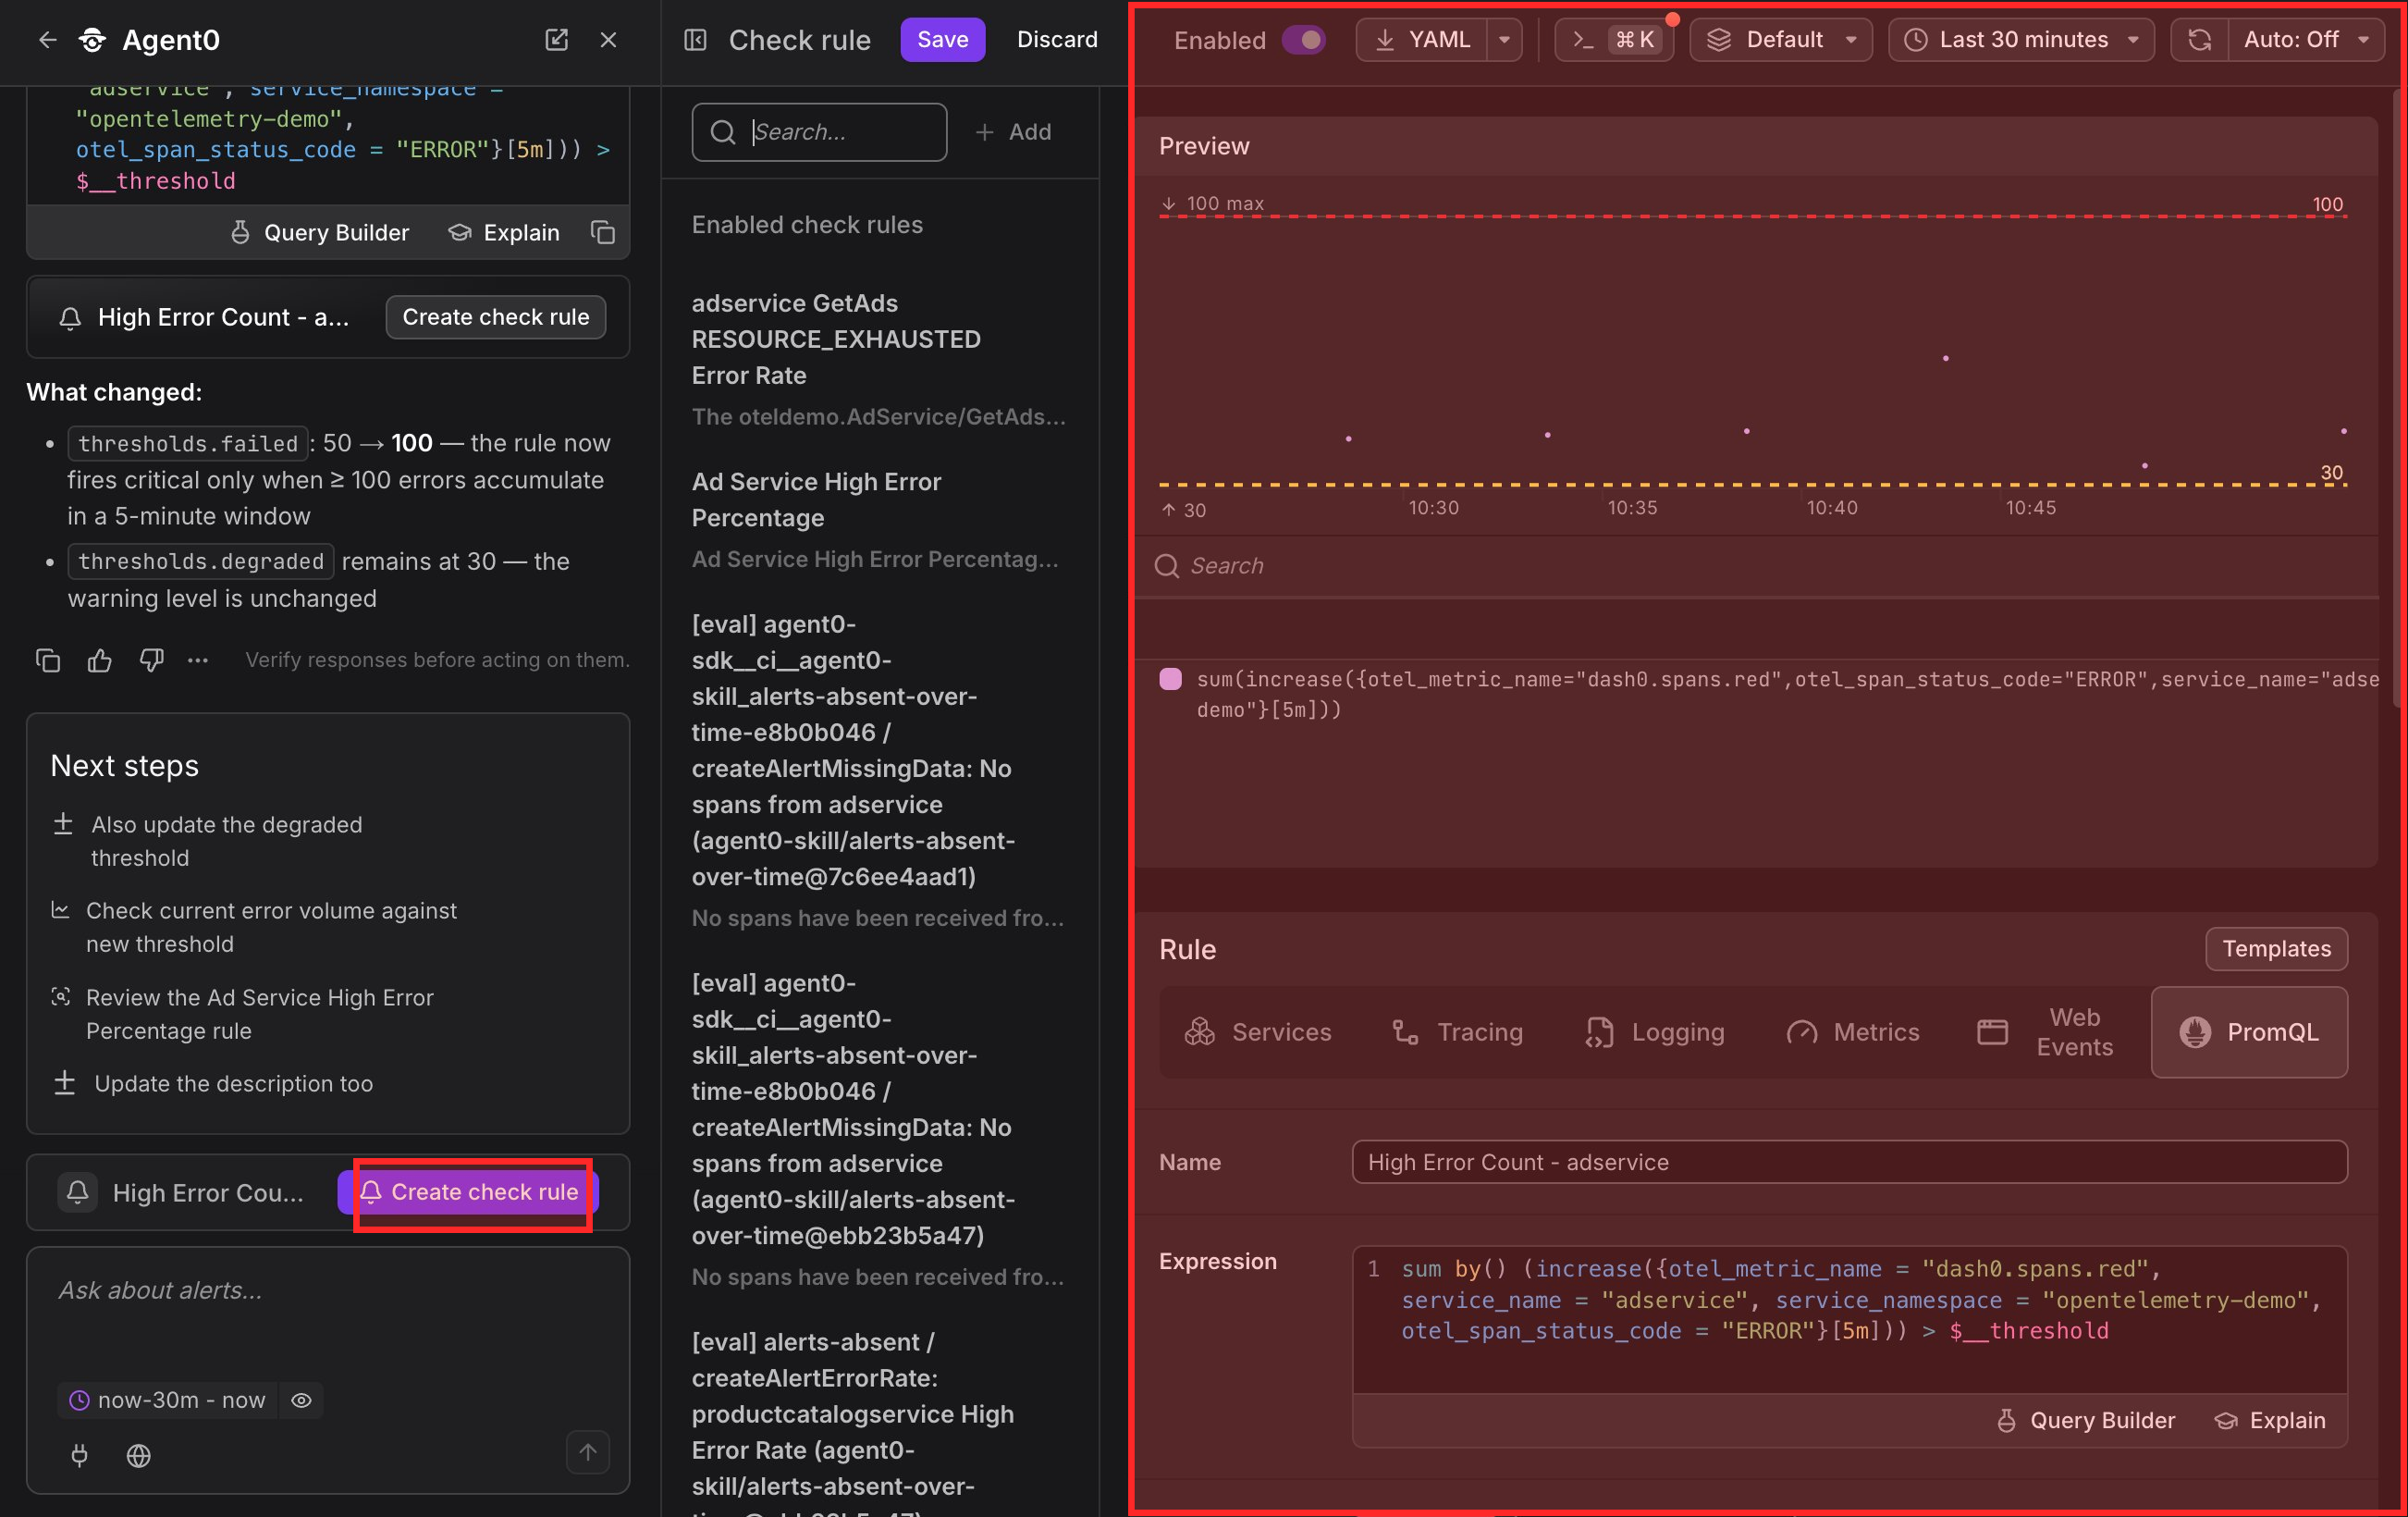
Review the settings and click Save to activate the check rule. The check rule becomes active immediately and begins evaluating at the configured interval.
Further Reading
- About Alert Monitoring — Overview of Dash0's alerting capabilities
- Create Check Rules — All methods for creating check rules
- Investigate Failed Checks — Troubleshoot failed checks
- Create Infrastructure as Code — Export as Terraform or Kubernetes manifests
- Create Pull Requests — Raise IaC configurations as PRs