
Last updated: October 11, 2026
Manage Dashboards as Code
Dashboards are Dash0 assets that can be versioned and managed as infrastructure as code. This approach enables version control, automated deployment pipelines, consistent configuration across environments, and code review for dashboard changes.
Dash0 dashboards use the Perses dashboard format, which provides a Kubernetes-native approach to dashboard configuration.
Agent0 can generate infrastructure-as-code configurations for dashboards and raise them as pull requests to your repository. After creating a dashboard with Agent0, request the corresponding Terraform configuration or Kubernetes manifest to keep your observability in code. See Asset Creation for details.
Dash0 Operator for Kubernetes
Define dashboards as Perses PersesDashboard custom resources that sync to Dash0, enabling workflows and native Kubernetes management.
Example
123456789101112131415161718192021222324252627282930313233343536373839apiVersion: perses.dev/v1alpha1kind: PersesDashboardmetadata:name: service-overviewnamespace: monitoringspec:display:name: Service Overviewdatasources:default:name: defaultplugin:kind: PrometheusDataSourcelayouts:- kind: Gridspec:items:- x: 0"y": 0width: 12height: 6content:$ref: "#/spec/panels/request_rate"panels:request_rate:kind: Panelspec:display:name: Request Rateplugin:kind: TimeSeriesChartspec:queries:- kind: TimeSeriesQueryspec:plugin:kind: PrometheusTimeSeriesQueryspec:query: rate(http_requests_total[5m])
The Dash0 Operator for Kubernetes watches for Perses dashboard resources in namespaces with a Dash0 monitoring resource deployed. When it detects changes:
- New dashboard resources are created as dashboards in Dash0
- Modified resources update the corresponding dashboards
- Deleted resources remove the corresponding dashboards
Apply and Manage
1234567891011121314# Apply the dashboardkubectl apply -f dashboard.yaml# List all dashboardskubectl get persesdashboards -n monitoring# View detailskubectl describe persesdashboard service-overview -n monitoring# Update the dashboardkubectl edit persesdashboard service-overview -n monitoring# Delete the dashboardkubectl delete persesdashboard service-overview -n monitoring
For more information, refer to the Dash0 Operator for Kubernetes documentation.
Dash0 Terraform Provider
Manage dashboards in your Terraform infrastructure alongside other cloud resources for unified infrastructure management.
Example Usage
12345678910111213141516171819202122232425262728293031323334353637383940414243444546474849505152535455565758terraform {required_providers {dash0 = {source = "dash0hq/dash0"version = "~> 1.0"}}}provider "dash0" {url = "https://api.dash0.com"auth_token = "auth_xxxxxxxxxxxxxxxxxxxxxxxxxxxxxxxx"}resource "dash0_dashboard" "service_overview" {dataset = "production"dashboard_yaml = <<-EOTapiVersion: perses.dev/v1alpha1kind: PersesDashboardmetadata:name: service-overviewnamespace: monitoringspec:display:name: Service Overviewdatasources:default:name: defaultplugin:kind: PrometheusDataSourcelayouts:- kind: Gridspec:items:- x: 0"y": 0width: 12height: 6content:$ref: "#/spec/panels/request_rate"panels:request_rate:kind: Panelspec:display:name: Request Rateplugin:kind: TimeSeriesChartspec:queries:- kind: TimeSeriesQueryspec:plugin:kind: PrometheusTimeSeriesQueryspec:query: rate(http_requests_total[5m])EOT}
For more information, see the dash0_dashboard resource documentation.
Dash0 CLI
Script dashboard operations with the Dash0 CLI for automated deployments and batch operations.
Create from File
12# Create a dashboard from a YAML or JSON filedash0 dashboards create -f service-overview.yaml
List Dashboards
12# List all dashboardsdash0 dashboards list
Get Dashboard Details
12345# Get a single dashboard as YAMLdash0 dashboards get <id> -o yaml# Get dashboard details in JSON formatdash0 dashboards get <id> -o json
Update Dashboard
12# Update an existing dashboarddash0 dashboards update <id> -f service-overview-updated.yaml
Delete Dashboard
12# Delete a dashboarddash0 dashboards delete <id>
Batch Operations
1234567# Create multiple dashboards from a directoryfor file in dashboards/*.yaml; dodash0 dashboards create -f "$file"done# Export all dashboards for backupdash0 dashboards list -o yaml > dashboards-backup.yaml
For more information, see the Dash0 CLI command reference.
Direct JSON Editing
Dash0's "Edit as JSON" feature provides direct access to dashboard configurations in JSON format through the web UI. This capability allows for quick edits and experimentation without committing to code.
The JSON editor can be accessed by clicking Edit as JSON in the top-right corner of the dashboard viewer.
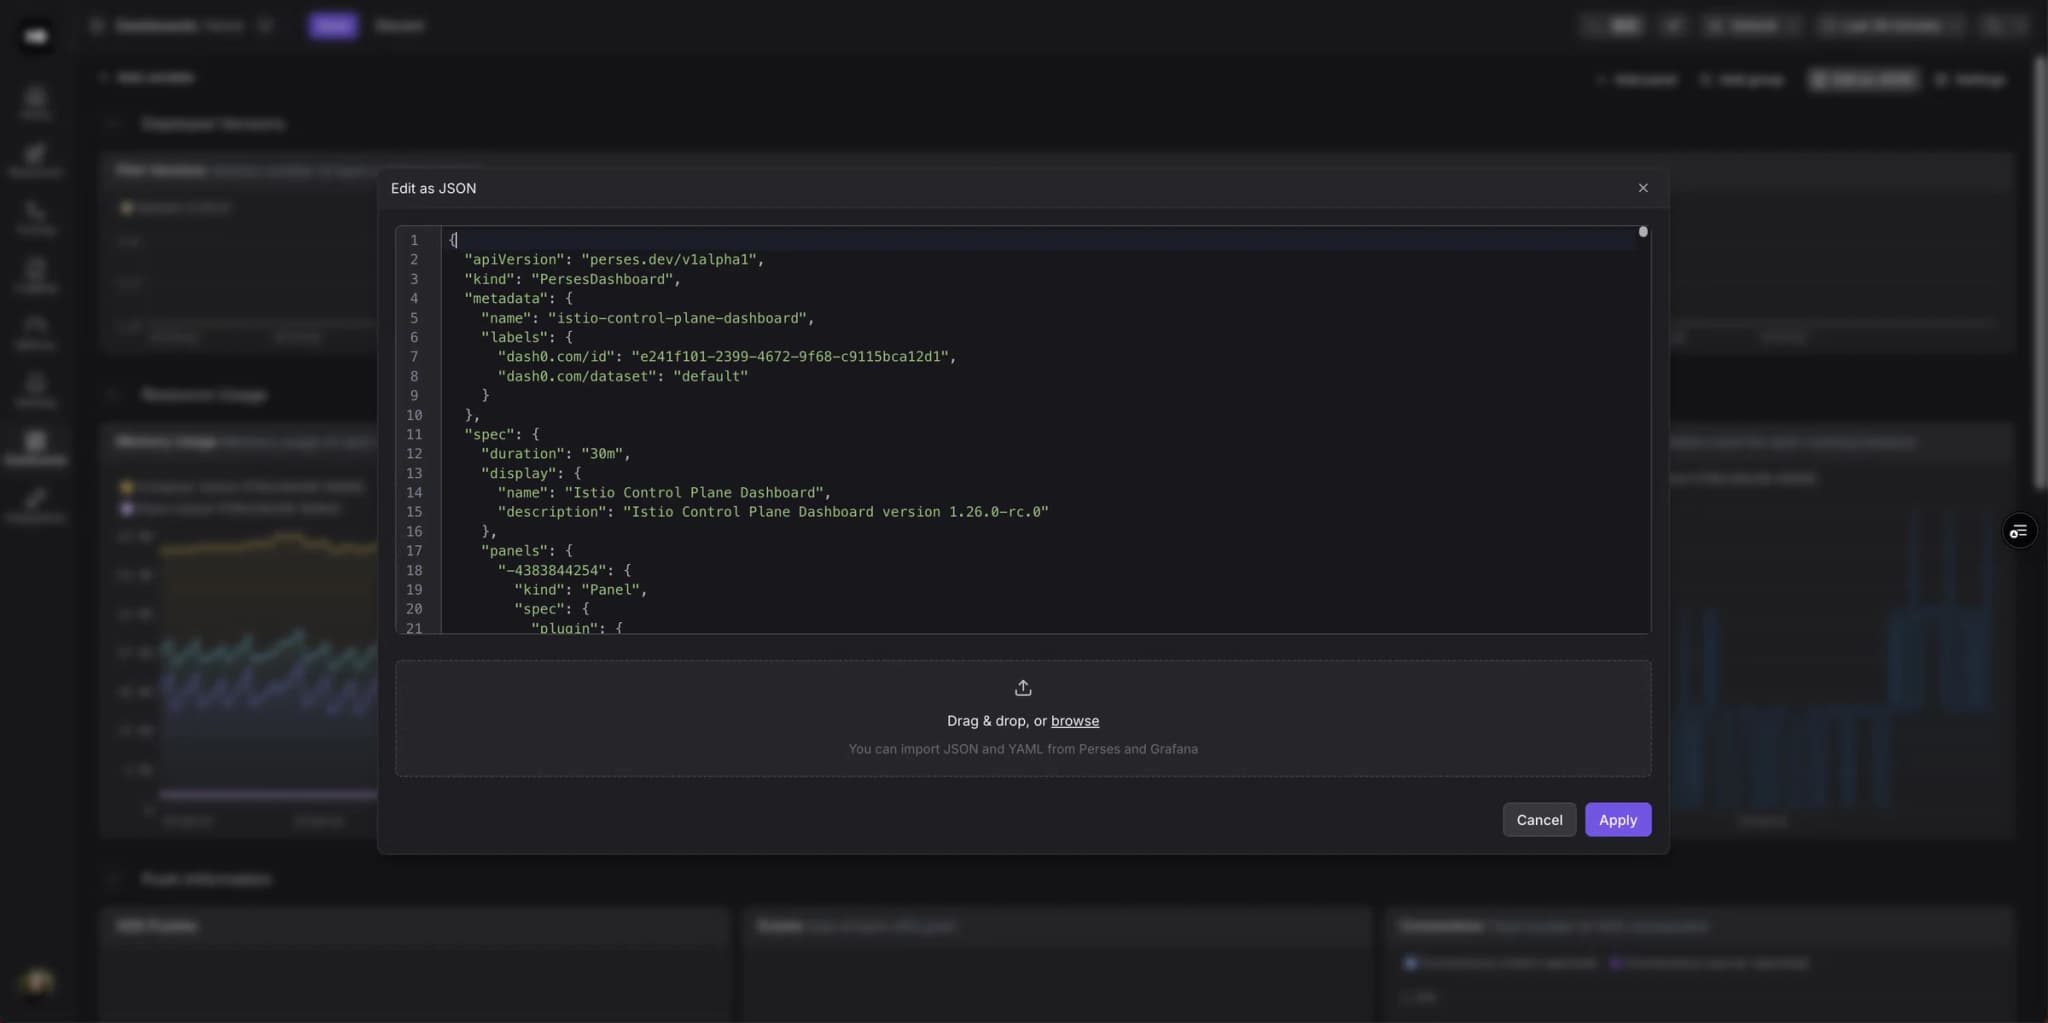
Within the Edit as JSON dialog you can see the dashboard source and modify it directly. Changes are applied immediately when you save.
The JSON editor is convenient for:
- Copying dashboards across organizations and datasets.
- Executing batch modifications across the whole dashboard (e.g., adapting PromQL queries when an attribute key changes).
- Quick prototyping and experimentation with dashboard configurations.
Further Reading
- Manage Views as Code — Manage saved queries as infrastructure as code.
- Manage Check Rules as Code — Define and manage check rules using infrastructure as code.
- Manage Notification Channels as Code — Manage notification channels using infrastructure as code.