- 35 min read
Datadog Competitors in 2026: Pricing Models and OpenTelemetry Compared
Datadog has a meter for how many meters you have. Hosts, indexed logs, custom metric series, and APM all have separate billing dimensions. For an autoscaling fleet with high-cardinality metrics, forecasting the monitoring bill can become an engineering task of its own.
OpenTelemetry doesn't remove the other complication. Datadog accepts OTLP but maps semantic convention attributes into its own model by default. Your instrumentation can be portable while queries, dashboards, and alert rules still need rebuilding.
That leaves two questions worth asking of any competitor: What makes the bill grow, and what survives a move? Nine commercial platforms offer different answers. Open-source stacks remain relevant when self-hosting and operational control matter more than buying a managed platform.
If your primary goal is replacing Datadog rather than comparing the commercial market, see the best Datadog alternatives.
Quick picks
| Tool | Best fit | Pricing model |
|---|---|---|
| Dynatrace | Large estates that want automatic discovery and causal root-cause analysis | Platform subscription rate card: host memory-hours, ingest, retention, and queries |
| New Relic | Teams that want one SaaS database for all telemetry and few billing dimensions | Per GB ingested plus per user (or a compute-based option) |
| Grafana Cloud | Prometheus and Grafana users who want managed open-source backends | Platform fee plus active metric series, GB of logs and traces, and active users |
| Dash0 | Teams standardizing on OpenTelemetry end to end | Per signal unit (span, log record, metric data point), no host or seat fees |
| Elastic Observability | Log-heavy teams that want deployment choice and OTel-native storage | Per GB ingested plus per GB retained (Serverless) |
| Splunk Observability Cloud | Organizations already standardized on Splunk | Host-based bundles, annual billing; logs by daily GB and retention; new editions November 2026 |
| Honeycomb | Developers debugging high-cardinality distributed systems | Event volume plus metric data points in tiers, unlimited seats |
| Cortex XCOR (formerly Chronosphere) | High-scale Kubernetes teams that need aggressive telemetry shaping | Custom consumption contracts |
| Coralogix | Log-heavy teams that want tiered storage and an archive in their own bucket | Prepaid units consumed per GB, priced by storage tier |
| Open source (SigNoz, Grafana stack, Prometheus + Jaeger, ClickStack, VictoriaMetrics) | Teams that must self-host or want full control | Infrastructure plus engineering time; optional managed clouds |
Why teams compare Datadog competitors, and when to stay
How Datadog's pricing model grows
Datadog products use different billing units, often with separate commitments. A deployment using infrastructure monitoring, APM, and logs can trigger several meters at once:
- Infrastructure is billed per host, metered hourly, under one of two plans (billing plans). The high-watermark plan bills on "the maximum count (high-water mark) of the lower 99%" of hourly readings, so a scale-up that lasts longer than about 1% of the month sets the host count for the whole month. The hybrid monthly/hourly plan sets a monthly minimum commitment and bills host hours above it at an hourly rate, which Datadog suggests for autoscaling fleets. On either plan, if the Agent runs inside each container rather than once per node, each container counts as a host.
- Containers above the per-host allotment are billed separately (container billing).
- APM is billed per APM host, plus ingested span volume and indexed spans beyond the per-host allotments.
- Logs are billed once per GB ingested and again per million events indexed, at a rate that depends on the retention tier (pricing list).
- Custom metrics are billed per time series. Datadog defines a custom metric as "a combination of a metric name and tag values (including the host tag)" (custom metrics billing). A new tag with ten independent values can multiply a metric's series count up to tenfold. A tag that's constant per host, or that tracks an existing tag, adds few or none. Datadog also offers an alternative Metric Name pricing model that "bills based on metric names and datapoint volume" instead of unique series.
- RUM, Session Replay, Synthetics, Database Monitoring, and the Bits AI agents each have their own unit: sessions, test runs, database hosts, and AI credits.
These meters move independently. Short-lived hosts and higher-cardinality tags can increase the bill even if the amount of useful telemetry hasn't changed. An autoscaling event is enough to make host-count-based pricing behave very differently from volume-based pricing.
How Datadog handles OpenTelemetry
Datadog accepts OpenTelemetry data through the DDOT Collector embedded in its Agent (the recommended path), through the upstream Collector with the Datadog exporter, or as OTLP sent directly to its intake (OpenTelemetry in Datadog). Whichever path you take, Datadog maps OTel data to Datadog conventions by default (semantic mapping). service.name becomes service, deployment.environment.name becomes env, and k8s.namespace.name becomes kube_namespace. Resource attributes without a mapping are dropped from metric tags unless you enable an option that Datadog warns "can significantly increase tag cardinality." Continuous Profiler, App and API Protection, and Data Streams Monitoring still need Datadog's own SDK, and Database Monitoring isn't available through the upstream Collector or direct OTLP (compatibility). OTel application metrics that don't map to a Datadog integration are billed under the custom-metric model.
Datadog has introduced OTel-native views for infrastructure and APM and native OTel RED metrics, both in Preview (Datadog announcement). The default ingestion model still translates OpenTelemetry conventions into Datadog's schema. Preview features don't undo that dependency yet.
When Datadog is still the right choice
Datadog has more than 1,000 built-in integrations, APM, and products covering Cloud SIEM, code security, network performance, database monitoring, and mobile RUM. If you rely on several of those products together, replacing Datadog can mean operating three vendors instead of one. That is not automatically cheaper or simpler.
Staying makes sense if you use that breadth and can control costs with tag discipline, Flex Logs, and Metrics without Limits. If host counts and metric cardinality are forcing awkward compromises, or if OpenTelemetry portability is a priority, compare the underlying billing and data models before negotiating the next contract.
What to evaluate in a Datadog competitor
Compare pricing and OpenTelemetry handling first. Then verify signal coverage, deployment constraints, and migration effort against the systems you actually run.
Pricing model. Decide what your bill should grow with before comparing unit prices. Host pricing tracks machine count, including autoscaling and short-lived nodes. Per-series pricing responds to cardinality; per-user pricing turns access into a budget decision; scan-based pricing increases with the queries you run, including during incidents. Per-GB and per-signal-unit pricing tracks telemetry volume, which can be shaped with sampling and filtering but can also spike during an error storm. Commitments, retention, collection frequency, and included allowances change the calculation.
OpenTelemetry handling. OpenTelemetry standardizes instrumentation and transport, not storage, querying, or dashboards. Check what each backend does after receiving OTLP:
- Attribute names after ingest. Do semantic convention names such as
service.nameandk8s.pod.namesurvive storage, or are they renamed? Grafana Loki converts dots to underscores, soservice.namebecomesservice_name, and Prometheus's OTLP receiver escapes metric names and adds unit suffixes by default (Prometheus OTel guide). - Query language. An open language such as PromQL makes skills and some queries transferable. A proprietary one such as NRQL, DQL, SignalFlow, or DataPrime ties your saved queries to that vendor. An open language doesn't guarantee portability on its own, because queries can still depend on platform-specific metrics or naming.
- Configuration format. Can dashboards and alerts live in Git, and in a format another tool can read?
- Collection. Does the platform expect its own agent, or does it work with a standard or vendor-neutral OpenTelemetry Collector?
| Platform | OTel attribute names after ingest | Query language(s) |
|---|---|---|
| Datadog | Mapped to Datadog conventions by default; OTel-native views in Preview | Datadog's own |
| Dynatrace | Stored in Grail; fields that OneAgent fills automatically must be enriched by hand for direct OTLP | DQL |
| New Relic | Mapped into New Relic's event and entity model | NRQL |
| Dash0 | Semantic convention names kept and migrated automatically; PromQL exposes attributes with underscores (service_name) | PromQL across signals, plus SQL |
| Grafana Cloud | Loki converts to underscores; metrics converted to Prometheus naming; Tempo keeps OTel names | PromQL, LogQL, TraceQL, profiling query language |
| Elastic | Managed OTLP endpoint keeps the OTel data model (not available self-managed) | ES|QL, KQL |
| Splunk Observability Cloud | Metrics stored in the SignalFx metric time series model | SignalFlow; SPL for logs |
| Honeycomb | OTel-first ingest | Honeycomb query builder |
| Cortex XCOR | Resource attributes mapped to Prometheus labels | Prometheus-compatible |
| Coralogix | Accepts OTLP and Prometheus remote-write | DataPrime (logs, spans), PromQL (metrics) |
Coverage and migration. Check required signals, integrations, and deployment options: SaaS, bring-your-own-cloud (BYOC), or self-hosted. OTLP compatibility helps you move collection; it won't recreate your dashboards, monitors, and runbooks.
Pricing models compared
A low unit rate means little until you know what counts as a unit. The table shows the billing triggers and what each platform meters separately. Confirm current rates and contract terms with the vendor.
| Platform | Billing unit(s) | What makes the bill grow | Metered separately |
|---|---|---|---|
| Datadog (baseline) | Per host, per APM host, per GB and per million indexed log events, per custom metric series (or per metric name and data-point volume) | Host high-water mark or hourly overage above a commitment, containers, span volume, log indexing and retention tier, tag cardinality | RUM sessions, replay, synthetic runs, DB hosts, AI credits |
| Dynatrace | Platform subscription rate card drawn down from an annual commit | Host memory-hours, pods, GiB ingested and retained, GiB scanned by queries | RUM sessions, synthetic actions, AppSec per host, AI units |
| New Relic | Per GB ingested plus per user (or compute-based capacity) | Data volume and number of full-platform users | Advanced Compute for AI features |
| Dash0 | Per span, log record, web event, or metric data point, split into ingestion and storage; per synthetic check run | Signals ingested, plus storage for the signals kept | Agent0 credits; no host, seat, or base fee for the core platform |
| Grafana Cloud | Platform fee plus usage | Active metric series, GB of logs, traces, and profiles, active users | Kubernetes and app monitoring per host-hour, frontend sessions, IRM and AI assistant per user |
| Elastic (Serverless) | Per GB ingested plus per GB-month retained | Data volume and retention | Egress, synthetics, LLM tokens |
| Splunk Observability Cloud | Per host in bundles, billed annually | Host count; some products by metric time series or sessions | Observability Logs per GB of daily volume, priced by retention period; new editions from November 2026 |
| Honeycomb | Event volume plus metric data points per month, in tiers | Number of events (spans, logs) and metric data points | Telemetry pipeline; seats and queries unlimited |
| Cortex XCOR | Custom consumption-based contracts | Negotiated capacity | Not public |
| Coralogix | Prepaid units consumed per GB | Volume, by signal and by storage tier | Archive lives in your own S3 |
- If you run many short-lived hosts, containers, or spot instances, host-based models are the riskiest. Volume-based models don't count machines, though they still grow with what those machines emit.
- If your metrics carry rich labels, per-series pricing (Datadog custom metrics, Grafana active series) grows directly with cardinality. Per-data-point pricing has no separate active-series charge, but cardinality still raises the number of points emitted: at one sample per minute, 1,000 continuously reported series produce 43.2 million points in 30 days, and 10,000 produce 432 million. Per-GB pricing grows with serialized volume, so larger attributes cost more.
- If logs dominate your volume, look for tiered storage or cheap archives (Elastic, Coralogix) and avoid paying separately to ingest and to index.
- Per-user pricing can make broad engineering access expensive. Honeycomb and Dash0 have no observability seat fee.
Leading commercial Datadog competitors
1. Dynatrace
Dynatrace is a close enterprise-scale alternative to Datadog. OneAgent discovers applications and infrastructure automatically, Smartscape builds a topology, and Davis AI uses it for root-cause analysis.
How it handles OpenTelemetry: Dynatrace ingests OTLP over HTTP, and its docs recommend exporting OTLP directly "for most use cases" (OneAgent and OpenTelemetry). Data lands in Grail and is queried with the proprietary Dynatrace Query Language (DQL). Data sent directly or through a Collector must be enriched by hand to populate the primary fields that OneAgent fills automatically (OTel primary tags), which pulls you toward OneAgent.
Pricing model: the Dynatrace Platform Subscription is a rate card drawn down from a minimum annual commit. Full-stack hosts are billed by memory-GiB-hour. Logs and traces carry three separate charges: ingest, retention, and query (GiB scanned).
Trade-offs: Query charges mean incident investigations can affect the bill, not just telemetry ingestion. DQL and Dynatrace's data model require retraining. Its self-hosted Managed edition is an option if SaaS is off the table.
See also: Datadog vs Dynatrace and Dynatrace alternatives.
2. New Relic
New Relic puts APM, infrastructure, logs, browser, mobile, synthetics, and profiling data into NRDB, with NRQL as the query language.
How it handles OpenTelemetry: New Relic calls native OTLP "the preferred method" for sending OTel data (OTLP docs). Data is mapped into New Relic's event and entity model and queried with NRQL, a proprietary SQL-like language. New Relic also still ships and promotes its own language agents.
Pricing model: Data ingested per GB plus user seats by type. Full-platform seats add cost as access spreads across engineering. A compute-based alternative without user fees is priced through sales; AI features use the Advanced Compute add-on. A free tier includes a monthly data allowance and one full-platform user.
Trade-offs: Seat billing makes broad access a cost decision. NRQL is proprietary, and deployment is SaaS-only.
See also: Datadog vs New Relic and New Relic alternatives.
3. Grafana Cloud
Grafana Cloud runs Mimir for metrics, Loki for logs, Tempo for traces, and Pyroscope for profiles, with Grafana across them. It also includes frontend observability, synthetics, k6 load testing, incident response, and an AI assistant.
How it handles OpenTelemetry: the OTLP gateway is the recommended ingest path, and Alloy, Grafana's OpenTelemetry Collector distribution, is Apache-2.0 licensed. You query with open languages, but there are four of them. Attribute names don't always survive: Loki turns service.name into service_name, and OTel metrics are converted to Prometheus naming.
Pricing model: a monthly platform fee plus usage. Metrics are billed per 1,000 active series, so cardinality is the main cost lever. Logs, traces, and profiles are billed per GB for processing, writing, and retention. Users are billed per active user, and add-ons such as Kubernetes monitoring, application observability, incident response, and the AI assistant have their own units. A free tier is available.
Trade-offs: A high-cardinality label multiplies active metric series, while cross-signal correlation depends on how four separate backends have been configured. Being built from open-source components doesn't make it one system to operate.
See also: Grafana vs Datadog and Grafana alternatives.
4. Dash0
Dash0 stores telemetry using the OpenTelemetry data model rather than remapping it into a proprietary schema. It preserves semantic convention names and applies schema migrations when conventions change, for example from http.status_code to http.response.status_code. Logs, metrics, traces, and web events share one store and retain their resource context, allowing a slow span to be correlated with logs and metrics from the same pod. PromQL works across signals, with SQL also available. Dashboards use the CNCF Perses format; alerts use Prometheus rules. Both can be managed through Kubernetes custom resources, Terraform, or a CLI. The open-source Dash0 Kubernetes operator instruments workloads and exports standard OTLP to compatible backends.
Open formats reduce migration work; they don't erase it. Queries relying on Dash0's synthetic metrics over spans and logs, and other Dash0-specific features, need equivalents at the destination. Agent0 investigates across those signals and can draft pull requests for human review.
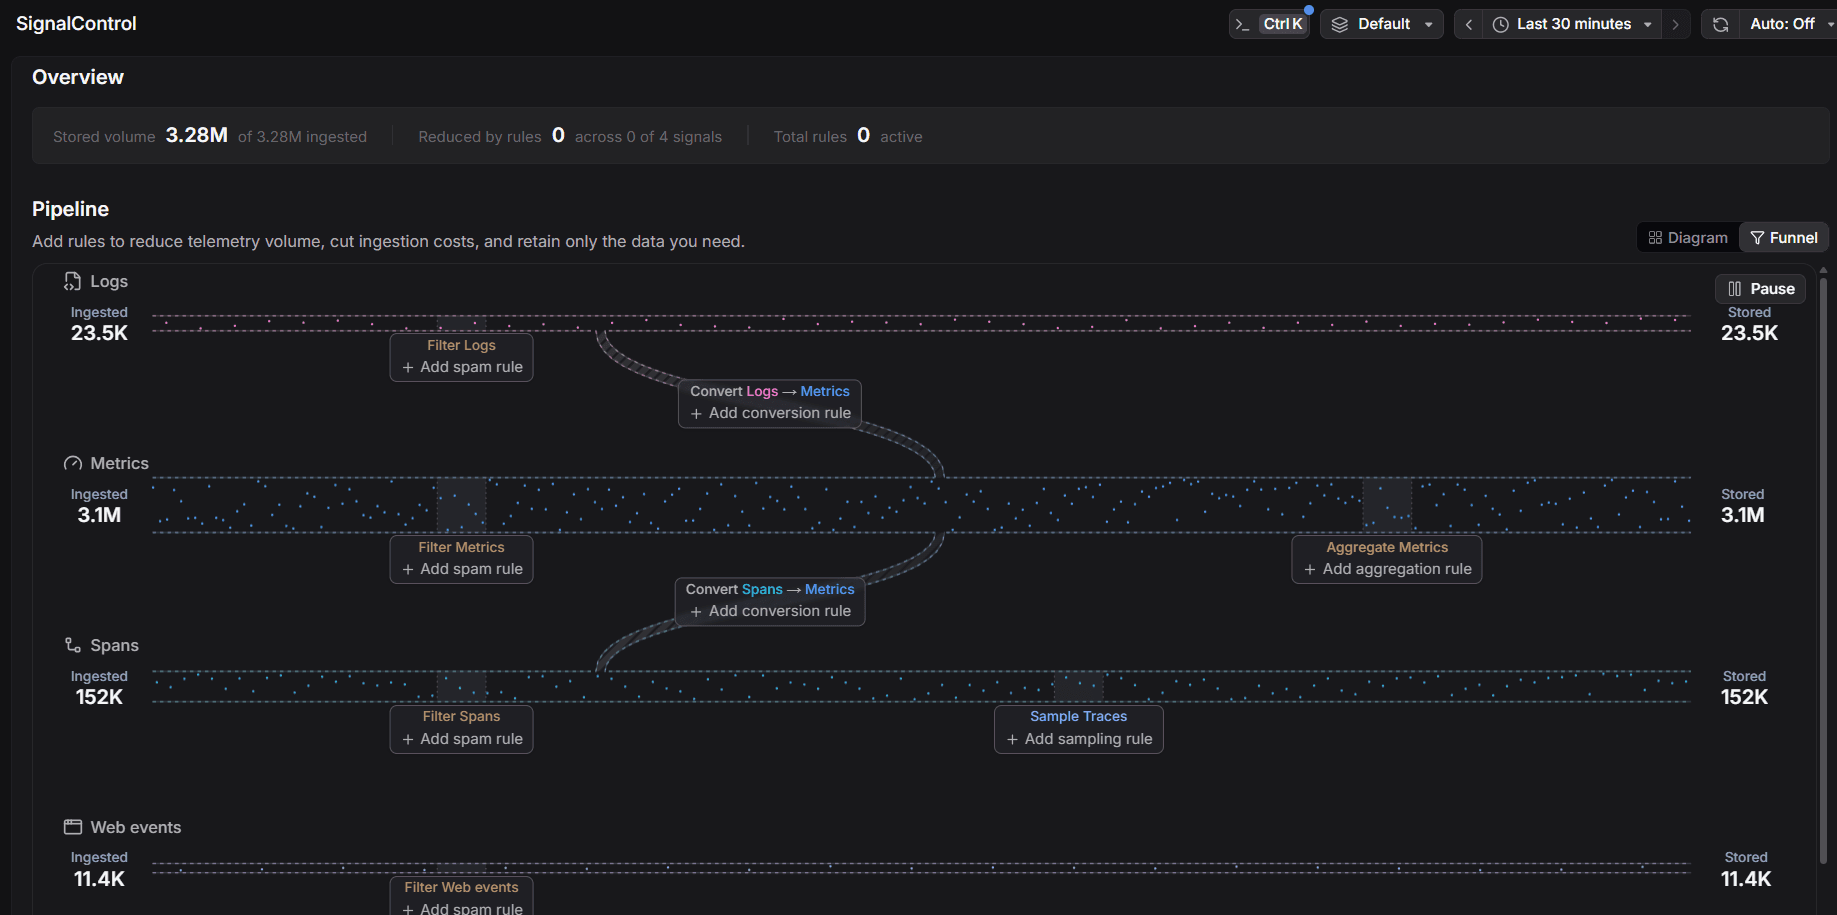
Pricing model: Per million spans, log records, web events, or metric data points, plus synthetic check runs. There's no separate charge for cardinality, although additional series still generate more data points. Ingestion and storage are metered separately: data dropped by SignalControl through spam filtering or tail sampling incurs the ingestion charge but not the storage charge. Core observability has no host, seat, or base fee, and monthly budget caps limit spend. Agent0 uses separate credits.
Trade-offs: Dash0 doesn't replace Datadog's Cloud SIEM, code security, dedicated network or database monitoring, native mobile SDKs, or on-call management. The integration catalog is smaller, and deployment is SaaS in AWS and GCP regions in the US and EU. For teams that need an entire security and operations suite in one contract, this is a real limitation.
See the Dash0 vs Datadog overview for a side-by-side view.
5. Elastic Observability
Elastic combines its log-search stack with APM, infrastructure and Kubernetes monitoring, RUM, synthetics, and profiling.
How it handles OpenTelemetry: Elastic ships EDOT, its Elastic Distributions of OpenTelemetry. Its managed OTLP endpoint stores data in the OTel data model "with no translation to ECS" (managed OTLP endpoint), so attribute names survive. Querying uses Elastic's own languages (ES|QL, KQL), and the managed endpoint isn't available for self-managed deployments.
Pricing model: Elastic Serverless charges per GB ingested plus per GB-month retained, with a cheaper logs-only tier. Egress and add-ons are metered separately. Hosted and self-managed deployments are priced on resources instead.
Trade-offs: Self-managed Elasticsearch means operating a search cluster. ECS-based and OTel-native ingest paths coexist, so confirm which one your deployment actually uses. Elasticsearch source is available under AGPL-3.0, while many observability features remain in x-pack under the Elastic License.
See also: Elastic alternatives.
6. Splunk Observability Cloud
Splunk Observability Cloud covers infrastructure, APM with always-on profiling, RUM, and synthetics. Observability Logs adds log searching and retention alongside metrics and traces, using point-and-click, natural-language, or SPL queries. It runs on Splunk Cloud infrastructure rather than the Observability Cloud backend; teams with existing Splunk Platform deployments can also connect logs through Log Observer Connect.
How it handles OpenTelemetry: collection is built on the Splunk Distribution of the OpenTelemetry Collector and Splunk's OTel instrumentation, and sends data into the SignalFx metric time series model, queried with the proprietary SignalFlow language. Logs are searched with SPL.
Pricing model: Annual host-based bundles, with APM and RUM included at higher tiers; some services meter time series or sessions. Observability Logs bills on daily log GB and retention. New Essentials and Premier editions are scheduled for November 2026 with different log entitlements (Splunk). Check the package actually offered when you request a quote.
Trade-offs: Observability Cloud, AppDynamics, and the Splunk Platform remain separate products. An existing Splunk contract doesn't tell you which observability capabilities or log entitlements you're buying.
See also: Datadog vs Splunk and Splunk Observability Cloud alternatives.
7. Honeycomb
Honeycomb centers investigations on wide events and traces. BubbleUp compares a slow or failing subset of requests against the rest to identify the attributes that differ.
How it handles OpenTelemetry: Honeycomb is OTel-first, with native OTLP ingest and no proprietary agent, and its metrics product works with existing OpenTelemetry metrics pipelines. Querying uses Honeycomb's own query builder rather than SQL or PromQL.
Pricing model: billed on event volume in tiers, with unlimited seats and unlimited querying (pricing). Adding attributes to an event doesn't add cost; more events do. Honeycomb Metrics is metered separately in data points per month, with its own allotment on each plan. It counts observations rather than unique series, so there's no per-series charge, but more series still send more data points.
Trade-offs: Honeycomb favors query-driven investigation over dashboard-first infrastructure monitoring. Metrics cover hosts, containers, and Kubernetes nodes, but frontend performance analysis and Service Map require Enterprise. If those are core workflows, the plan tier matters as much as the event price.
See also: Honeycomb vs Datadog.
8. Cortex XCOR (formerly Chronosphere)
Cortex XCOR is Chronosphere's observability platform under Palo Alto Networks (XCOR announcement). It focuses on telemetry shaping: dropping, rolling up, or sampling data before storage, with consumption budgets.
How it handles OpenTelemetry: native OTLP ingest through the Collector, and a Prometheus-compatible metrics engine. OTel resource attributes such as service.name are mapped to Prometheus job and instance labels.
Pricing model: not public. Contracts are custom, and the XCOR launch is moving them toward consumption-based bundles with budgets. It's sold to enterprises only, with no self-serve tier.
Trade-offs: Pricing is negotiated and packaging with other Cortex products is still developing. Palo Alto says XCOR retains a separate observability roadmap; confirm the commitments in your contract rather than guessing from the new product name.
See also: Chronosphere alternatives.
9. Coralogix
Coralogix processes data before storage and routes it into Frequent Search, Monitoring, or Compliance tiers. The archive stays in your S3 bucket and remains queryable.
How it handles OpenTelemetry: Coralogix describes itself as OTel-native and accepts OTLP and Prometheus remote-write. Logs and spans are queried with DataPrime, Coralogix's own language, and metrics with PromQL (DataPrime docs).
Pricing model: prepaid units consumed per GB, at a rate that depends on the signal and the storage tier you route it to, against a daily quota with burst headroom (pricing).
Trade-offs: You have to choose storage tiers and manage prepaid units and daily quotas. DataPrime is proprietary; volume can be predictable without the bill itself becoming simple.
See also: Coralogix alternatives.
Open-source options outside the commercial shortlist
Open-source stacks are relevant when self-hosting and control matter more than buying a managed competitor. They avoid a SaaS observability subscription, but infrastructure and engineering time become part of the bill.
- SigNoz stores metrics, logs, and traces in ClickHouse, ingests OTLP natively, and keeps OTel attribute names. The community edition is MIT-licensed; self-hosting means operating ClickHouse at scale.
- The self-hosted Grafana stack combines Grafana, Loki, Tempo, Mimir, and Pyroscope with Alloy as the collector. You operate several backends, their cross-signal plumbing, and multiple query languages.
- Prometheus and Jaeger are Apache-2.0 CNCF graduated projects. Prometheus receives OTLP metrics, and Jaeger v2 uses the OpenTelemetry Collector internally, but the pair still needs a log backend and long-term metric storage.
- ClickStack combines ClickHouse, the OpenTelemetry Collector, and HyperDX for logs, traces, metrics, and session replay. Self-hosting also requires MongoDB for application metadata.
- VictoriaMetrics, VictoriaLogs, and VictoriaTraces provide Apache-2.0 single-binary components with OTLP ingest. Evaluate VictoriaTraces separately because it remains at a 0.x version.
License and governance still matter. Apache-2.0 and MIT impose relatively few conditions, while AGPL-3.0 can require publishing modifications when software is offered as a network service. Regardless of license, self-hosting adds storage, capacity planning, upgrades, backups, and on-call ownership.
Also worth considering
- Better Stack combines uptime monitoring, status pages, and on-call with logs, traces, and metrics in a ClickHouse store you can query with SQL or PromQL. Its APM is thinner than Datadog's. It bills per GB ingested plus per GB retained.
- Sentry is strong for error tracking, session replay, and frontend performance, but it doesn't monitor infrastructure, and its OTLP support (traces and logs only) is in open beta. It works best alongside an observability backend.
- groundcover uses an eBPF sensor and runs its data plane in your own cloud account by default. It bills per node with no per-GB fee, but you also pay for the cloud infrastructure that stores your data.
- Observe by Snowflake stores telemetry in Snowflake, bills on committed ingest with compute included, and uses its own OPAL query language.
- AWS CloudWatch, Azure Monitor, and Google Cloud Observability fit cloud-specific environments. AWS supports OTLP metrics with PromQL queries, and Google offers an OTLP-based Telemetry API. Multi-cloud teams must still work across separate query models, integrations, and billing meters.
How to choose
Choose according to the billing behavior, portability requirements, and capabilities that are hardest to change:
| Your situation | Shortlist |
|---|---|
| Many short-lived hosts, containers, or spot instances | Dash0, Honeycomb, Elastic (volume-based, not host-based) |
| High-cardinality metrics and labels | Dash0 (per data point, no series charge), Honeycomb (per event or data point), Cortex XCOR (if you buy enterprise contracts) |
| Logs dominate your volume | Elastic, Coralogix, or a self-hosted ClickHouse- or VictoriaLogs-based stack |
| You must self-host | Grafana stack, SigNoz, ClickStack, VictoriaMetrics; Dynatrace Managed or self-managed Elastic for a commercial option |
| You need SIEM, network, database, and mobile monitoring from one vendor | Stay on Datadog, or evaluate Dynatrace and Splunk |
| You're on OpenTelemetry and want to avoid rebuilding lock-in | Dash0, Elastic (managed OTLP endpoint), Honeycomb |
| Your whole engineering organization needs access | Dash0, Honeycomb (no seat fees for observability) |
Switching off Datadog: what moves and what doesn't
OpenTelemetry instrumentation makes it possible to change telemetry destinations without rewriting application code. It does not migrate dashboards, monitors, saved queries, notebooks, SLOs, or the runbooks and on-call procedures built around them. Services instrumented with Datadog's own agent or dd-trace libraries also need an instrumentation migration.
Pilot the migration on a few services before moving production workloads wholesale:
- Deploy an OpenTelemetry Collector that receives your existing telemetry. The Collector's
datadogreceiver can accept traces from Datadog tracers, and itsstatsdreceiver can accept DogStatsD metrics. Thedatadogreceiver is alpha, and each receiver documents its own deployment constraints, so treat this bridge as something to validate in your topology rather than a drop-in replacement. - Fan out from the Collector to both Datadog and the candidate backends, so each platform sees the same data. Monitor the exporter queues so a slow backend doesn't drop telemetry, and keep a rollback path to Datadog-only export.
- Verify the data itself: trace IDs and context propagation across services, resource identity, counter temporality, histogram behavior, and sampling.
- Rebuild the dashboards and alerts that matter most on the candidate platform and compare them against Datadog during real incidents. Measure alert accuracy, query latency during incidents, telemetry loss, retention, access controls, and the actual monthly bill.
- Move services to OpenTelemetry SDKs one at a time, and cut over once the new platform has handled real incidents.
Expect to lose some Datadog features that depend on its SDK, such as Continuous Profiler, App and API Protection, and Data Streams Monitoring, and plan their replacements before cutover. The Datadog to OpenTelemetry migration guide walks through Collector configuration, mapping Datadog tags to semantic conventions, and translating Datadog queries to PromQL.
FAQ
Who is Datadog's biggest competitor?
Dynatrace, New Relic, Grafana Labs, Splunk, and Elastic are the closest broad-platform competitors in terms of infrastructure, APM, and log coverage. No single one is the biggest competitor on every workload.
Is there a free version of Datadog?
Yes. Datadog's free infrastructure tier covers up to five hosts with one day of metric retention (pricing list).
Is there an open-source alternative to Datadog?
Yes. SigNoz, the self-hosted Grafana stack, Prometheus with Jaeger, ClickStack, and VictoriaMetrics are the most common choices. See open-source options.
Is Grafana better than Datadog?
Grafana suits teams that value self-hosting and open query languages, provided they're willing to operate separate backends for different signals. Datadog provides a broader integrated commercial platform, with proprietary query and data models. See Grafana vs Datadog.
Which is better, Splunk or Datadog?
Splunk is the stronger choice if it's already your log and security platform. Datadog is more unified for infrastructure and APM. See Datadog vs Splunk.
Can I keep my OpenTelemetry instrumentation if I leave Datadog?
Yes, if your services already use OpenTelemetry SDKs and an OTLP-compatible pipeline. You can redirect that telemetry to a different backend, but Datadog-specific dashboards, monitors, and queries don't transfer. Services using Datadog tracers need re-instrumenting.
Final thoughts
If Datadog's security, network, and database products are central to your stack, replacing all of them with separate tools can make the problem worse. For an observability-focused deployment, the harder questions are what drives the bill and what remains portable after your telemetry has been ingested. OTLP support alone doesn't answer either.
Shortlist three or four platforms and run a pilot on the same workloads. Compare the actual bill, preserved semantic conventions, queries, alert behavior, and work needed to migrate. For an OpenTelemetry-native backend with open dashboards and alerts, try Dash0 free for 14 days. No credit card required.