If you are shopping for Coralogix alternatives, there is a good chance one of three things happened. Someone on your team spent an afternoon converting units into gigabytes to explain a spend forecast to finance. Or you hit a daily quota mid-incident and watched data get blocked until 00:00 UTC. Or a developer asked why they had to learn a query language that only works in one product, when the incident they were debugging needed three clicks through the APM screens to reach a root cause.
None of that means the product is bad. Coralogix is a legitimately good piece of engineering, and it is worth saying so before listing replacements. Its Streama pipeline analyzes and alerts on data before storage rather than after indexing, its TCO Optimizer routes each stream into Frequent Search, Monitoring, Compliance, or Blocked pipelines, and everything lands in your own S3 bucket where you can query it remotely without burning quota. Very few vendors will let you keep petabytes in storage you own and still search it. Coralogix also landed in the Leader quadrant of Gartner's 2026 Magic Quadrant for Observability Platforms, which is not nothing when procurement gets involved.
The hard part is that the alternatives do not meter the same way, so you cannot compare them by looking at a rate card. Coralogix charges per gigabyte ingested. Its competitors variously charge per indexed event, per log record, per active time series, per gigabyte scanned at query time, per session, per host memory-hour, or some combination. Two platforms with identical published rates can produce bills that differ by 3x on the same telemetry, and which one wins depends on facts about your own data that you probably have not measured, starting with your average log record size.
This guide reviews nine alternatives through the lens that matters when you are leaving Coralogix specifically: what happens to your archive and long retention, what query language your team ends up learning, how honest each platform's OpenTelemetry support is once you read the docs, and what each pricing model actually charges you for. Every rate below was verified against the vendor's own pricing page in August 2026, and pricing gets model analysis rather than a single quoted number, because the number on a pricing page rarely survives contact with real telemetry.
What makes Coralogix alternatives hard to compare
Start with retention, because it is where most Coralogix migrations quietly break. Coralogix writes all parsed data to your bucket, compresses logs and traces about 5x on the way in (an effective $0.003 per GB of S3 cost by its own math), and charges nothing extra to query that archive from the UI. Hot Frequent Search retention is short by design, and Coralogix does not recommend going beyond seven days, because the archive is meant to carry the long tail. Almost nothing else on this list works that way. Most alternatives either make retention a recurring per-GB-per-day meter, or push archived data into a colder tier that costs money to read, or cap retention at 30 days and expect you to solve compliance elsewhere. If a seven-year audit requirement is the reason you liked Coralogix, that requirement needs to be the first filter on your shortlist, not the last.
Then do the unit conversion, on paper, before you talk to any vendor. One gigabyte of 500-byte log lines is roughly 2 million records. At Coralogix's published $0.42 per GB for logs, that gigabyte costs 42 cents. On a platform that charges $0.60 per million log records, the same gigabyte costs $1.20. Now flip it: one gigabyte of rich 5 KB structured events is only about 210,000 records, which costs around 13 cents on the record-based model and still 42 cents on the per-GB model. Per-gigabyte pricing rewards you for writing fewer, chattier lines. Per-record and per-event pricing rewards you for writing fewer, fatter ones. Neither is inherently cheaper, and any vendor claiming otherwise is hoping you will not run the arithmetic. Go measure records per day and bytes per record in your current account first.
The query language question deserves more scrutiny than it usually gets. DataPrime is a real skill investment that does not travel, and that is a fair reason to leave. But look closely at what you are trading it for. Elastic gives you ES|QL, Dynatrace gives you DQL (Dynatrace Query Language), New Relic gives you NRQL (New Relic Query Language), and the managed open-source stack gives you PromQL plus LogQL plus TraceQL, which is three dialects instead of one. Only PromQL and SQL are languages your team plausibly already knows. Swapping one proprietary syntax for another proprietary syntax is lateral movement dressed up as progress.
Be equally skeptical about OpenTelemetry claims, including Coralogix's. Coralogix accepts OTLP (OpenTelemetry Protocol) from any collector, but its organizing model is Application and Subsystem, so its docs have you set cx.application.name and cx.subsystem.name resource attributes, and those labels are what drive routing, retention scope, and alert scope. There is also a hard 10 MB limit per request to the OpenTelemetry endpoints, with 2 MB recommended. Every vendor has caveats of this shape. Sumo Logic's own docs note that upstream collector configs can produce errors because the platform expects tags its distribution adds by default. Datadog counts each OpenTelemetry metric as a custom metric. Elastic is still reconciling two schemas. Read the caveat, not the logo on the integrations page, and see what makes a good OpenTelemetry backend for the fuller checklist. And remember that OpenTelemetry reduces instrumentation and transport lock-in without eliminating lock-in: your dashboards, alert rules, parsing rules, pipeline policies, role assignments, and investigation habits all carry switching cost no matter how open the wire format is.
One last filter. If your Coralogix account includes Cloud SIEM (security information and event management) or Snowbit MDR (managed detection and response), then roughly half the platforms here cannot replace what you have, and you are looking at either a security-capable platform or a two-vendor future.
We evaluate each tool against these criteria:
- Log analytics depth and query language: what your team learns, and whether that skill is portable
- OpenTelemetry stance: stored as sent, or mapped into a proprietary internal model
- Platform breadth beyond logs: APM (application performance monitoring), RUM (real user monitoring), synthetics, security, and automated investigation
- Retention and archive economics: hot window, cold tier, whether data can live in storage you own, and what reading it costs
- Cost model: the billing dimensions, and how they interact with log-heavy workloads
- Cost control at the source: filtering, sampling, and tiering before you are billed
- Overage and quota behavior: what happens the day you exceed plan, since this is where Coralogix surprises people
- Operational model and data residency: SaaS, self-hosted, or bring-your-own-cloud, and where the bytes live
How they compare
The table applies those criteria uniformly, with Coralogix as the reference row so you can see what you are comparing against. Descriptions are factual. Opinions live in the entries.
| Tool | Logs and query language | OTel stance | Retention model | Cost model | Best fit |
|---|---|---|---|---|---|
| Coralogix (reference) | DataPrime, Lucene, PromQL for metrics | OTLP ingest; cx.application.name and cx.subsystem.name drive routing | Short hot window plus indefinite archive in your own S3, remote query included | Per GB by pipeline tier, converted into units | Log-heavy teams with long retention and SIEM needs |
| Dynatrace | DQL over Grail | OneAgent-first; OTLP ingest supported | Retention billed per GiB-day, or pay-per-query on cold data | Memory-GiB-hour hosts plus per-GiB log ingest plus retention or scan | Large enterprises buying root-cause automation |
| Dash0 | PromQL across signals, plus SQL | OpenTelemetry-native storage, no conversion | 30 days for spans, logs, and web events; 13 months for metrics | Per million spans, log records, metric data points; no seats or hosts | OTel-standardized teams wanting one query language |
| Elastic Observability | ES|QL, KQL, Lucene | Managed OTLP endpoint stores data in OTLP shape; EDOT distributions | Serverless bills GB retained per month; snapshots on self-managed | Per GB ingested plus per GB retained (Serverless); resource-based (Hosted) | Search-driven log analytics with deployment choice |
| New Relic | NRQL | OTLP ingest, mapped to its own data model | 8 days default, up to 90 days on Data Plus; Federated Logs queries in place | Per GB ingested plus per-seat, or a compute-unit option | Many hosts, few engineers who need full access |
| Sumo Logic | Sumo search syntax | Ships its own OpenTelemetry Collector distribution | Tiered storage with credits charged on stored data | Flex: ingest free, credits consumed by storage and data scanned | Write-heavy, read-rarely logging plus SIEM |
| Datadog | Proprietary search syntax, Log Explorer | OTLP accepted, converted internally; OTel metrics count as custom metrics | 15 or 30 days indexed; Flex Logs storage up to 15 months | Per GB ingested plus per million indexed events, plus per-host modules | Teams consolidating every tool with one vendor |
| Grafana Cloud | LogQL for logs, PromQL for metrics, TraceQL for traces | Strong OTLP and Prometheus ingest | 30 days on paid tier; longer needs custom pricing | Per active series, per GB processed/written/retained, per active user, plus platform fee | Teams already fluent in Prometheus and Grafana |
| Honeycomb | Proprietary query builder, BubbleUp | OTLP ingest, converted to its event model | Retention by plan tier | Per million events, metric data points billed separately | Trace-first debugging of distributed systems |
| OpenSearch, Prometheus and Jaeger | OpenSearch DSL and PPL, PromQL, Jaeger UI | You own the pipeline; OTel-native by choice | Whatever your index policies and snapshots say | Free licenses; infrastructure and engineering time | Teams with a platform team and strict data control |
The order below leads with Dynatrace and Dash0, then runs through the other commercial full-stack and search-and-log platforms alphabetically, then Datadog, then managed open source, then the do-it-yourself route.
1. Dynatrace
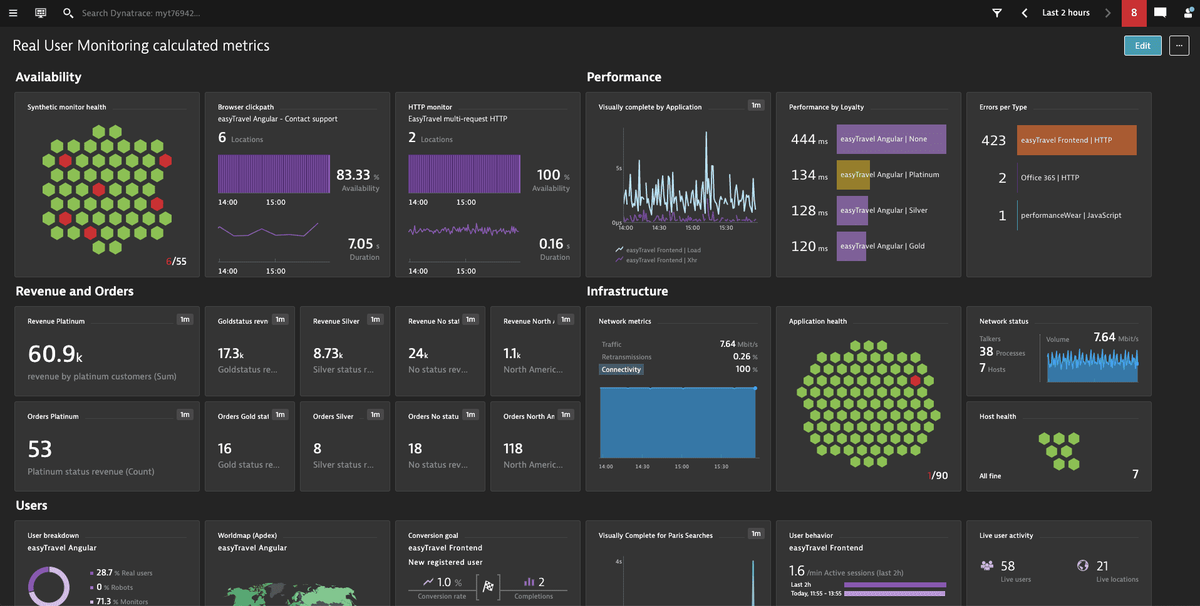
Dynatrace sits at the enterprise end and sells something genuinely different: automated causal analysis. The Davis engine, the Smartscape topology model, and the Grail data lakehouse combine into root-cause output that goes further than the anomaly detection most competitors ship. For a large Coralogix deployment where the real problem is investigation time rather than storage cost, it is a credible destination.
What's good
Davis tries to name a root cause instead of handing you correlated symptoms, and when it lands, it collapses an investigation from an hour to a minute. That is the whole value proposition. OneAgent backs it up by discovering and instrumenting the stack automatically, a real advantage over SDK-based instrumentation if you have hundreds of services and no appetite for a per-service rollout. Seats are not a meter either: every tier includes unlimited users, so like Coralogix, you can give the whole engineering org access without a per-head conversation.
The catch
The deepest experience still runs through OneAgent, so a team that standardized on OpenTelemetry gets a thinner version of the product than the demo showed. Cost is the bigger problem. Full-stack monitoring bills on host memory, which means two hosts running identical workloads cost different amounts based on RAM, and your bill moves for reasons unrelated to application behavior.
Retention is where the Coralogix comparison stings most. Coralogix charges you once at ingest and lets the archive sit in your bucket. Dynatrace charges $0.02 per GiB-day to retain logs with included queries, so a long retention window is a recurring meter that scales with both volume and time, and the alternative pay-per-query model charges per GiB scanned instead. Either way, reading old data costs money. Dynatrace also runs on a committed credit pool, and third-party contract data puts median enterprise deals well into six figures, so this is not a platform you adopt on a monthly card.
Pricing model
Full-stack monitoring is $0.08 per hour for an 8 GiB host, which is $0.01 per memory-GiB-hour, and infrastructure-only monitoring is about half that. Kubernetes platform monitoring is $0.002 per pod-hour. Log management and analytics ingest at $0.20 per GiB, with retain-with-included-queries at $0.02 per GiB-day, or a pay-per-query model that charges roughly $0.0035 per GiB scanned on cheaper retention. RUM is $0.00225 per session and synthetics run about $0.001 per request. The Dynatrace pricing page publishes the rate card.
Everything draws down a Dynatrace Platform Subscription credit pool, which gives you flexibility to shift spend between capabilities and makes forecasting genuinely hard. The model rewards stable, well-sized hosts and modest log volumes. It punishes exactly the profile that pushed you toward Coralogix in the first place: very high log volume kept for a long time.
The verdict
Pick Dynatrace if you are enterprise-sized, automated root cause is worth a premium, and unlimited seats matter. Look elsewhere if cost predictability drove your search, if your log retention is measured in years, or if OpenTelemetry portability is central to your strategy.
2. Dash0
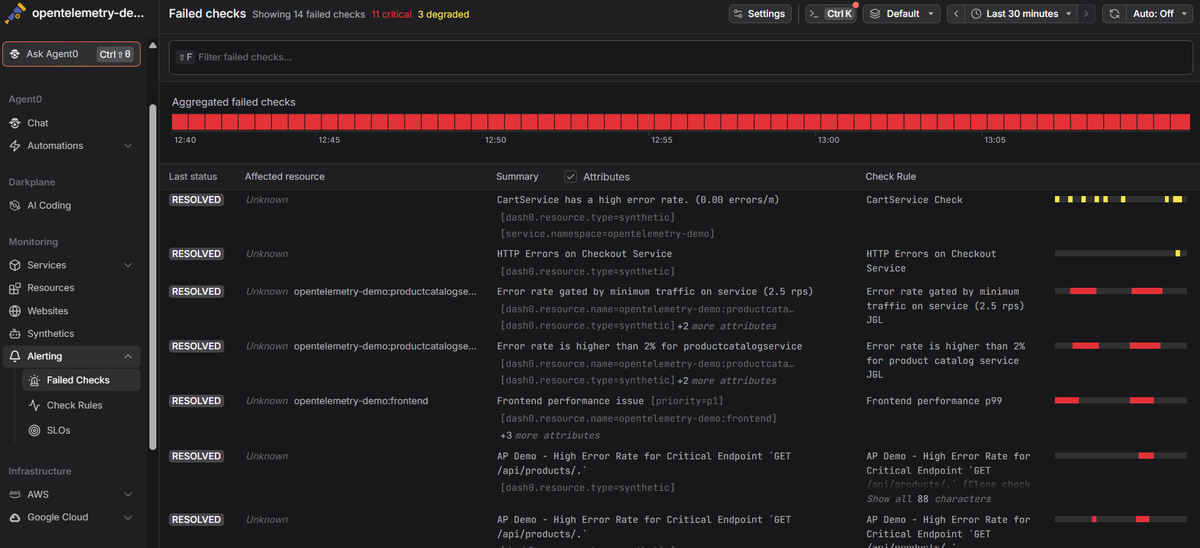
Dash0 is an OpenTelemetry-native platform rather than a platform with OpenTelemetry support added later. It was founded in 2023 by Mirko Novakovic, who previously founded the APM company Instana, and the design premise is that OTLP data should be stored and queried without ever being converted into a vendor-specific shape. Logs, metrics, traces, web events, and synthetic checks share one data layer, and Seeker, the investigation agent inside the AI SRE product Agent0, runs investigations over that same data.
What's good
Because data is stored as sent, OpenTelemetry resource attributes are what link a log line to a span to the pod it came from, so semantic conventions do the correlation work. There is no application-and-subsystem labeling scheme to maintain and no mapping to configure for non-standard fields, which is the specific friction Coralogix users hit when their OTel attributes do not match the platform's model. You also get one query language instead of several: PromQL works across signals, Prometheus remote write is supported, and dashboards are built on Perses, a CNCF-backed open format that you can manage as code through CRDs, Terraform, or the CLI and export in open formats. Filtering happens before billing rather than after, too. Intelligent Edge, Dash0's telemetry spam filter, drops unwanted data before ingestion, with rules that export to OTTL so the tuning work is not stranded if you leave, and cost controls add monthly budget limits and a spend forecast on top.
The catch
Retention is the honest dealbreaker for a chunk of Coralogix's user base. Spans, log records, and web events are retained for 30 days, and metric data points for 13 months. There is no equivalent of writing everything into your own S3 bucket and querying it years later at storage prices. If a seven-year audit trail or a regulator-driven retention policy is why you are on Coralogix, Dash0 does not replace that on its own, and you will need a separate archival destination.
There is no SIEM and no managed detection service, so Coralogix Cloud SIEM and Snowbit users are looking at a second vendor. Dash0 is also SaaS only, with no self-hosted or bring-your-own-cloud deployment, which matters if data residency was part of why the archive-in-your-bucket model appealed.
Auto-instrumentation coverage is narrower than an agent-based incumbent's: the Kubernetes Operator handles Java, Node.js, and .NET by default, with Python and Ruby as opt-in, and anything outside that list needs manual OpenTelemetry SDK work. The integration catalog is younger than what decade-old vendors ship, incident management is not included so on-call scheduling and status pages still need PagerDuty or incident.io, and Agent0's autonomous write actions deserve the same review discipline you would apply to any agent that opens a pull request against your codebase.
Pricing model
Dash0 charges per signal: $0.20 per million metric data points, $0.60 per million spans or span events, $0.60 per million log records, $0.60 per million web events, and $0.20 per thousand synthetic API check runs, with Agent0 metered separately at $0.60 per credit. There are no per-seat, per-host, per-container, or base platform fees, and queries are not billed. Rates are on the Dash0 pricing page.
The interaction with a log-heavy Coralogix workload is the thing to model carefully, and it cuts both ways. Because the meter counts records rather than bytes, adding attributes to a span or fields to a structured log does not create a new billing dimension, so rich OpenTelemetry data is not financially penalized and there is no cardinality surcharge. But high-count, low-byte logging is where a per-record model gets expensive relative to per-GB pricing: two million 500-byte lines cost $1.20 here against $0.42 per GB at Coralogix's published log rate. Before migrating, count records per day rather than gigabytes per day, and expect chatty debug and health-check logging to be the first thing worth filtering.
The verdict
Pick Dash0 if your team has standardized on OpenTelemetry, you want one query language and dashboards that export cleanly, and predictable per-signal billing with no seat or host meters suits how you work. It is the wrong choice if you need multi-year retention in storage you control, SIEM in the same platform, or self-hosting. You can test the record-count math against real telemetry on a 14-day free trial.
3. Elastic Observability
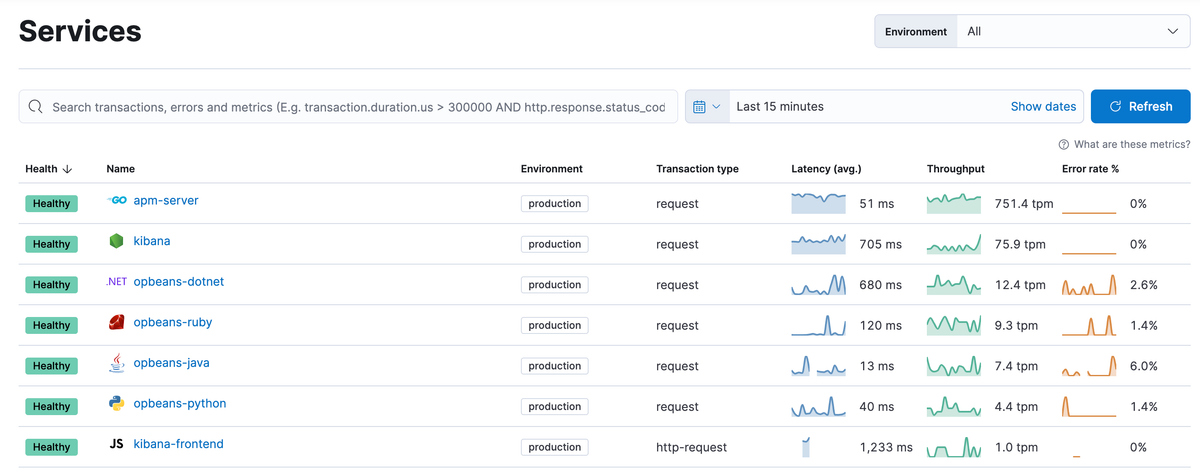
Elastic Observability is the closest philosophical neighbor to Coralogix on this list, because both are built around searching enormous volumes of log data rather than around agent-based APM. Elastic brings the Elasticsearch engine, ES|QL, Kibana, and three deployment models: Serverless, Cloud Hosted, and self-managed.
What's good
Elastic's OpenTelemetry investment is real, not a checkbox. The company donated Elastic Common Schema to OpenTelemetry along with its Universal Profiling agent, ships the Elastic Distributions of OpenTelemetry (EDOT), and its managed OTLP endpoint stores telemetry in OTLP format with resource attributes and semantic conventions preserved, a stronger position than most incumbents hold. Deployment choice doubles as a compliance answer: you can run Serverless, run a hosted cluster in a region you choose, or self-manage entirely, and for teams that picked Coralogix partly to keep data in their own S3, self-managed Elastic keeps the bytes in your infrastructure. The log analytics depth is real too. Searchable snapshots, index lifecycle tiering, and the logsdb index mode, which Elastic reports can cut the data footprint substantially, give you real levers, and ES|QL is a capable piped language for ad hoc work.
The catch
Elastic is mid-transition between two schemas, and you will feel it. Beats-based integrations and their dashboards are built on Elastic Common Schema and are not compatible with OpenTelemetry semantic conventions, so an OTel-first rollout means some prebuilt content does not apply and some fields live in two places. The managed OTLP endpoint is also unavailable on self-managed, ECE, and ECK clusters, which is awkward if you chose self-management for data residency and then wanted the simplest ingest path.
You are also trading DataPrime for ES|QL and KQL, not for something familiar. Public review themes on G2 consistently flag a steep learning curve, particularly for teams without prior Elasticsearch experience. And on Serverless, retention is a recurring per-GB-per-month meter billed on uncompressed size at ingest, which is a different economic shape from writing compressed data into a bucket you already pay for.
Pricing model
Serverless Observability bills two meters: per GB ingested and per GB retained per month, on volume tiers that step down as volume grows, across two feature tiers (Logs Essentials and Complete). Metrics stored in time series index mode are priced at 25% of the standard rate as of July 2026. Cloud Hosted is resource-based instead, so you pay for provisioned RAM, storage, and zones, and self-managed is license-based. See Elastic Observability Serverless pricing.
The model's honesty is that both levers are ones you control, and the tiered curve means high volume gets materially cheaper per GB. The friction is that you are modeling two meters instead of one, and retention compounds: every extra month of history is a permanent line item rather than a one-time ingest charge. Teams that want long retention usually end up designing a tiering strategy, which is the same work the TCO Optimizer was doing, just with different vocabulary.
The verdict
Pick Elastic if search-driven log analytics is the center of your practice, you want OpenTelemetry data stored in its native shape, and deployment flexibility matters for compliance. Skip it if you want a small conceptual surface area, or if your team has no appetite for learning index modes, tiers, and a new query language at the same time.
4. New Relic
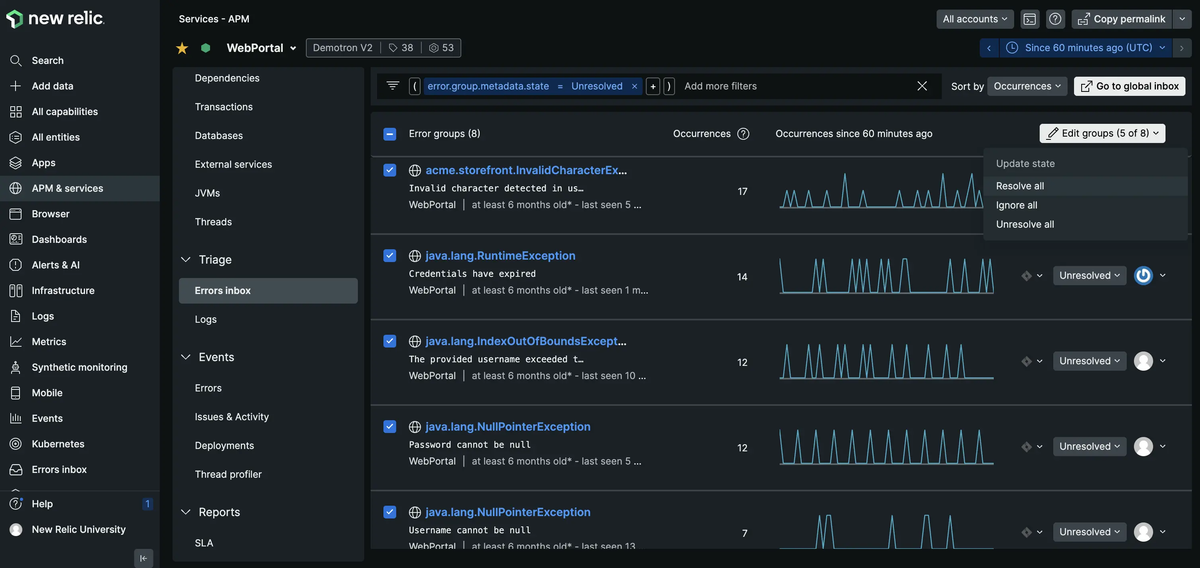
New Relic rebuilt its pricing years ago around two dimensions, data ingested and user seats, and dropped host-based billing entirely. For a Coralogix user that makes the data side of a migration unusually easy to model, because both platforms charge per gigabyte and you already know your gigabytes.
What's good
Billing runs per GB with no host meter: unlimited hosts, containers, functions, and Fargate tasks are included, so ephemeral infrastructure does not create a second bill, and your migration math on the data axis is close to arithmetic. The free tier is one you can actually run on. 100 GB of monthly ingest, one full platform user, and unlimited basic users is enough for a small team to run real production observability at no cost. New Relic's pricing page also states it does not charge for egress or data hydration, and Federated Logs lets you query logs where they already live without moving them. For a team leaving Coralogix partly for its archive story, that combination is the closest analog on offer from an incumbent.
The catch
Seats are where this model bites. Coralogix includes unlimited users at every plan level, so moving to New Relic means someone has to decide who deserves full access. Pro full platform users list at $349 per user per month on annual commitment, and $418.80 monthly, which for a 20-person team routinely exceeds the data bill. Core users at $49 blunt that, but only for people whose work fits the reduced permission set.
OpenTelemetry data is accepted over OTLP and then mapped into New Relic's own model, so your instrumentation is portable while the platform experience is not. Default retention is 8 days on the original data option and up to 90 days with Data Plus, which is short if you came for indefinite archive. And free accounts stop ingesting and lose platform access on exceeding 100 GB until the next month, which is the same class of hard stop that frustrated you in Coralogix, just at a different threshold.
Pricing model
Ingest is $0.40 per GB beyond the free 100 GB on the original data option, or $0.60 per GB on Data Plus, which adds up to 90-day retention plus HIPAA and FedRAMP eligibility, with EU storage adding $0.05 per GB. Seats sit on top: basic users free, Core at $49, full platform at $10 for the first plus $99 each on Standard (capped at five), or $349 per user annually on Pro. A newer compute-unit option removes user licensing in favor of consumption, priced through sales. All of it is on the New Relic pricing page.
The two axes scale independently, which is both the appeal and the trap. Telemetry growth and headcount growth hit the bill separately, and only one of them is something your platform team controls. Compared to Coralogix's single volume-based meter, this is simpler on the data side and structurally more expensive as your org grows.
The verdict
Pick New Relic if you run a lot of infrastructure, per-GB math suits your telemetry, and a small group of engineers need deep access while everyone else just reads dashboards. Look elsewhere if your whole team queries production daily, since seats will dominate. Dash0's New Relic alternatives guide covers that trade in more depth.
5. Sumo Logic
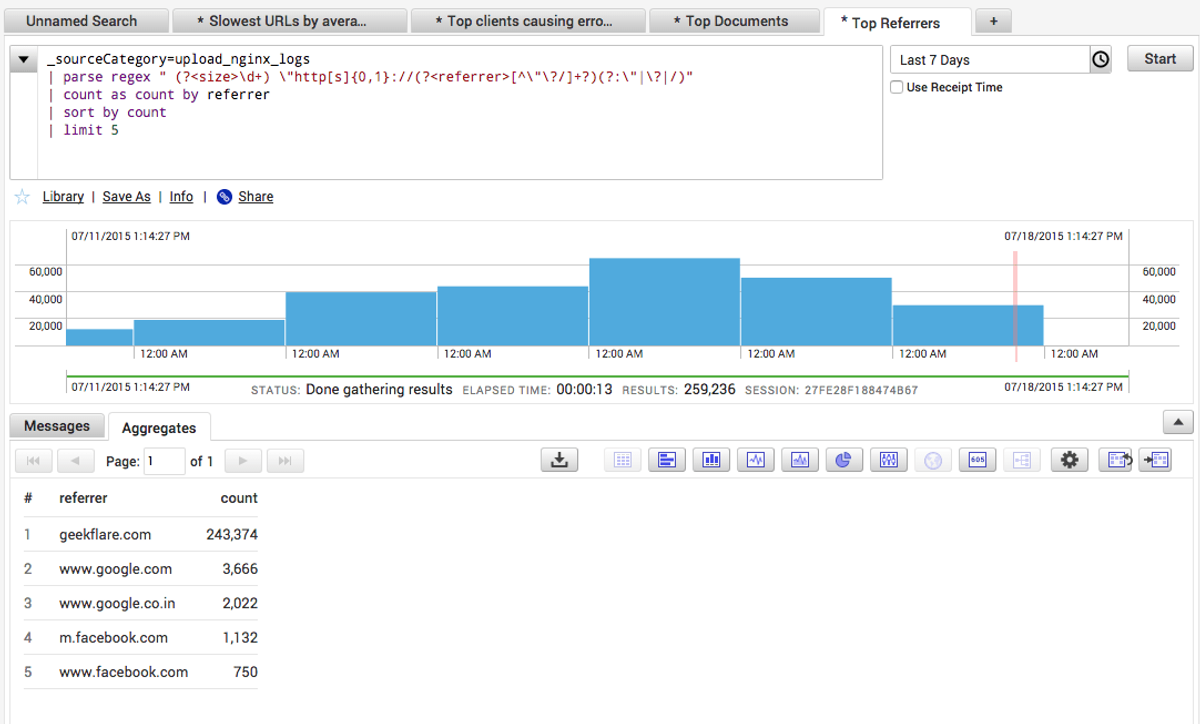
Sumo Logic is the alternative whose pricing philosophy is most nearly the mirror image of Coralogix's, which makes it worth a serious look even if it rarely tops shortlists. Under its Flex model, ingesting and indexing logs is free, and credits are consumed by the data you store and the data your searches scan.
What's good
Free ingest changes the incentive: you stop rationing what you send. For write-heavy compliance logging, audit trails, and debug streams that nobody reads until something breaks, this is structurally the cheapest shape on the list. The tiering will also feel familiar. Continuous, Frequent, and Infrequent data tiers trade ingest cost against search cost per partition, which maps almost one-to-one onto the mental model you built with the TCO Optimizer. Security lives under the same roof, too: Cloud SIEM runs in the same platform, and the Sumo Logic Distribution for OpenTelemetry Collector is a supported build of the upstream collector rather than a proprietary agent, with unlimited users.
The catch
Moving the meter to query time moves the pain, it does not remove it. A security operations team running broad searches across large retained datasets, or a team with dashboards refreshing over wide windows, can burn credits fast, and the people generating that cost are the ones you least want to discourage from investigating. Coralogix charges you to write and lets you read the archive free. Sumo does the opposite. Which is cheaper depends entirely on your read-to-write ratio, and most teams have never measured it.
Sumo also does not publish a simple per-GB list price, and credit rates vary by plan and contract, so you cannot self-serve a forecast the way you can with Coralogix's published rates. The Infrequent tier is limited to Enterprise Suite plans per Sumo's own documentation. Logs sent through Cloud SIEM are the documented exception to free ingest and do consume credits on the way in, so a security deployment has cost drivers a pure observability deployment does not. APM and tracing are present but are not the reason anyone buys this platform.
Pricing model
Flex is a credit model. Credits are consumed by stored data and by data scanned during search, with the tier you assign to a partition setting the balance between the two, and standard log ingest itself consuming nothing. Sumo's Flex pricing FAQ documents the mechanics, and credit dollar values come from your contract rather than a public rate card.
What the model rewards is discipline about reading rather than discipline about writing, which is unusual and, for archival workloads, genuinely aligned with the customer. What it punishes is exploratory analysis over long windows, and what it obscures is predictability, since a bill driven by query behavior is a bill driven by how bad your month was. Ask for scan-volume telemetry from a trial before committing.
The verdict
Pick Sumo Logic if you write far more than you read, your retention requirements are long, and you want SIEM in the same platform, with the caveat that you will be negotiating rather than calculating. Skip it if your engineers query constantly, or if a published rate card was one of the things you valued about Coralogix.
6. Datadog
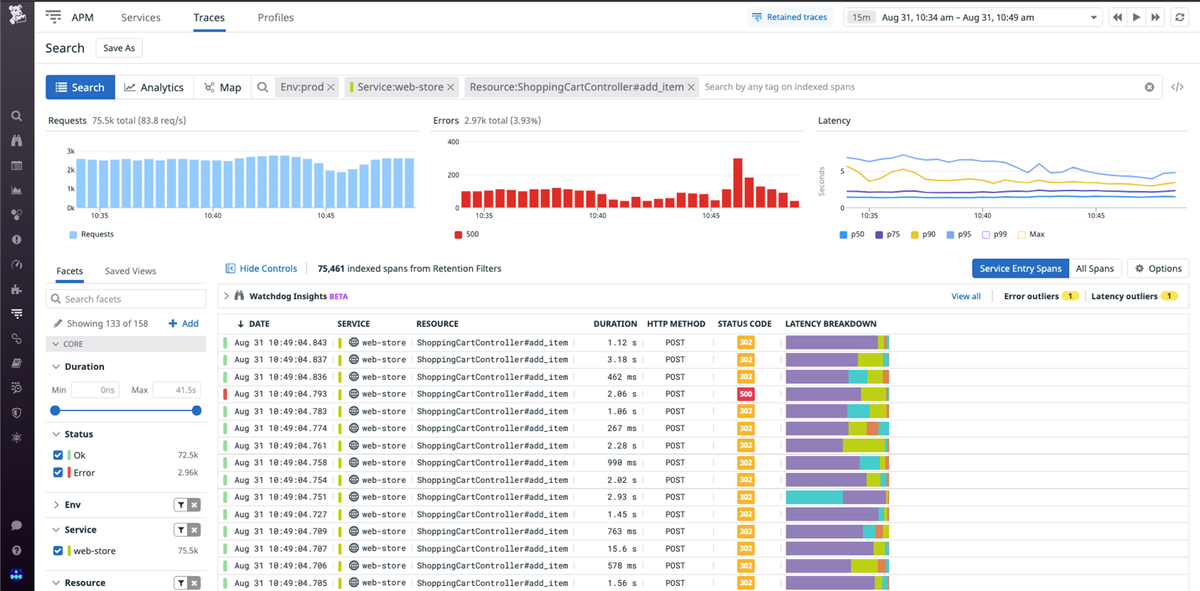
Datadog is the platform every other vendor gets compared against, and for a Coralogix user it represents a specific trade: you give up cheap indefinite retention in your own bucket and get the broadest integration catalog and product surface in the industry. Infrastructure, APM, logs, RUM, synthetics, security, and a long tail of adjacent products all live under one login.
What's good
Datadog's Logging without Limits model separates the cost of receiving logs from the cost of making them searchable, which gives you a tiering lever that will feel familiar if you have been running the TCO Optimizer. Flex Logs extends that to long retention, and Cloud SIEM detections still run against Flex data. Coverage is the bigger draw for teams tired of tool sprawl: roughly 900 integrations by Datadog's own count mean onboarding a new data source is usually configuration rather than engineering, which matters if your Coralogix account is one of several tools you are trying to consolidate. The investigation tooling is mature, too. Watchdog anomaly detection, Bits AI, continuous profiling, and live debugging are polished products with years of iteration behind them, and correlation quality holds up once enough data is flowing.
The catch
Datadog's business model runs against your interest in sending less data, and that shows up in the details rather than in the sales deck. Every OpenTelemetry metric counts as a custom metric by default, so one high-cardinality tag can turn a single instrumentation decision into tens of thousands of billable series. Ephemeral Kubernetes nodes get billed as hosts even when they lived for minutes, and each APM host includes a fixed span allotment that high-throughput services blow through early in the month.
The structural change from Coralogix is the indexing decision. In Coralogix, data you route to a cheap pipeline is still queryable, just with different performance characteristics. In Datadog, logs you choose not to index are effectively invisible in Log Explorer, and Flex Logs queries return in minutes rather than seconds and do not support Log Monitors or Watchdog Insights. You are making a sharper bet up front about which logs matter.
Pricing model
Logs bill on two axes: $0.10 per uncompressed GB ingested, plus indexing at $1.70 per million events at 15-day retention on an annual commitment ($2.55 on demand). Flex Logs storage is $0.05 per million events stored per month. Around that sit per-host modules, near $15 per host for infrastructure and $31 per host for APM on annual Pro terms, with custom metrics beyond the per-host allotment at $0.05 per 100. Current rates are on the Datadog pricing page.
For a Coralogix leaver the important shift is from bytes to events. If your logs are short and numerous, per-event indexing will cost more than you expect, and the $0.10 ingest line is the smallest part of the bill. If your logs are verbose and structured, event-based indexing is comparatively kind. The model rewards teams with the discipline to index a minority of their volume, and punishes autoscaling, high-cardinality tags, and the instinct to keep everything searchable.
The verdict
Pick Datadog if breadth is the goal, you want observability and security from one vendor, and someone owns the job of policing custom metrics and index filters. Skip it if a predictable bill was your reason for leaving, or if you want the majority of your log volume to stay searchable without paying indexing rates. Dash0 maintains a deeper Datadog alternatives comparison if it makes your shortlist.
7. Grafana Cloud
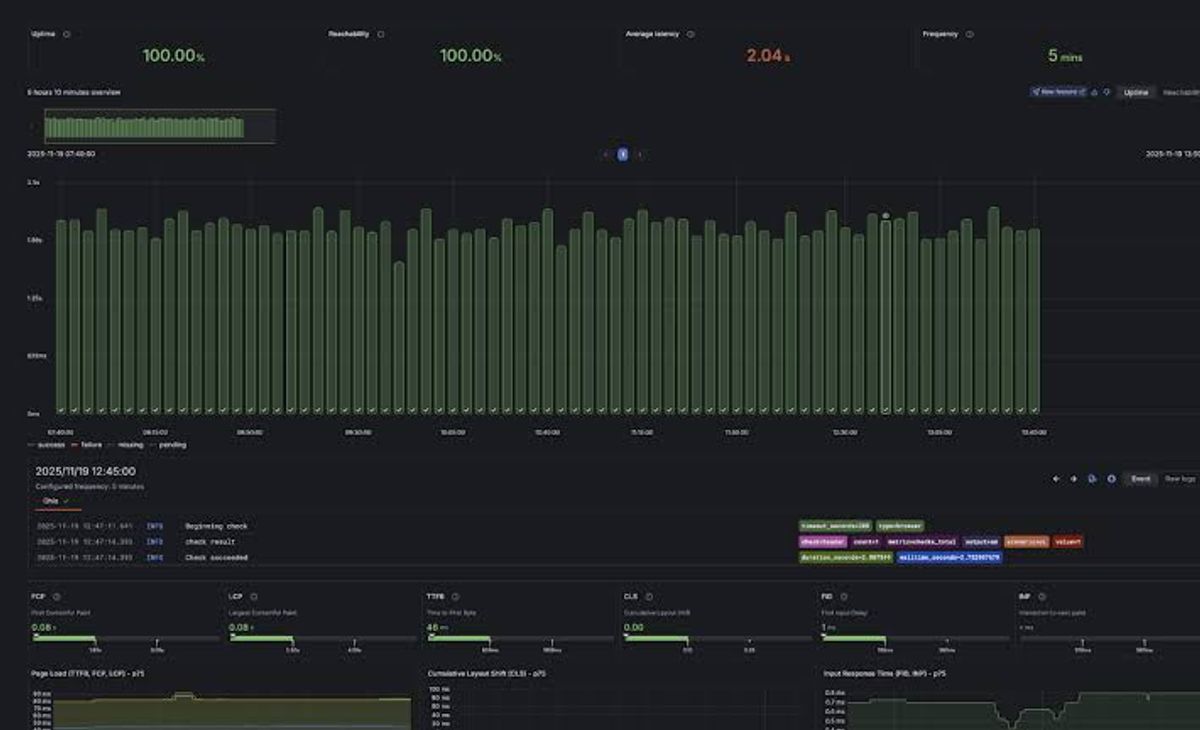
Grafana Cloud is the managed version of the open-source stack a large share of the industry already runs: a metrics backend, a logs backend, a traces backend, and continuous profiling, all behind the dashboard layer your team probably already has open in another tab.
What's good
Portability here is more than a claim. Dashboards, alert rules, and queries are built on open components you could self-host, and for a team that got uncomfortable with a proprietary query language and proprietary dashboard definitions, this is the strongest exit-ramp story among the managed platforms on this list. The free tier is the most generous in the category too: 10,000 active metric series, 50 GB each of logs and traces, three active users, and 14-day retention, with no expiry. And if your team already writes PromQL and runs exporters, onboarding cost is close to zero on the metrics side, with solid OpenTelemetry ingestion support besides.
The catch
The architecture that makes it portable also fragments it. Each signal has its own backend and its own language: PromQL for metrics, LogQL for logs, TraceQL for traces. You left Coralogix to stop learning one proprietary syntax and you have arrived somewhere with three dialects to correlate across, which is more context-switching during an incident, not less.
Metrics bill on active series, so cardinality drives cost rather than volume, and a single label with thousands of values can multiply a month's bill without any change in how much data you send. There is also a per-active-user visualization charge, which is a downgrade from Coralogix's unlimited users. Retention beyond 30 days on the paid tier requires a custom conversation. And it is worth naming the strategic tension: the company monetizes open-source projects, and that model shapes where investment goes, particularly around newer AI-assisted features.
Pricing model
The paid tier carries a $19 monthly platform fee plus independent meters: roughly $6.50 per 1,000 active series at standard resolution (higher for high-resolution metrics), logs and traces at about $0.45 per GB split across processing and write components with a separate per-GB monthly retention charge beyond the included window, and around $8 per active visualization user with three included. Enterprise contracts carry a five-figure annual minimum. Verify current rates on Grafana Labs' own pricing page, because the meters have been repackaged more than once.
The multi-meter structure means one decision, like raising log verbosity or shortening a scrape interval, shows up as several separate line items. For a log-heavy Coralogix workload, the per-GB log rate is the number to model first, and it is meaningfully higher than Coralogix's published log rate, which is the trade you make for open components underneath.
The verdict
Pick Grafana Cloud if your team already lives in Prometheus and Grafana and values being able to walk away with your dashboards. Think twice if you want one query language, unlimited seats, or a single meter you can explain to finance in one sentence.
8. Honeycomb
Honeycomb came out of a specific frustration with dashboard-driven monitoring at scale, and it is built around high-cardinality event analysis rather than log search. For a Coralogix user whose actual complaint is that reaching a root cause takes too many clicks, it is the most interesting product on this list, and also the least direct replacement.
What's good
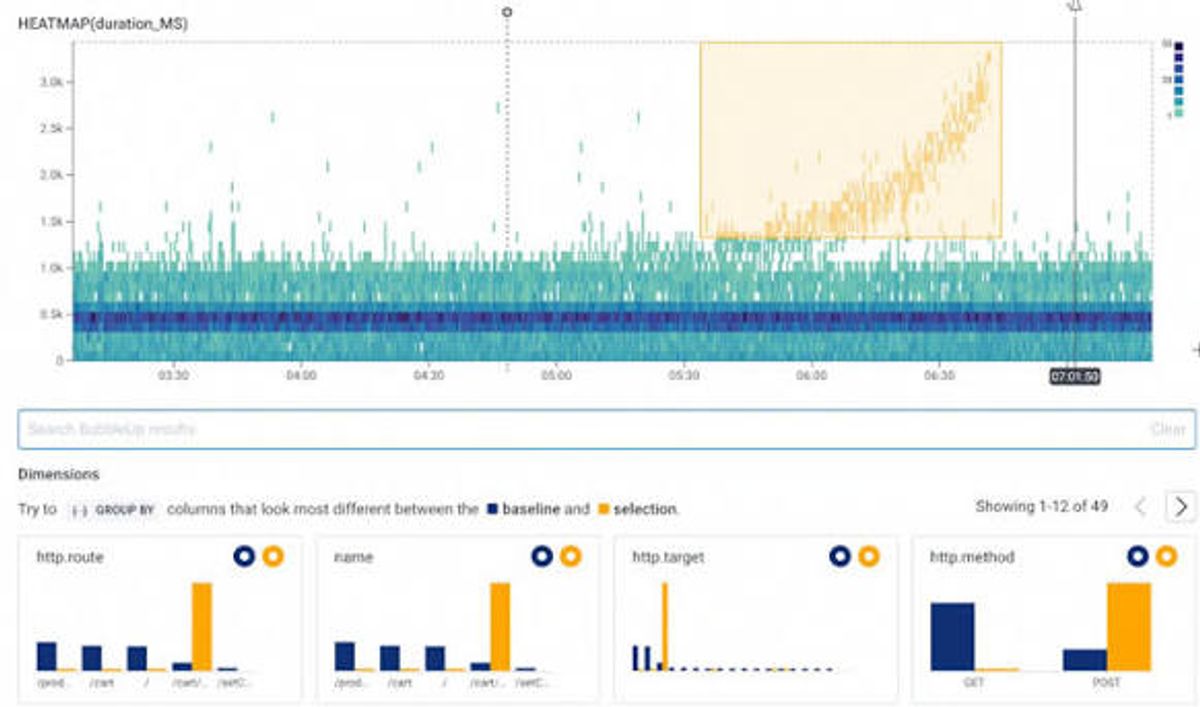
BubbleUp is a genuinely different debugging tool. Point it at a slow or failing set of requests and it tells you what is statistically different about them. Nothing else on this list does that as well, and for microservice interaction bugs it changes how an investigation feels. That works because context per event is unlimited: you can attach effectively any dimension to an event and slice by it, which is exactly the workload that breaks series-based metrics pricing elsewhere. Ingestion is OTLP-native, and Refinery gives you tail-based sampling you control, a more sophisticated volume lever than head-based sampling. Private Cloud on AWS covers teams with residency requirements.
The catch
The center of gravity is traces and events, and logs are handled as events on the same meter. If your Coralogix bill is 80% logs, mapping that workload onto an event model is not a translation exercise, it is a rethink, and the cost profile can surprise you. Incoming OTLP data is converted into Honeycomb's event model, so instrumentation stays portable while stored data does not. There is no SIEM, and no archive-in-your-bucket equivalent.
Pricing also moved against existing users. As Honeycomb's own 2026 Pro plan changes document, the Pro per-event rate went to $3.00 per million events from July 1, 2026, up from $1.30 on legacy plans, alongside a repackaging that bundles time series metrics and the Intelligence features. Legacy plans run through a grace period ending December 31, 2026. If you model Honeycomb on numbers you read last year, you will be wrong by more than 2x.
Pricing model
Billing is primarily events per month, with metric data points metered separately. The free tier includes 20 million events per month, Pro runs across four tiers topping out at 750 million events per month at the $3.00 per million rate, and Enterprise adds Private Cloud and custom terms. See the Honeycomb pricing page.
Like Dash0, this is a record-count model, so the same arithmetic applies: verbose, richly annotated events are economically fine, and chatty low-value events are not. Unlike Dash0, everything shares one meter, so logs-as-events compete with trace volume for the same budget, and teams sending metrics as events should restructure rather than pay event rates for metric data.
The verdict
Pick Honeycomb if distributed-systems debugging is the dominant use case and your team thinks in traces. Most Coralogix shops that adopt it end up running it alongside a log platform rather than instead of one, and that is a reasonable outcome rather than a failure. Dash0's Honeycomb alternatives piece goes further on the event model.
9. OpenSearch, Prometheus and Jaeger (self-managed)
The do-it-yourself path belongs on this list because a meaningful number of Coralogix users are there for cost reasons, and self-managed OpenSearch for logs, Prometheus for metrics, and Jaeger for traces removes the vendor from the equation entirely.
What's good
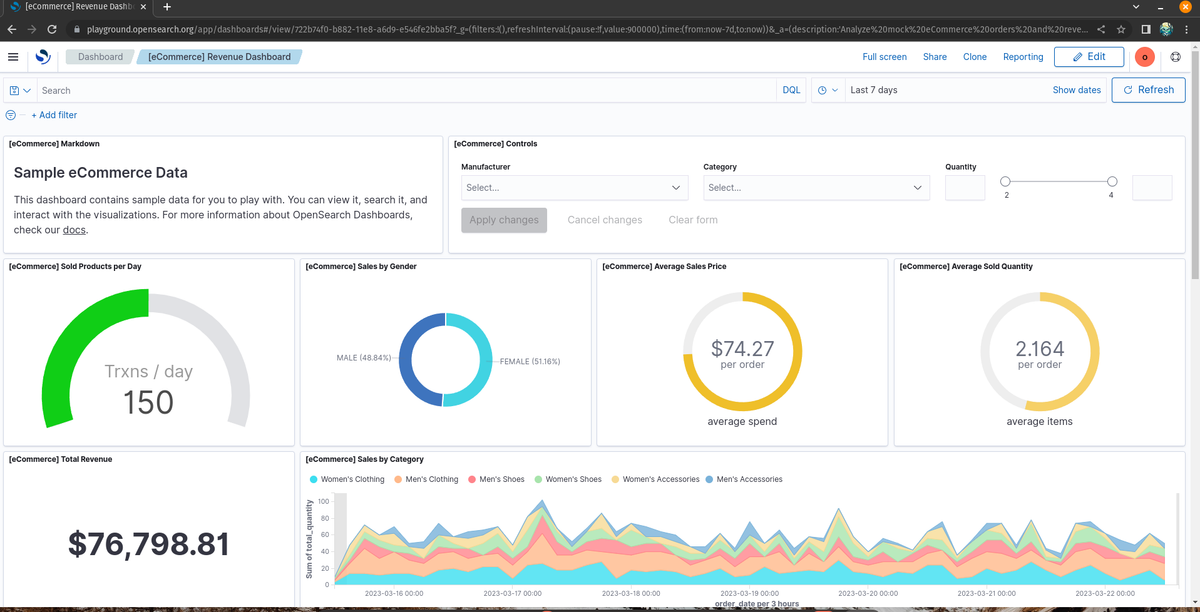
There is no license cost and no metering. Your spend maps to compute, storage, and engineering time; nobody bills you per gigabyte, per record, per seat, or per query, and no quota blocks ingestion at an inconvenient hour. Retention is entirely on your terms, too. Index lifecycle policies, hot-warm-cold tiering, and snapshots to object storage let you rebuild the thing you liked about Coralogix's archive, in a bucket you already own, with exactly the retention your compliance team asked for. And the ecosystem and hiring pool are real advantages: exporters and integrations exist for nearly everything, PromQL is a skill people already have, and OpenSearch ships alerting and security analytics plugins if you need detection rules without buying a SIEM.
The catch
You are now operating a log platform, and OpenSearch at volume is a real job. Shard sizing, index templates, hot node capacity, rollover policies, upgrades, and the on-call rotation for the cluster all land on your team, and cluster problems tend to arrive at the same time as the incidents you need the cluster to explain. Three projects also mean three query surfaces and three sets of operational knowledge, so the query-language consolidation you wanted from leaving DataPrime does not happen here either.
You also give up the things Coralogix does before storage: in-stream parsing and enrichment, machine-learning anomaly alerts, and the routing policy layer. You can rebuild pieces of that with an OpenTelemetry Collector pipeline and OTTL, but that is a project with an owner and a roadmap, not a configuration screen.
Pricing model
The software is free. Your costs are infrastructure plus the engineering time to build, scale, and run it, and the second one is what teams underestimate. A senior platform engineer maintaining this stack is a five-to-six-figure annual cost that appears on no pricing page, and it scales with your ambition rather than with your data volume.
The appeal is that nothing about the model is adversarial. There is no cardinality surcharge, no seat tax, no indexing decision made under financial pressure, and no renewal negotiation. The risk is an under-resourced stack that degrades exactly when you need it, and capacity planning discipline is the only thing standing between you and that outcome.
The verdict
Pick the self-managed stack if you have a platform team with real capacity, data residency or cost control outweighs convenience, and you are comfortable owning the pager for your own observability. Avoid it if observability is not where you want to spend headcount, or if the in-stream processing and anomaly detection were doing more work in your Coralogix setup than you realized.
Which tool fits your situation
The right answer depends less on which platform is best and more on which Coralogix property you cannot live without.
If indefinite retention in your own bucket is non-negotiable, treat it as the first filter. Self-managed OpenSearch with snapshot policies gets closest, Elastic self-managed keeps the data in your infrastructure, and Sumo Logic's free-ingest model is the most economical hosted shape for write-heavy long retention. The 30-day windows on Dash0 and the short defaults on New Relic will not satisfy a multi-year audit requirement without a second destination.
If your Coralogix account includes Cloud SIEM or MDR, your shortlist is Datadog, Elastic, Sumo Logic, or OpenSearch with its security analytics plugin. Everything else means running two vendors, which is a legitimate choice but should be a deliberate one.
If the reason you are leaving is that developers avoid the tool because DataPrime and the screen layout are too much friction, look at what your team already knows. Grafana Cloud is the obvious fit for a Prometheus-fluent team, and Dash0 if you want PromQL across all three signals rather than three languages. Both are a smaller learning tax than ES|QL, DQL, or NRQL.
If you want one vendor for observability and security and budget management is a solved problem, Datadog is still the broadest product on the market, with Dynatrace the better pick when automated root-cause analysis at enterprise scale justifies the premium and unlimited seats matter.
If your telemetry is mostly logs and you want per-GB math you can model in a spreadsheet without changing units, New Relic is the simplest translation from where you are, provided a small number of engineers need full access.
If investigations are the bottleneck rather than storage, adopt Honeycomb for the debugging workflow and keep something else for log volume. Running two tools deliberately beats forcing one tool to do a job it was not built for.
And if you have standardized on OpenTelemetry, want your data stored in the shape you sent it, and would rather pay a few published per-signal rates than manage pipeline tiers and unit conversions, Dash0 fits that profile, with the retention and SIEM caveats above taken seriously rather than waved away.
Final thoughts
The alternatives to Coralogix sort into four camps, and each represents a different bet. The commercial full-stack suites (Datadog, Dynatrace, New Relic) sell breadth and polish in exchange for proprietary data models and bills with several independent axes. The search-and-log platforms (Elastic, Sumo Logic) sell depth on the workload Coralogix is strongest at, with retention and query-time meters that need their own modeling. The open-source-based options (Grafana Cloud, and the self-managed OpenSearch stack) sell portability and control at the price of multiple query languages and, in the self-hosted case, real operational load. The OpenTelemetry-native and event-based platforms (Dash0, Honeycomb) sell a smaller, more coherent surface and give up some breadth to get it.
What ties them together is that this is a units decision and a retention decision, not a feature decision. Features converge. What you live with at renewal is the billing dimension and the shape your data is stored in. Coralogix bet on per-gigabyte ingest plus an archive you own, which is a good bet for very high volume, very long retention, and teams willing to operate pipeline policies. If that bet stopped fitting because your data is many small records rather than fewer large ones, because your engineers want a query language that transfers, or because you would rather your OpenTelemetry attributes drive correlation than be mapped into an application-and-subsystem model, then a per-signal, OTel-native platform is the shape worth testing. That is the specific gap Dash0 addresses, and the honest trade is 30-day retention for spans and logs, no SIEM, and a younger integration catalog.
Whatever you shortlist, run your own telemetry through it for a week and count records, not gigabytes. Rate cards are starting points.
Sign up for a free Dash0 account with 14 days of unlimited access to test it against your real workloads.
FAQ
Why do teams look for Coralogix alternatives? The recurring reasons are the unit-based pricing model, which requires converting gigabytes across pipeline tiers before anyone can forecast spend, the learning curve of the DataPrime query language and the platform's screen layout, APM depth compared to dedicated application performance monitoring vendors, and the daily quota behavior, where exceeding your plan without a pay-as-you-go arrangement means data is temporarily blocked until 00:00 UTC.
Which alternative keeps data in my own cloud storage the way Coralogix does? No hosted platform on this list reproduces it exactly. Self-managed OpenSearch and self-managed Elastic keep everything in infrastructure you control, Honeycomb offers Private Cloud inside your own AWS account, and Datadog can archive logs to a bucket you own, though rehydrating archived logs puts them back through indexing and is a billable action, so confirm current terms. Hosted platforms that retain data for 30 days by default, including Dash0, need a separate archival destination for multi-year compliance retention.
Is per-GB pricing cheaper than per-event or per-record pricing? It depends on your average record size, and the crossover is easy to calculate. One gigabyte of 500-byte log lines is about 2 million records, which costs $0.42 at Coralogix's published log rate and $1.20 at $0.60 per million records. One gigabyte of 5 KB structured events is about 210,000 records, which costs $0.42 per GB and roughly $0.13 per record. Short and chatty favors per-GB. Verbose and structured favors per-record.
Do my DataPrime queries, dashboards, and alerts migrate? No. Query syntax, dashboard definitions, parsing rules, and alert logic are platform-specific and get rebuilt on any of these alternatives, which is the real cost of a migration and is usually larger than the ingest re-plumbing. The only mitigation is choosing a destination whose artifacts are portable next time: PromQL queries, Perses or Grafana dashboard definitions, and OTTL processing rules survive a future move in a way proprietary equivalents do not.
Does leaving Coralogix mean giving up SIEM? For some destinations, yes. Datadog Cloud SIEM, Elastic Security, Sumo Logic Cloud SIEM, and the OpenSearch security analytics plugin cover that ground. Grafana Cloud, Honeycomb, and Dash0 do not, so a Coralogix account using Cloud SIEM or Snowbit MDR should plan for either a security-capable platform or a dedicated security vendor alongside the observability one.