If you're comparing Datadog vs New Relic, you're really comparing two different ways to get billed for the same telemetry. Datadog charges per host, per product, and per event. New Relic charges per gigabyte and per engineer, with an optional compute meter for its premium features. Everything else, from which team gets a login to how much you think before adding a Kubernetes node, follows from that difference.
Both are mature, capable platforms. Both have strong application performance monitoring (APM), log management, and infrastructure monitoring, and both now accept OpenTelemetry data. So the New Relic vs Datadog question is rarely "which one can do X?" It's "which one gets expensive in the way my organization grows?"
This guide compares pricing (with a worked example), APM, logs, infrastructure and Kubernetes monitoring, OpenTelemetry support, and what a migration between the two actually involves. Prices are public list prices as of September 2026. Your negotiated rate will differ, sometimes a lot.
Datadog vs New Relic at a glance
Short version: New Relic is usually cheaper when you have many hosts and few engineers who need full access. Datadog is usually cheaper when you have a small, stable fleet and a large team that all needs to debug production.
| Datadog | New Relic | |
|---|---|---|
| Main billing units | Hosts, containers, GB, indexed events, custom metrics (by cardinality or, opt-in, by metric name) | GB ingested, user seats (or compute), optional Advanced Compute |
| Free tier | Infrastructure for up to 5 hosts, 1-day metric retention | 100 GB/month, 1 full platform user, unlimited basic users |
| Infrastructure | $15/host/month (Pro, annual) | Included in data ingest |
| APM | $31/host/month on top of infrastructure (annual) | Included in data ingest |
| Logs | $0.10/GB ingest + $1.70 per million events indexed (15-day) | $0.40/GB (Original Data) |
| Users | Unlimited, no seat fee | Basic free, core $49, full platform $99 to $418.80 |
| Query language | Product-specific query syntaxes, plus DDSQL (SQL) for cross-dataset analysis | NRQL (SQL-like) across all data, plus ANSI SQL via Lens |
| OpenTelemetry | OTLP accepted via Agent, Collector exporter, or direct intake | OTLP endpoint, OTel data stored alongside agent data |
Sources: Datadog pricing, New Relic pricing.
Datadog vs New Relic pricing
The pricing models point in opposite directions. Datadog's bill grows with your infrastructure. New Relic's bill grows with your data volume and your headcount.
How Datadog pricing works
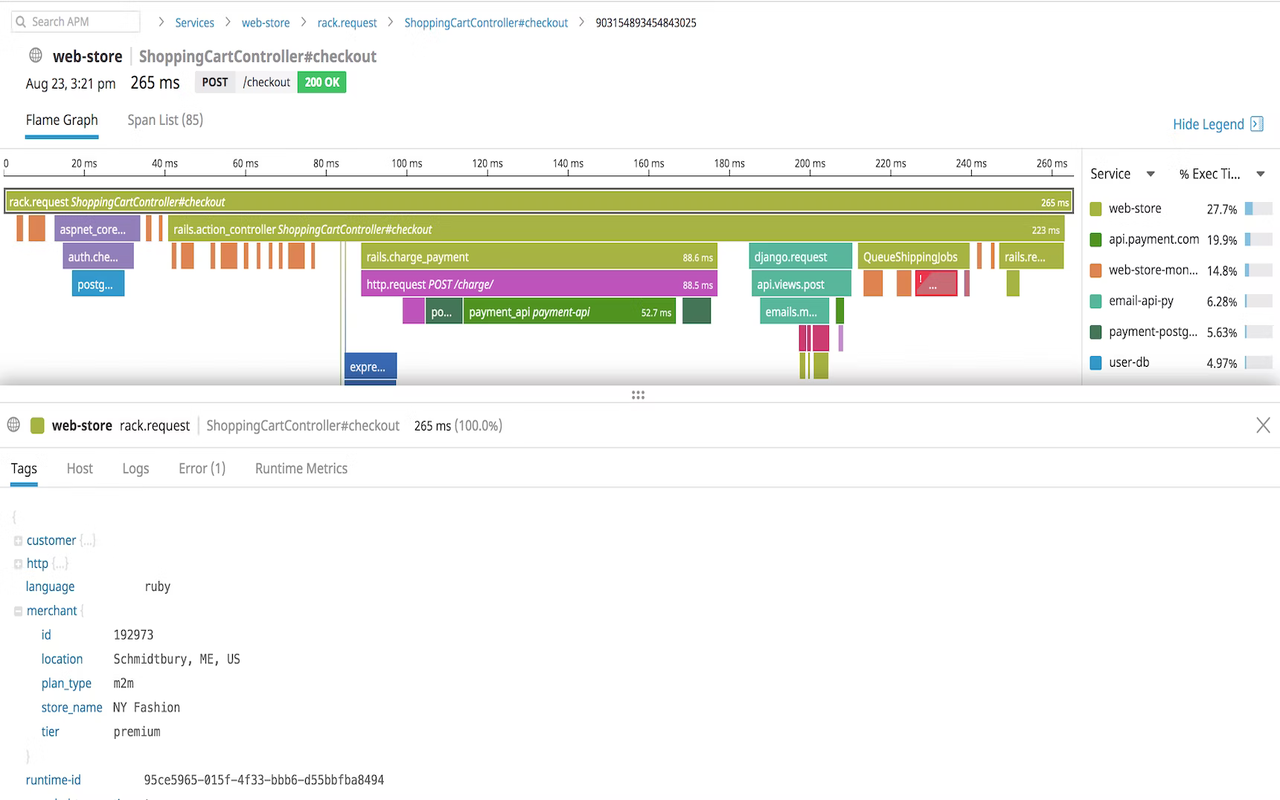
A Datadog APM trace view. Every host sending these traces is billed as an APM host.
Datadog sells each product as its own SKU. Infrastructure Monitoring is $15 per host per month on Pro ($18 on-demand) and $23 on Enterprise. A host is any VM, physical server, or Kubernetes node. Each Pro host includes 5 containers and 100 custom metrics; beyond that you pay for extra containers and metrics.
APM adds $31 per host per month when paired with Infrastructure, or $36 standalone. Each APM host includes 150 GB of ingested spans and 1 million indexed spans per month, pooled across hosts. Log Management is split in two: $0.10 per GB to ingest, then $1.70 per million log events to index with 15-day retention. Flex Logs storage is much cheaper for logs you rarely query.
Users cost nothing. That's the part Datadog gets right, and it matters more than people think. You can give every engineer, support lead, and product manager a login without a procurement conversation.
The catch is on-demand pricing. Usage above your annual commitment is billed at on-demand rates, and APM on-demand is $48 per host with Infrastructure attached, not $31. A traffic spike that autoscales your cluster shows up on the invoice.
How New Relic pricing works
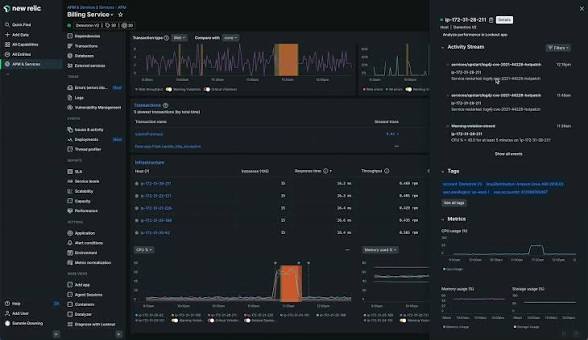
A New Relic APM summary page. What you pay for here is the gigabytes of data behind the page and the seat of whoever opens it.
New Relic dropped host-based pricing years ago. You pay for data ingested: the first 100 GB per month is free, then $0.40 per GB on Original Data or $0.60 per GB on Data Plus, which adds up to 90 extra days of retention and compliance features. There's no per-host or per-container fee.
The second meter is people. Basic users are free and can view dashboards, run queries, and see alerts. Core users are $49 per month and get logs, error tracking, and IDE integration. Full platform users get everything, including APM, distributed tracing, and infrastructure views. On Standard, the first full platform user is $10 and each additional one is $99, capped at five. Past five, you move to Pro at $349 per user per month on an annual commitment or $418.80 pay-as-you-go.
That jump from Standard to Pro is the cliff to watch. Your sixth full platform user doesn't cost $99. It moves every full platform seat to $349. New Relic also offers a compute-based model on Pro and Enterprise that replaces user seats with compute capacity units, which is worth asking about if you have a large team. Separately, premium capabilities such as Transaction 360, Security RX, and New Relic AI run on Advanced Compute, a consumption meter billed on top of data and users. Admins can switch those features off, but if you use them, New Relic has a third meter.
A worked example
Here's a realistic mid-size setup: 20 Kubernetes nodes running instrumented services, 500 GB of logs per month (roughly 500 million events at about 1 KB each), and another 300 GB of metrics and traces. Ten engineers need to debug production.
| Line item | Datadog (annual list) | New Relic Standard (5 full + 5 core users) | New Relic Pro (10 full users) |
|---|---|---|---|
| Infrastructure (20 hosts) | $300 | Included | Included |
| APM (20 hosts) | $620 | Included | Included |
| Logs | $50 ingest + $850 indexing | Included in data | Included in data |
| Data ingest (800 GB, 100 GB free) | n/a | $280 | $280 |
| Users | $0 | $406 full + $245 core | $3,490 |
| Monthly total | $1,820 | $931 | $3,770 |
Three things jump out. First, if five of your engineers can live with core seats, New Relic is roughly half the price of Datadog here. Second, if all ten need full access, New Relic costs about twice as much. Third, Datadog's biggest line item is log indexing, not hosts. Index only the 30% of logs you actually search and the Datadog total drops to about $1,225.
Now double the cluster to 40 nodes and keep the team the same. Datadog adds about $920 per month for infrastructure and APM alone. New Relic adds whatever the extra telemetry costs at $0.40 per GB, often a few hundred dollars. If your fleet grows faster than your team, New Relic's model ages better. If your team grows faster than your fleet, Datadog's does.
These are list prices. Both vendors discount heavily on multi-year commits, and nobody at scale pays list. Treat the table as a way to see which meter will hurt you, not as a quote.
APM and distributed tracing
Both APM products are good. Honestly, if you put a senior engineer in front of either one during an incident, they'll find the slow service. The differences are in how traces are kept, what extras come bundled, and how you query the data afterward.
Datadog's tracing model separates ingestion from retention. Every span you send is searchable live for 15 minutes, and RED metrics (requests, errors, duration) are computed from 100% of traffic regardless of sampling. You then choose which spans to index for 15 days using retention filters. It works well, but it means someone on your team owns a set of filters, and the trace you need next week may not be the one you kept. Datadog also bundles more code-level tooling into higher tiers: APM Pro adds Data Streams Monitoring for Kafka and RabbitMQ, and APM Enterprise adds the Continuous Profiler.
New Relic's standard distributed tracing uses head-based sampling in its language agents. If you want sampling decisions made after a trace completes, Infinite Tracing does tail-based sampling in New Relic's cloud, but it requires Pro or Enterprise and isn't available in every region. The bigger New Relic advantage is NRQL. Every span, transaction, and log line lands in the same event store, and the same SQL-like language runs across them everywhere in the product by default. Datadog's product explorers each use their own search syntax. DDSQL adds SQL across logs, metrics, spans, and more, but most Datadog dashboards and monitors aren't built on it.
One pricing note that affects APM design: on Datadog, an APM host is any host that sends traces, including a host running an OpenTelemetry Collector. On New Relic, tracing cost is mostly about how many gigabytes of spans you send, plus Advanced Compute if you use premium views like Transaction 360. If you run many small services on many nodes, that difference compounds quickly.
Log management
Logs are where the two pricing models diverge the most, and where most surprise bills come from.
Datadog's approach is called Logging without Limits. You ingest everything for $0.10 per GB, then decide what to index. Indexed logs cost $1.70 per million events for 15-day retention, with cheaper 3- and 7-day tiers and pricier 30-day ones. Logs you don't index can go to an archive in your own S3, Azure Blob, or Google Cloud Storage bucket at no extra forwarding cost, and you can rehydrate them later for $0.10 per compressed GB scanned. Flex Logs adds a long-term tier from $0.05 per million events stored, though it doesn't support monitors.
This gives you a lot of control. It also gives you a lot of work. Someone has to design index filters and exclusion rules, and events are counted per line, so chatty services with tiny log lines can cost more than you'd guess from their gigabyte volume.
New Relic treats logs like any other data. You pay $0.40 per GB, logs are retained for 30 days by default (120 days on Data Plus), and everything you send is queryable with NRQL. There's no separate indexing decision. Live archives extend storage up to seven years if you need it for compliance. The simplicity is real, but you give up Datadog's ability to ingest cheaply and index selectively. If you send 5 TB of debug logs, you pay for 5 TB.
Both vendors are now previewing ways to query logs without ingesting them. New Relic's Federated Logs queries logs where they sit in S3. Datadog's Federated Logs queries external stores such as Databricks and ClickHouse, and its BYOC Logs runs Datadog log storage in your own infrastructure (DASH 2026 announcements). The federated options are still in preview, so don't build a cost plan on them yet.
My take: New Relic is easier to reason about for logs. Datadog can be cheaper at high volume if you have the discipline to index only what you search. Most teams overestimate that discipline.
Infrastructure and Kubernetes monitoring
Datadog built its reputation on infrastructure monitoring, and it shows. The Agent is mature, host and container maps are fast, and with 1,000+ integrations you'll rarely find a database, queue, or cloud service it can't read. Metrics on Pro are kept at full resolution for 15 months.
In Kubernetes, the bill tracks your node count. Each node is a host, each host includes 5 containers on Pro (10 on Enterprise), and extra containers cost $0.002 per hour. Dense clusters that pack 30 or 40 pods per node pay for the overflow. Custom metrics are the other trap: anything that doesn't come from a built-in integration counts against your 100-per-host allotment, including everything scraped by the OpenMetrics integration. If you already rely on Prometheus exporters, budget for this before you sign.
New Relic's infrastructure agent and Kubernetes integration cover the same ground: nodes, pods, containers, cluster events, and control-plane health, plus eBPF-based, no-code instrumentation. Its integration catalog is smaller than Datadog's, but it covers the mainstream stack well. Because pricing is per GB, a 200-node cluster doesn't cost ten times a 20-node cluster. It costs whatever those nodes emit. Prometheus data can go straight in through remote write and is billed as regular data.
If infrastructure depth is your top priority, Datadog is still slightly ahead. If your cluster size swings a lot with autoscaling, New Relic's pricing is easier to live with.
OpenTelemetry support
Both vendors accept OpenTelemetry Protocol (OTLP) data in 2026. Neither was built around it. Each translates OpenTelemetry into its own data model, and that translation is where the friction lives.
Datadog gives you three routes. You can run the upstream OpenTelemetry Collector and export over OTLP HTTP to https://otlp.<your-site>, run the Datadog Distribution of OTel Collector (DDOT) bundled inside the Datadog Agent, or send OTLP to the Agent's own receiver. The upstream route works, but look at what it asks of you. To light up the APM service pages, you configure a span_metrics connector with around 40 dimensions so Datadog can infer host tags, peer services, operation names, and resource names from your spans. Metrics must be delta temporality, because Datadog's OTLP metrics intake accepts only delta. You also need a resource_detection processor so Datadog can resolve hostnames, and a dd-otel-metric-config header if you want resource attributes turned into metric tags, which is off by default. Datadog publishes a feature compatibility table because some features still work best, or only, with its own tracing libraries and Agent.
New Relic is more direct. It exposes native OTLP endpoints (https://otlp.nr-data.net in the US, with EU and JP equivalents), recommends OTLP as the preferred way to send OpenTelemetry data, and accepts gRPC and HTTP, with HTTP/protobuf recommended as the default. OTel services show up in the APM UI and land in the same NRQL-queryable store as agent data. There are rules to follow: a 1 MB maximum payload, attribute values capped at 4,095 characters, and a strong recommendation to use delta temporality, since cumulative metrics increase ingest volume. That last point matters because on New Relic, volume is the bill.
One pricing trap is specific to Datadog. Your OpenTelemetry metrics are mostly custom metrics, and custom metrics are billed per unique combination of metric name and tag values, so cardinality turns directly into cost. An http.server.request.duration histogram tagged with http.route, http.request.method, and http.response.status_code multiplies fast. (Metrics from supported OpenTelemetry receivers, like host metrics, are not billed as custom.) Since June 2026, Datadog also offers opt-in Metric Name pricing, which bills per metric name and datapoint volume instead of per tag combination, so check which model your contract uses. On New Relic the same histogram costs what it weighs in gigabytes.
My honest read: New Relic's OpenTelemetry story is cleaner today, and Datadog's is catching up quickly. Datadog now markets itself as OpenTelemetry-native, and since mid-2026 it accepts data from the standard OTLP exporter and runs APM directly on OpenTelemetry spans. The setup above still shows how much Datadog-specific configuration sits between your data and its UI. In both cases, OpenTelemetry is an input format being mapped onto a proprietary backend. That's fine if you know it going in. It's a problem if you adopted OpenTelemetry specifically to avoid being locked into one vendor's model.
Migrating between Datadog and New Relic
Whichever direction you're moving, the telemetry is the easy part. Dashboards, alerts, and habits are what take months.
Replace proprietary agents with OpenTelemetry first
If you're on Datadog tracing libraries or New Relic language agents, the single best move is to switch to OpenTelemetry SDKs before you switch vendors. You re-instrument once, and every future migration becomes a Collector config change. For a step-by-step walkthrough of the Datadog side, see Migrating from Datadog to OpenTelemetry. Set service.name, service.version, and deployment.environment.name as resource attributes everywhere. Datadog maps these to its unified service tags, and New Relic uses service.name to build its service entities.
Run both backends in parallel
The Collector can send the same data to both vendors at once. That lets you compare dashboards side by side and cut over only when the new one is trusted. The following config receives OTLP from your apps, adds host and resource attributes, and exports traces, metrics, and logs to both New Relic and Datadog. It converts metrics to delta temporality, which Datadog requires and New Relic recommends.
1234567891011121314151617181920212223242526272829303132333435363738receivers:otlp:protocols:grpc:endpoint: 0.0.0.0:4317http:endpoint: 0.0.0.0:4318processors:resource_detection:detectors: [env, system]cumulativetodelta: {}exporters:otlp_http/newrelic:endpoint: https://otlp.nr-data.netheaders:api-key: ${env:NEW_RELIC_LICENSE_KEY}otlp_http/datadog:endpoint: https://otlp.${env:DD_SITE}headers:dd-api-key: ${env:DD_API_KEY}dd-otel-metric-config: '{"resource_attributes_as_tags": true}'service:pipelines:traces:receivers: [otlp]processors: [resource_detection]exporters: [otlp_http/newrelic, otlp_http/datadog]metrics:receivers: [otlp]processors: [resource_detection, cumulativetodelta]exporters: [otlp_http/newrelic, otlp_http/datadog]logs:receivers: [otlp]processors: [resource_detection]exporters: [otlp_http/newrelic, otlp_http/datadog]
Two caveats. First, this is the minimum. For Datadog's APM and infrastructure views to populate, add the span_metrics connector (with a forward connector so metrics are computed before any sampling) from Datadog's reference configuration. Second, older Collector releases name the exporter otlphttp rather than otlp_http. Check which name your version uses. And remember that you're paying both vendors during the overlap, so keep it to weeks, not quarters.
Rebuild dashboards and alerts deliberately
There's no reliable automatic translation between NRQL and Datadog's query syntax. A NRQL query like SELECT percentile(duration, 95) FROM Transaction FACET appName becomes a Datadog metric query over trace-derived metrics, and the metric names differ depending on whether data came from an agent or from OpenTelemetry. Treat the migration as a chance to delete the half of your dashboards nobody opens. Most teams find they only need to rebuild a fraction.
Plan for what doesn't move
Historical data stays behind. Neither vendor imports the other's stored telemetry, so keep read access to the old account until your retention needs expire. Contract timing matters too: annual commitments on either side rarely line up neatly, and Datadog's on-demand rates apply to anything above your commitment during a ramp-up.
Datadog or New Relic: which should you choose?
Pick the one whose meter matches the way you grow.
Choose Datadog if your fleet is fairly stable, many people across engineering, support, and product need full access, and you want the widest integration catalog and deepest infrastructure tooling. Go in with a plan for log indexing, custom metrics, and on-demand overages, because that's where Datadog bills drift.
Choose New Relic if you run a lot of hosts or autoscale aggressively, a small group of engineers does most of the debugging, and you want one query language over all your data. Watch the fifth-to-sixth full platform user jump, and push hard on delta temporality and log volume, since gigabytes are the whole bill.
If you're standardizing on OpenTelemetry, New Relic is the smoother landing today. Just don't mistake a good OTLP endpoint for an open backend. Your dashboards, alerts, and queries still live in a proprietary format.
A third option: an OpenTelemetry-native backend
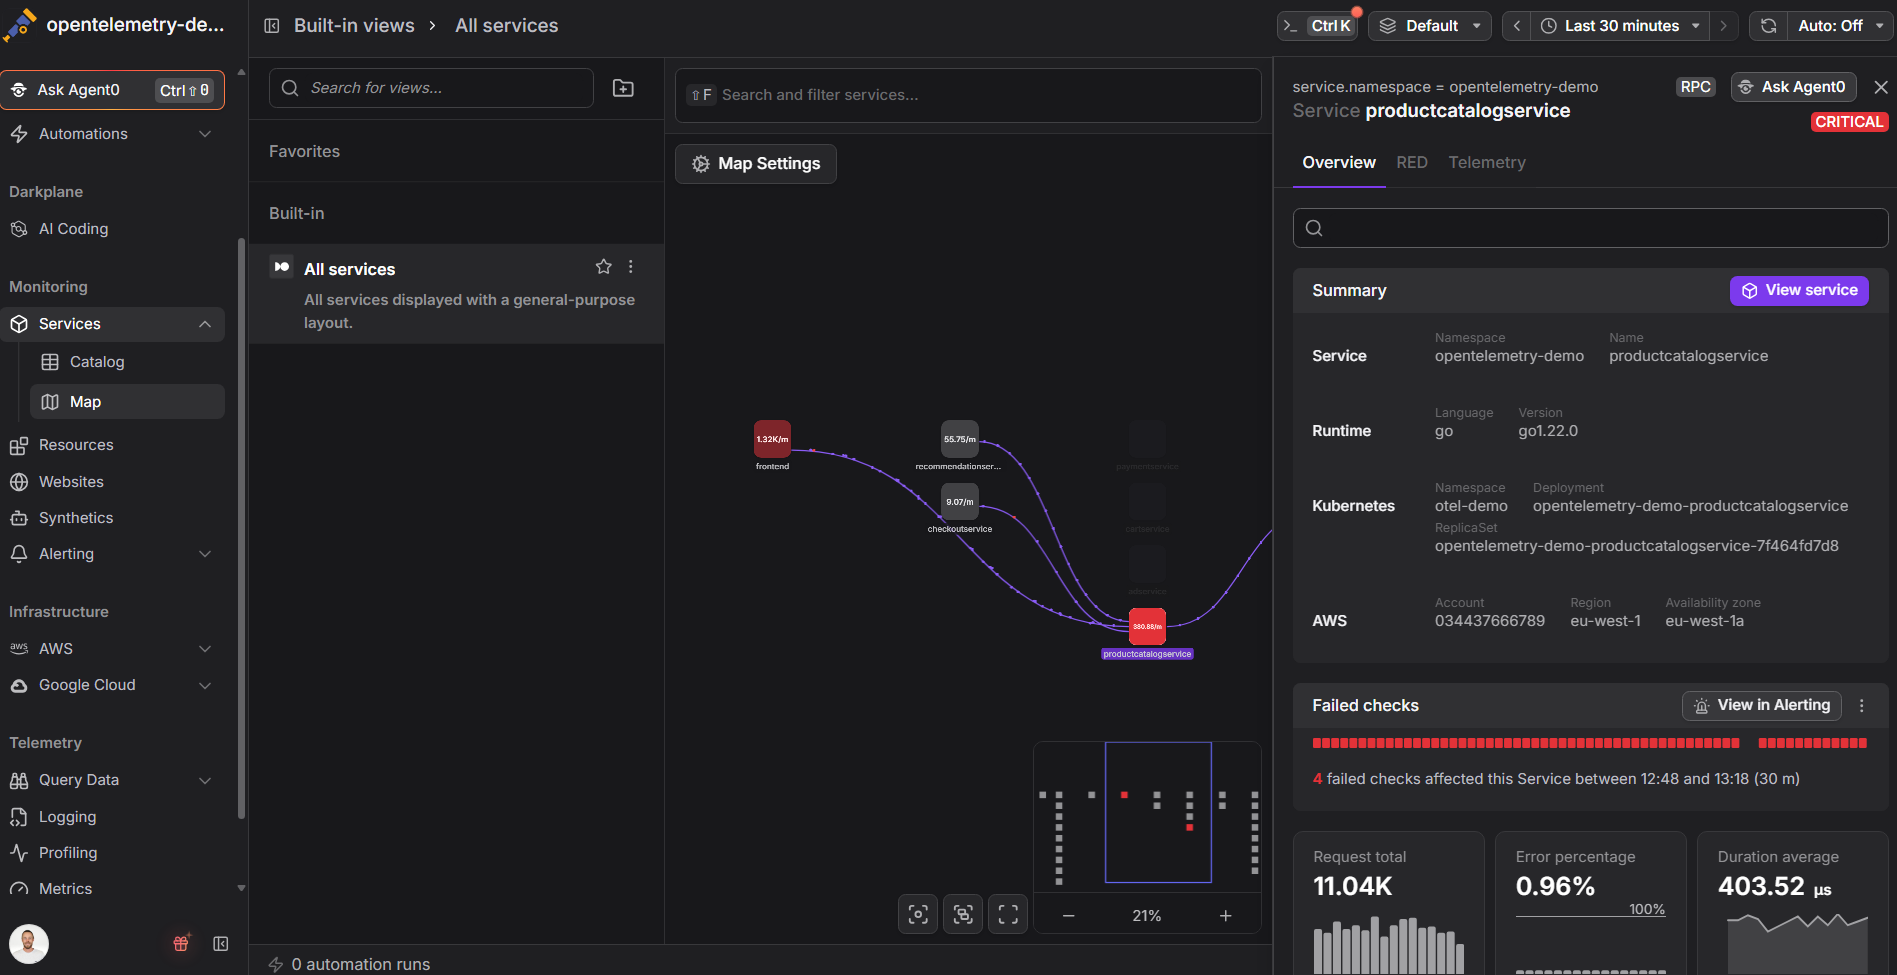
A Dash0 service view. Resource attributes keep their OpenTelemetry names instead of being mapped to tags or entities.
If the OpenTelemetry section above made you uneasy, that's the real decision hiding under Datadog vs New Relic. Both platforms accept OTLP, then reshape it into a proprietary model with its own query language, its own naming, and its own billing units. You standardized your instrumentation, but not your backend.
Dash0 takes the other approach. It's built on OpenTelemetry from the storage layer up, so resource attributes and semantic conventions are kept as they arrive instead of being mapped into tags or entities. You query metrics with PromQL, and aggregate logs and spans with it too through synthetic metrics. You build dashboards as code with Perses, and deploy collection in Kubernetes with the Dash0 Operator. Pricing counts signals, not hosts, seats, or gigabytes: $0.20 per million metric data points and $0.60 per million spans or log records, ingestion and storage combined, with no per-user fee for the core platform (Agent0 usage is metered separately in credits). You can add attributes without watching a GB meter, and adding a node or an engineer doesn't change the rate.
On top of that data, Agent0 is Dash0's AI agent. It investigates incidents end to end, proposes code fixes as pull requests, answers questions about your telemetry, and builds queries, dashboards, and alert rules. It follows progressive autonomy: agents start by proposing actions for a human to approve, and take on more as you trust them. That only works because the data underneath is normalized to OpenTelemetry conventions rather than reshaped per vendor.
Datadog and New Relic are credible, mature products, and plenty of teams are well served by either. But if portability is why you adopted OpenTelemetry, it's worth evaluating a backend that keeps your data in that format.
Final thoughts
The Datadog vs New Relic decision comes down to which meter you can control. Datadog bills your infrastructure: hosts, containers, indexed log events, and custom metrics. New Relic bills your data and your people: gigabytes ingested and full platform seats, with a sharp jump after the fifth user, plus Advanced Compute if you turn on its premium capabilities. Feature gaps between the two are small enough that pricing shape should drive the choice.
Before you sign with either, do three things. Pull a month of real usage (host count, log events, GB ingested, and who actually debugs production) and run it through both pricing pages. Move your instrumentation to OpenTelemetry SDKs so the next switch is a Collector change, not a rewrite. And decide whether you want an OTLP endpoint on a proprietary backend or a backend that's OpenTelemetry-native.
For more on that last question, read the OpenTelemetry Collector documentation, the OpenTelemetry semantic conventions, and Dash0's guide to avoiding vendor lock-in.