If you run Datadog and are looking at Honeycomb, you've probably heard that Honeycomb handles high cardinality and Datadog doesn't. That was a fair summary a few years ago. Today both tools let you search detailed, high-cardinality attributes on spans. The gap shows up when you investigate something that happened more than a few minutes ago, and when you look at the bill.
Honeycomb keeps every event you send queryable on any attribute for 60 days and charges per event, so you control cost by deciding how much to sample before ingest. Datadog's Trace Explorer lets you search all ingested spans for 15 minutes, then only the spans your retention filters kept. Its billing uses a different unit for each product. Cardinality also means different things there depending on where it lives: on spans it's mostly a question of what stays searchable, while on metrics, under Datadog's default cardinality-based pricing, each new tag value combination is a billable custom metric.
This comparison covers what you can query in each tool and for how long, what makes each bill grow, what you give up in Datadog by sending only OpenTelemetry data, and which artifacts lock you in on either side. It ends with guidance on whether Honeycomb should replace Datadog, run next to it, or stay off your list. The short version: Honeycomb is the stronger specialist for exploratory debugging of distributed systems, Datadog wins on platform breadth, and running both is a reasonable answer.
Honeycomb vs Datadog at a glance
| Dimension | Honeycomb | Datadog |
|---|---|---|
| Queryability window | Every ingested event, any attribute, 60 days | All ingested spans for 15 minutes; after that, only spans kept by retention filters (15 or 30 days) |
| High-cardinality debugging | BubbleUp compares a selection against the baseline across every attribute | Watchdog Insights and Tag Analysis surface attributes linked to outliers |
| Sampling | Tail-based sampling before ingest (Refinery or Telemetry Pipeline); counts estimated by weighting each event by its sample rate | Head-based by default, tuned with Ingestion Control and retention filters; tail sampling through the DDOT Collector |
| OpenTelemetry | Proprietary SDKs retired; OpenTelemetry is the recommended instrumentation path | Four OTLP ingest paths; some features need the Datadog SDK or Agent |
| What makes the bill grow | Event volume and metric data points | Hosts, custom metrics (tag combinations, or metric names and data points on Metric Name pricing), indexed volume, OTLP ingest volume and products adopted |
| Breadth | Traces, logs, metrics, SLOs, frontend observability | Observability, security, digital experience, delivery, incident response; more than 1,000 integrations |
How each tool stores and queries your data
In Honeycomb, every event you send stays queryable on any attribute for 60 days. In Datadog, every ingested span is searchable for 15 minutes in Live Search. After that, you can query only the spans your retention filters kept, for 15 or 30 days depending on the filter. You don't need to turn attributes into facets before you can search them.
Honeycomb: wide events, any attribute, 60 days
Honeycomb stores traces and logs as structured events in a purpose-built columnar store called Retriever. You don't define a schema or declare indexes in advance. Any attribute on an event can be filtered or grouped at query time, whether that's user.id, tenant.id or a build SHA. Honeycomb retains events and logs for a fixed 60 days from ingest.
Logs arrive as events like any other. Since native metrics went GA on March 11, 2026, Honeycomb stores metrics in a dedicated metrics dataset, separate from traces and logs, with 13-month retention by default.
Datadog: ingest everything, index what you choose
In Datadog APM, the Trace Explorer separates spans that were ingested from spans that were retained. Live Search shows all ingested spans for a rolling 15-minute window without sampling, and you can query any attribute on them.
After 15 minutes, only indexed spans are queryable. Retention filters decide which spans get indexed. The always-on intelligent retention filter keeps a diverse sample for 30 days, and those spans don't count toward your indexed-span usage. Spans kept by custom retention filters are retained for 15 days. Retention filters don't change what the Agent collects and sends; they decide what stays searchable.
Datadog lets you filter on attributes that aren't facets. The real limit is the indexing decision: once the Live Search window has passed, a tag that appears only on unindexed spans returns no results. Trace Queries, which match on the structure of a trace across several spans, run only on traces indexed by the intelligent retention filter or by trace-level retention filters.
Retention side by side
| Signal | Honeycomb | Datadog |
|---|---|---|
| Spans / trace events | 60 days | 15 minutes (all ingested, Live Search); 15 days (custom retention filters); 30 days (intelligent retention filter) |
| Logs | 60 days (stored as events) | Set per log index |
| Metrics | 13 months by default | Separate time-series system, billed per custom metric or per metric name (see pricing) |
The "under 20 days" figure in some comparisons is correct only for Datadog spans indexed by custom filters. Intelligent-filter spans last 30 days, and log retention depends on how you configure each index.
Debugging high-cardinality problems
BubbleUp is still the more direct way to ask "what's different about the bad requests?" Datadog now has its own answers in Watchdog Insights and Tag Analysis, and Honeycomb's "unlimited cardinality" has limits you should know about. For background on why cardinality is cheap on spans and expensive on metric labels, see what is cardinality.
BubbleUp in Honeycomb
With BubbleUp, you draw a box around a region of a heatmap, such as a band of slow requests, or click one group on a grouped line chart. Honeycomb compares every attribute in that selection against the baseline and charts the differences side by side. You don't have to guess which attribute to group by. If one customer, region or deploy version is overrepresented among the slow requests, the comparison shows it. With Honeycomb Intelligence enabled, BubbleUp Insights also ranks the fields that differ most.
Cardinality on events doesn't raise your bill, but it does have limits. Honeycomb allows 2,000 distinct fields per event, and each event must be under 1 MB. On the query side, graphs plot only the top 50 groups regardless of the query's limit, and the results table returns 100 rows by default and up to 1,000. Sending a user.id attribute is fine, but a query grouped by user.id across a million users still shows you only a slice of them.
Watchdog Insights and Tag Analysis in Datadog
Watchdog Insights flags tag key:value pairs that are overrepresented among errors or perform worse than the baseline on latency, which makes it the closest Datadog equivalent to BubbleUp. Tag Analysis identifies the tags that best explain an increase in latency or errors, such as an account.id behind a jump in errors.
For an incident older than 15 minutes, though, Trace Explorer can query only indexed spans, so your retention filters decide how much data you have left to analyze.
Query-first vs dashboards-first
The two tools also feel different day to day. In Honeycomb you start from a query: build it, look at a heatmap, select the outliers and let BubbleUp show what they share. In Datadog you usually start from dashboards, service pages and monitors, then pivot into traces or logs from there. Teams used to a dashboards-first workflow should expect an adjustment period when they move debugging into Honeycomb. The observability vs monitoring guide covers the difference between the two approaches.
Tracing and sampling as a cost lever
In Honeycomb, you control cost by sampling before ingest with Refinery or Telemetry Pipeline, and Honeycomb weights each kept event by its sample rate to estimate the original volume. In Datadog, you control cost with head-based sampling defaults, Ingestion Control and retention filters. For tail sampling, you run the processor in the DDOT Collector, which is Datadog's recommended OpenTelemetry setup.
Honeycomb: tail sampling with sample-rate weighting
Refinery is Honeycomb's tail-based, trace-aware sampling proxy. It's open source under Apache 2.0, so you can run it yourself, and Honeycomb also offers Refinery as a Service, a dedicated instance that Honeycomb runs for you. Because it decides after a trace completes, it can keep every trace with an error or high latency and sample routine traffic down. Its samplers include dynamic, rules-based, throughput-based and deterministic probability sampling.
Telemetry Pipeline runs Refinery for tail sampling alongside OpenTelemetry Collectors, and Honeycomb has added a pipeline builder UI and fleet management for those Collectors. It's billed per GB.
When an event carries a sample rate, Honeycomb uses it to weight query results, so a kept event with a sample rate of 20 counts as 20 in your graphs. With OpenTelemetry, you set that SampleRate attribute yourself. Events you drop before ingest aren't billed. That weighting gives you estimates of the original counts, not exact figures. Sampling adds uncertainty, how close the estimates land depends on your sampling strategy, and COUNT_DISTINCT doesn't compensate for sample rates at all.
Datadog: head-based defaults, Ingestion Control and retention filters
Datadog samples at the head by default. The Agent targets 10 traces per second, and a separate error sampler keeps up to 10 error traces per second per Agent. You can adjust rates remotely from the Ingestion Control page. The 10-traces-per-second target applies only to Datadog SDKs and has no effect on OpenTelemetry SDKs, which use their own sampling configuration.
Ingestion is the first lever. Retention filters are the second: they decide which ingested spans stay searchable after 15 minutes and count toward indexed-span usage. For tail sampling with OpenTelemetry, the DDOT Collector (an OpenTelemetry Collector embedded in the Datadog Agent, and Datadog's recommended OTel setup) ships the tailsamplingprocessor.
So cost planning works differently in each tool. In Honeycomb, sampling is the one place you trade data for money. In Datadog, you make two separate decisions, what to ingest and what to index, and each one moves a different line on the bill.
OpenTelemetry support and lock-in
Honeycomb has retired its proprietary SDKs and points users to OpenTelemetry. Datadog accepts OpenTelemetry data through four paths, but its own compatibility matrix lists features that need the Datadog SDK or Agent. Neither tool's queries, alerts or SLOs port out. For the distinction between a backend that is OpenTelemetry-native and one that integrates with it, see OpenTelemetry-native vs integrating OpenTelemetry.
Honeycomb: OpenTelemetry as the recommended path
Honeycomb's Beelines and its own OpenTelemetry distributions have reached end of life and are archived, and Honeycomb recommends migrating to OpenTelemetry. It accepts OTLP over gRPC, HTTP/protobuf and HTTP/JSON for traces, metrics and logs. Its Kubernetes guidance uses the upstream OpenTelemetry Collector Helm chart.
Honeycomb still documents its Events API, so older or custom senders keep working. For new instrumentation, OpenTelemetry is the path Honeycomb recommends.
Datadog: four ingest paths and what the compatibility matrix excludes
Datadog accepts OpenTelemetry data through:
- the DDOT Collector embedded in the Agent, which Datadog recommends
- an upstream OpenTelemetry Collector exporting to Datadog
- OTLP ingest in the Datadog Agent
- direct OTLP intake with no Agent, which Datadog positions for cases where deploying an Agent or Collector isn't feasible
Datadog's SDKs also support the OpenTelemetry API for tracing, metrics and logs across its main languages, with metrics support in Ruby still in Alpha. That means you can write OTel API calls and still run a Datadog SDK underneath.
The compatibility matrix shows which features each documented setup supports. Only the Datadog SDK with DDOT supports every listed feature. For OpenTelemetry SDK setups, whichever collector you use, the matrix doesn't mark these as supported:
- Continuous Profiler
- App and API Protection
- Data Jobs Monitoring
- Real User Monitoring (RUM)
- Source Code Integration
The RUM gap is narrower than the matrix suggests on its own: Datadog documents correlating RUM with backends instrumented with OpenTelemetry by injecting supported trace-context headers. Data Streams Monitoring is marked not applicable for OpenTelemetry SDKs with DDOT or an upstream Collector, because OpenTelemetry doesn't offer that functionality.
Infrastructure features depend on the collector. With DDOT, OpenTelemetry SDK users keep Database Monitoring, Cloud Network Monitoring, Live Container Monitoring, Live Processes and Universal Service Monitoring. With an upstream Collector, the matrix doesn't mark those as supported. With direct OTLP intake, the Infrastructure Host List and Kubernetes monitoring drop out too, and trace metrics are calculated only from the spans that reach Datadog, so any sampling you apply upstream is reflected in them.
OpenTelemetry SDKs feeding Datadog work for tracing, metrics and logs. The full feature set in Datadog's matrix still assumes the Datadog SDK and Agent.
What doesn't port out of either tool
OpenTelemetry keeps your instrumentation portable, but the queries, alerts and SLOs you build stay behind if you leave either tool.
In Honeycomb, Triggers, SLOs and Boards are defined in Honeycomb's own query model. Metrics are queried through the same Query Builder, and Honeycomb's docs suggest using an AI agent to translate existing PromQL queries, so Prometheus-style queries need rework in either direction.
In Datadog, monitors, facets and dashboards are written in Datadog's query syntax against Datadog's attribute names. Datadog also maps OpenTelemetry semantic conventions to its own, for example service.name to service. Anything built on those names needs rework if you move.
Pricing models: what makes each bill grow
Honeycomb's bill grows with event volume and metric data points, and seats are unlimited. Datadog's bill grows with hosts, custom metrics, ingested and indexed volume, and the number of products you adopt. This section covers units only, based on vendor documentation checked on October 9, 2026. For dollar figures and your contract's terms, check each vendor's pricing page and your agreement.
Honeycomb: events, data points, unlimited seats
Honeycomb bills per event per month. Each span, span event and link counts as an event, and logs are counted in events too. Metrics are billed per data point per month (DPPM), not per unique time series. The pricing page lists unlimited seats and unlimited querying, and its usage units are events and data points rather than hosts.
A span with 10 attributes and a span with 200 attributes each count as one event. The bill grows with request volume and the number of spans each request produces, which is why sampling is the main cost lever.
Honeycomb restructured its Pro plan effective July 1, 2026. Customers on legacy plans have a grace period that ends December 31, 2026, so older third-party summaries of Honeycomb's tiers, seat limits and retention are likely out of date.
Datadog: per-product units and custom-metric cardinality
Datadog prices each product separately. Infrastructure is billed per host. APM is billed per APM host, with allotments of ingested and indexed spans per host. OTLP APM Ingest has no allotments and is billed per GB of ingested spans plus per million indexed spans. Logs are billed per GB ingested or scanned, plus per million events indexed. Other products have their own units.
Datadog offers two billing plans for host-based products. On the high-water mark plan, the billable host count is the high-water mark of the lower 99% of hourly usage: the busiest 1% of hours is ignored, but sustained peaks still set the bill. On the hybrid monthly/hourly plan, you commit to a monthly minimum and host hours above it are billed hourly.
Custom metrics are where cardinality shows up on the invoice. Under the default cardinality-based model, each unique combination of metric name and tag values counts as a separate custom metric. Add a customer_id tag with 5,000 values to a metric and you can multiply its billable count by up to 5,000. Attributes on spans don't count as custom metrics by themselves, but if you generate metrics from spans and group them by a high-cardinality attribute, those span-based metrics are billed as custom metrics.
Datadog gives you controls for this:
- Metrics without Limits separates ingestion from indexing through tag allowlists and blocklists, so you choose which tags stay queryable.
- Metric Name pricing is an opt-in alternative that replaces cardinality-based billing. It bills per unique metric name, with 10 million indexed data points included per name, pooled overage for indexed data points beyond that, and charges for ingested data points above five times your indexed volume. Tag combinations no longer count as separate custom metrics, but tags still drive data-point volume.
- Logging without Limits lets you ingest logs without indexing them. Excluded logs still flow through Live Tail, can generate metrics and can be archived.
- Flex Logs separates storage from compute for long-retention logs, but doesn't support monitors or Watchdog.
These controls work, but each one is a decision you make ahead of time about what will be queryable later. For a broader checklist on evaluating pricing models when you send OpenTelemetry data, see the OpenTelemetry backend guide.
One workload, two sets of meters
Take a system that produces 100 million spans a month on 50 hosts and emits one application metric tagged with customer_id across 5,000 customers. The table shows which meters each change moves, without prices.
| Change | Honeycomb | Datadog |
|---|---|---|
| Baseline: 100 million spans a month on 50 hosts | 100 million events, or about 10 million if you tail-sample 1 in 10 before ingest; host count isn't a pricing unit | Infrastructure hosts and APM hosts with their span allotments, or, through OTLP APM Ingest, GB of ingested spans plus indexed spans with no allotment; indexed spans kept by custom retention filters |
| Spans carry 200 attributes instead of 10 | No change in event count | Larger spans add ingested volume; no custom metrics unless you generate span-based metrics grouped by those attributes |
Add customer_id to the metric | Data points grow with the number of series and how often they report; no per-series charge | Up to 5,000 custom metrics under cardinality pricing; one metric name plus its data points under Metric Name pricing |
| Traffic doubles | Events double unless you raise the sample rate | Ingested and indexed volume grow, and host-based meters grow if you add hosts |
A complete Datadog estimate also depends on which OTLP ingest path you use, your retention filters, your metric pricing model, your host billing plan and every other product you turn on.
Platform breadth and what Honeycomb covers in 2026
Datadog covers infrastructure, security, digital experience, delivery and incident response, with more than 1,000 integrations. Honeycomb stays focused on debugging, though its releases since 2025 added native metrics, a telemetry pipeline and a private cloud option.
What Datadog covers that Honeycomb doesn't
| Category | Datadog (product catalog) | Honeycomb (platform) |
|---|---|---|
| Observability | Infrastructure Monitoring, APM, Universal Service Monitoring, Continuous Profiler, Database Monitoring, Data Streams Monitoring, Log Management, Observability Pipelines, Error Tracking | Traces, logs, native metrics, SLOs, Telemetry Pipeline |
| Security | Cloud Security Posture Management, Cloud SIEM, App and API Protection, Code Security, Cloud Workload Protection | Not listed |
| Digital experience | Browser and Mobile Real User Monitoring, Session Replay, Synthetic Monitoring, Product Analytics | Frontend Observability (an Enterprise add-on); no synthetic testing listed |
| Software delivery | CI Visibility, Test Optimization, Feature Flags, Internal Developer Portal | Not listed |
| Incident response | Incident Management, Workflow Automation, and On-Call (sold per seat) | Not listed |
If your team wants one vendor for security, synthetics, CI and on-call as well as observability, Datadog is the only one of the two that offers them.
Honeycomb's changes in 2025 and 2026
Most comparisons you'll find describe an older Honeycomb. The changes that affect a buying decision:
- Private Cloud (November 19, 2025): Honeycomb on dedicated AWS infrastructure that keeps data in your own cloud account, either self-managed or managed by Honeycomb.
- Native metrics GA (March 2026): time-series metrics stored in dedicated metrics datasets.
- Metrics-as-events deprecation: a migration window began June 10, 2026, and at its close, after about six months, metrics stored as events will be deprecated for Free and Pro plans.
- 2026 Pro plan: restructured effective July 1, 2026, with a grace period for legacy plans ending December 31, 2026.
- Beelines and Honeycomb OpenTelemetry distributions: end of life.
Some features require Honeycomb Enterprise: Service Map, the Query Data API, AWS PrivateLink and the SLO Reporting API. If you need a service map in Honeycomb, budget for Enterprise.
Both vendors are also adding AI-assisted investigation: Honeycomb with Canvas, an MCP server and Anomaly Detection, and Datadog with Bits Investigation.
SLOs and alerting
Honeycomb's SLOs measure success at the event level: the SLI is a per-event check that decides whether each event succeeded or failed. Datadog offers three SLO types: metric-based, monitor-based and time slice. If you want SLOs tied directly to individual requests, Honeycomb's model is closer. If you want SLOs built on existing monitors and metrics across a wide estate, Datadog's options cover more ground.
Common claims that no longer hold
Several claims repeat across comparison pages, including the vendors' own. This is where they stand in 2026.
| Claim | Status |
|---|---|
| Datadog requires facets to query high-cardinality attributes | Outdated. Attributes don't need to be facets. The real limit is that only indexed spans are queryable after the 15-minute Live Search window |
| Honeycomb has unlimited cardinality | Partly true. Cardinality doesn't affect event billing, but there are limits of 2,000 fields per event and 1 MB per event, and graphs plot only the top 50 groups |
| Datadog charges for every high-cardinality attribute | Imprecise. Span attributes aren't custom metrics unless you generate metrics from spans. Metric tag combinations are billed under cardinality pricing, and Metric Name pricing bills metric names and data points instead |
| Datadog retention is under 20 days | Partly true. Custom-filter spans are kept 15 days, intelligent-filter spans 30 days, and log retention is set per index |
| Datadog has 600+ integrations | Outdated. Datadog lists more than 1,000 |
| Honeycomb has no logs or metrics | Outdated. Logs are stored as events, and native metrics went GA in March 2026 |
| Both tools are OpenTelemetry-native | Inaccurate for Datadog. Its own compatibility matrix lists features that need the Datadog SDK or Agent |
| Datadog has no free tier | False. Datadog's pricing page lists a free infrastructure plan for up to 5 hosts |
| Datadog SLOs are only metric-based | False. Datadog offers metric-based, monitor-based and time slice SLOs |
Honeycomb, Datadog or both: how to choose
Start from the job you need done.
| Your priority | Better starting point |
|---|---|
| Debugging uncommon failures across distributed services | Honeycomb |
| Exploring many high-cardinality attributes after the fact | Honeycomb |
| One vendor for infrastructure, security, RUM, synthetics and on-call | Datadog |
| Features tied to the Datadog SDK and Agent, such as the Continuous Profiler | Datadog |
| Portable instrumentation | Either with OpenTelemetry; check Datadog's compatibility matrix for gaps |
| Datadog already in place, but historical trace investigations are hard | Both |
It also helps to be clear about what you'd be replacing. Swapping the backend you debug with is a much smaller move than replacing a whole monitoring and operations platform, and Honeycomb only covers the first.
Choose Honeycomb if most of your observability pain is "why are some requests slow or failing, and which ones?" in a microservices system. You get every event queryable on any attribute for 60 days, BubbleUp to find the outlier dimension, OpenTelemetry instrumentation, and a bill driven by event volume with unlimited seats. You'll need other tools for security, synthetics and CI, and you'll pay for Enterprise if you want a service map.
Choose Datadog if you want one vendor for infrastructure, APM, logs, security, real user monitoring, synthetics and on-call, or if you depend on features tied to the Datadog SDK and Agent, such as the Continuous Profiler or App and API Protection. Expect to manage what stays queryable through retention filters, Metrics without Limits and log indexing, and to watch several billing meters.
Use both if Datadog is already embedded for infrastructure and broad monitoring, and your engineers struggle to debug high-cardinality problems once the 15-minute Live Search window has passed. Instrument with OpenTelemetry, send traces to Honeycomb for debugging, and keep Datadog for everything else it covers. You'll pay two vendors and maintain alerts in two query models, so make sure the debugging gain justifies that.
FAQ
Is Datadog better than Honeycomb?
Neither is better across the board. Datadog is the better fit for one platform covering infrastructure, security, digital experience and delivery. Honeycomb is the better fit for exploratory debugging of high-cardinality production problems.
Can you use Honeycomb and Datadog together?
Yes. An OpenTelemetry Collector can export the same traces to both, so Honeycomb handles debugging while Datadog keeps covering infrastructure, logs and the rest of the platform. The cost is two bills and two sets of alerts.
Which fits a small team?
Honeycomb has unlimited seats and a single event-based meter, which keeps the bill simple as the team grows. Datadog has a free infrastructure plan, and its breadth helps if a small team doesn't want to run several tools. If your main need is debugging services rather than monitoring infrastructure, Honeycomb is usually the simpler fit.
Does adding attributes cost more?
In Honeycomb, no. An event costs the same whether it has 10 attributes or 200, up to the 2,000-field limit. In Datadog, extra attributes on spans don't add custom metrics unless you generate metrics from spans grouped by them. Extra tags on metrics do under cardinality-based pricing, where every new tag value combination is a billable custom metric, unless you limit indexed tags with Metrics without Limits or opt into Metric Name pricing, which bills metric names and data points instead.
Which bill is easier to predict?
Usually Honeycomb's, because it has fewer meters: events and metric data points. It still grows with traffic and with the number of spans per request. Datadog's bill combines host counts, custom metrics, indexed volume, ingest volume and each product you add, so a single tag change or a new product can move it.
Can you query Honeycomb data older than 60 days?
Not in Honeycomb's main event store, which keeps events for 60 days. Query with Archive, an Enterprise add-on, lets you query OpenTelemetry traces and logs that expired or were sampled out, as long as they're in your configured S3 archive bucket. Telemetry Pipeline's Enhance feature can also retrieve dropped or expired logs and traces from your own S3.
Final thoughts
Use one question to decide: when something breaks, do you need to slice last week's raw requests by an attribute nobody planned for? If that's the core of your on-call work and Datadog's retention filters keep getting in the way, add Honeycomb for debugging, and replace Datadog only if you don't rely on its security, digital experience, delivery or SDK-tied features. If you need one platform across all of those, stay on Datadog and invest in retention filters and metric tag controls. To go deeper, read about cardinality and how to choose an OpenTelemetry backend.
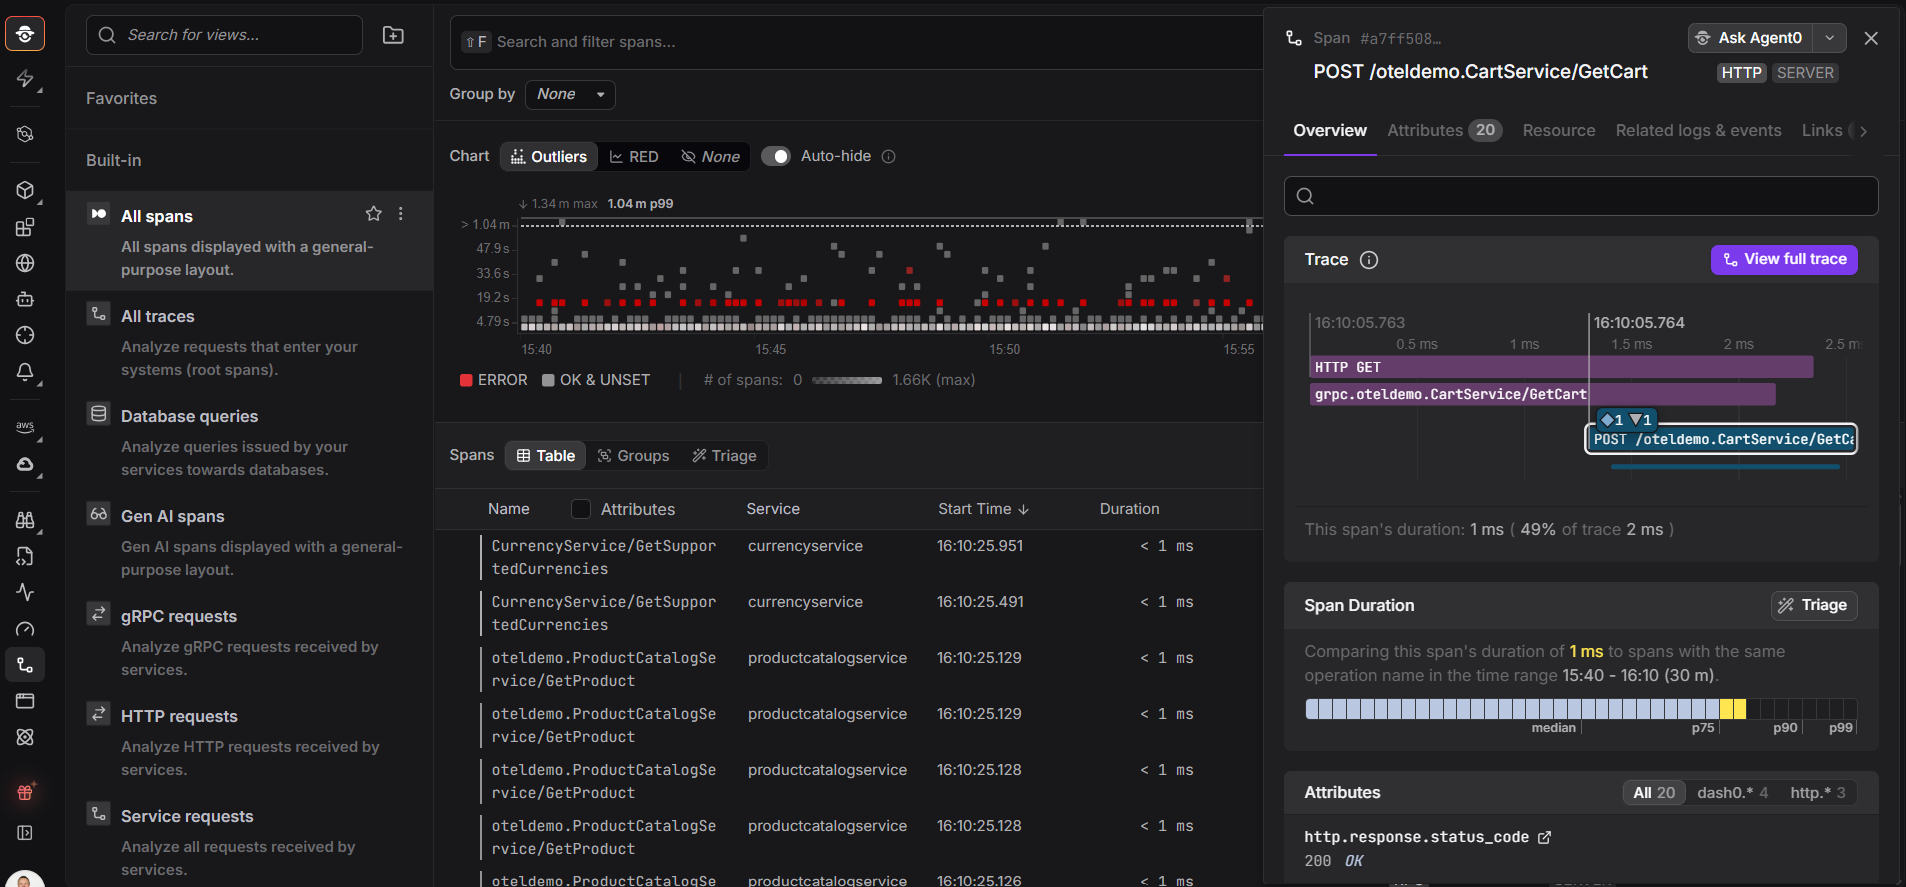
If you'd like to see how an OpenTelemetry-native platform handles the same telemetry, try Dash0 free for 14 days. No credit card required.