Chronosphere is a SaaS observability platform for large cloud-native environments producing high-volume, high-cardinality telemetry. It supports metrics, logs, and traces from Prometheus and OpenTelemetry pipelines, while its Control Plane helps platform teams identify, aggregate, downsample, or drop low-value data before paying to retain it. That makes Chronosphere particularly strong when metric cardinality and telemetry growth have become platform-level problems.
Teams still compare Chronosphere alternatives for several credible reasons. Smaller organizations may want self-service onboarding and public pricing; broader enterprises may prefer a platform that also covers digital experience, security, or deeper automated topology; and regulated teams may need telemetry to remain in their cloud. Query workflows and cost models differ sharply, too: Chronosphere sells the Observability Platform around useful retained data and prices its separate Telemetry Pipeline by raw throughput, with custom commercial terms rather than a public rate card (Chronosphere pricing FAQ).
Quick picks
| Tool | Best fit |
|---|---|
| Grafana Cloud | Prometheus and Grafana teams that want a managed path without abandoning familiar dashboards and query habits |
| Datadog | Enterprises consolidating observability, security, developer experience, and incident workflows with one vendor |
| Dash0 | OpenTelemetry-first teams that want a unified OTel resource model, PromQL-based querying, and consumption pricing without seat fees |
| Dynatrace | Large enterprises prioritizing automated discovery, topology, and root-cause analysis |
| Honeycomb | Application teams debugging high-cardinality microservices and unknown failure modes |
| New Relic | Teams wanting a broad full-stack platform with a generous self-service entry point |
| groundcover | Kubernetes-heavy organizations that want managed observability data to remain in their own cloud |
What to look for in a Chronosphere alternative
-
High-cardinality scale: Test with production-like label and attribute cardinality, not a clean demo dataset. Ask what happens to query latency, alert evaluation, and cost during a cardinality spike.
-
Data control before storage: Compare aggregation, filtering, sampling, and routing controls. Verify whether changes happen in your collectors, in a vendor pipeline, or only after billable ingestion.
-
Migration effort: Prometheus and OpenTelemetry can reduce instrumentation and transport lock-in, but dashboards, alerts, recording rules, queries, service level objectives (SLOs), role-based access control (RBAC), and incident workflows still need migration work.
-
Investigation workflow: Decide whether engineers work best with PromQL and dashboards, a unified event model, automated topology, or AI-assisted investigation. A familiar query language can matter more than a longer feature list during an incident.
-
Deployment and data boundary: SaaS removes backend operations; BYOC (bring your own cloud) or on-premises deployment gives you more control over residency and infrastructure. Include collector privileges, egress, and customer-managed storage in the architecture review.
-
Pricing shape: Model normal load, bursts, retention, and team growth against every billing dimension. Hosts, active series, indexed spans, ingested bytes, retained records, query scans, seats, and add-ons produce very different cost curves.
1. Grafana Cloud
Best for: Teams already standardized on Prometheus, Grafana dashboards, and the broader open-source observability ecosystem.
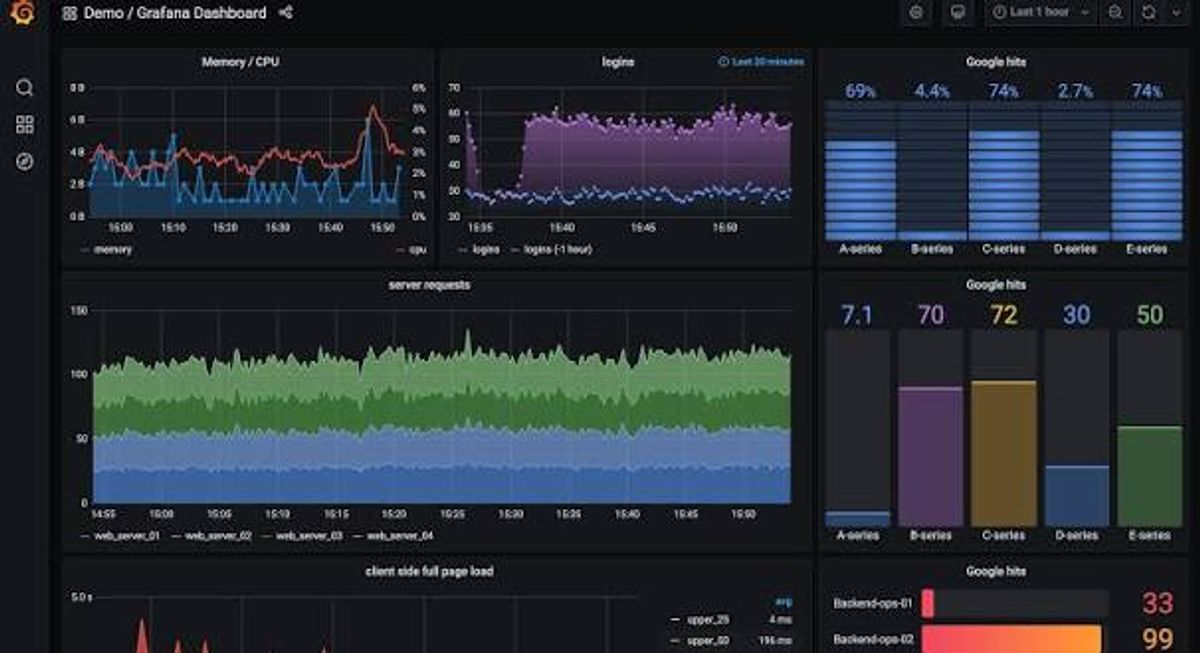
Grafana Cloud is the least disruptive Chronosphere alternative for organizations that want to preserve Grafana and PromQL muscle memory. Its managed stack uses Mimir-compatible metrics, Loki logs, Tempo traces, and Grafana visualization, while Grafana Alloy combines Prometheus collection with an embedded OpenTelemetry Collector distribution.
That ecosystem flexibility is also the tradeoff. Engineers may still cross several backends and query patterns, so signal correlation depends on consistent labels, trace context, and disciplined dashboard design. The managed service removes much of the storage operations burden, but it does not turn the LGTM (Loki, Grafana, Tempo, Mimir) components into one data model. It's also worth remembering that Grafana Cloud itself is a commercial product built on top of that open-source base: the components are free, but the managed hosting, enterprise features, and support you're actually paying for are not.
Application Observability bills by host-hours plus telemetry usage: active series for metrics and volume for logs, traces, and profiles. Cardinality and verbose telemetry are therefore the main variables to model. A 14-day trial rolls into a restricted free plan.
Worth exploring if: Your migration priority is keeping Grafana dashboards, PromQL, and an open-source operating path.
Give it a pass if: You want one consistent query and investigation model across every telemetry signal.
2. Datadog
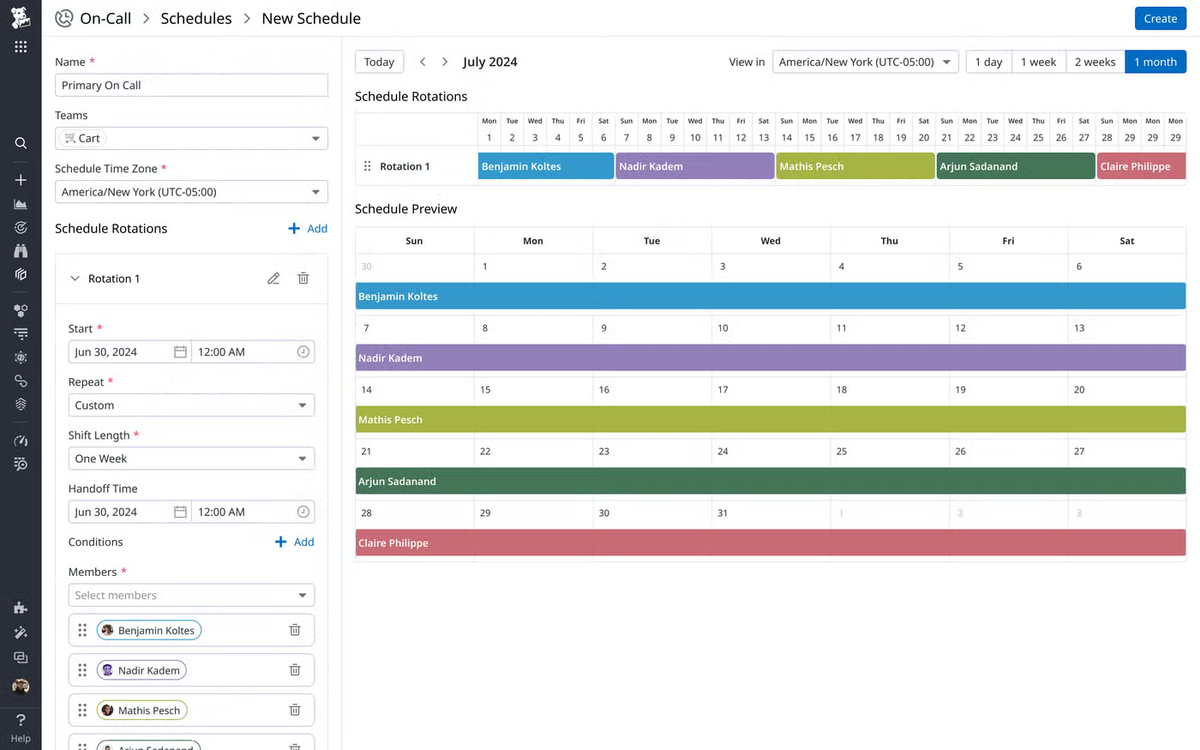
Best for: Enterprises that value platform breadth and a large integration catalog more than a minimal product or billing surface.
Datadog is the broad-suite option. Infrastructure monitoring, application performance monitoring (APM), logs, digital experience, security, service management, and developer workflows can live under the same vendor, which makes it attractive when consolidation is the goal rather than telemetry control alone.
It can ingest OpenTelemetry metrics, logs, and traces, so a migration does not require replacing portable instrumentation immediately (Datadog OpenTelemetry documentation). The distinction is architectural: Datadog supports OTel data, but dashboards, monitors, service definitions, queries, and many workflows remain Datadog-specific. That is a reasonable trade when one platform standard is the objective, but it creates switching work later.
Datadog publishes pricing and a free trial, but total spend is assembled from separate meters for infrastructure, containers, APM, indexed spans, logs, custom metrics, and optional products (Datadog pricing). Elastic host counts, metric cardinality, log indexing, and cross-product adoption can make a simple per-team estimate misleading.
Worth exploring if: You want one mature vendor to cover observability plus adjacent security and operational workflows.
Give it a pass if: Your primary requirement is a small number of predictable billing dimensions or portable investigation assets.
3. Dash0
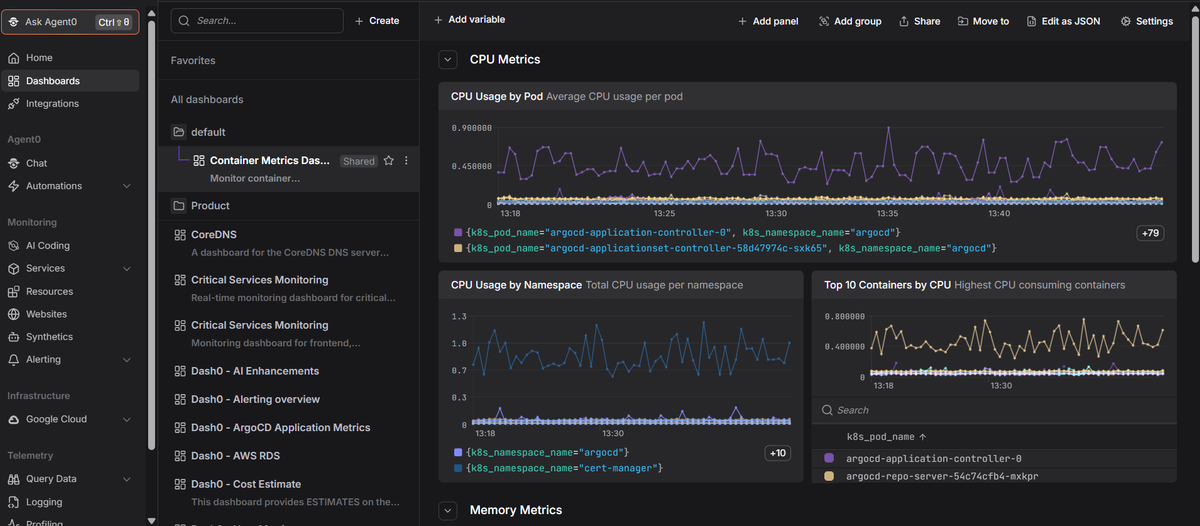
Best for: Cloud-native teams building around OpenTelemetry that want a single investigation workflow and transparent consumption billing.
Dash0 is an OpenTelemetry-native observability platform for logs, metrics, traces, infrastructure, Kubernetes, and application performance. Its Kubernetes operator installs an OpenTelemetry Collector and can automatically gather telemetry from supported workloads (Kubernetes operator documentation); metric exploration remains PromQL-oriented (Query Builder documentation), while consistent OpenTelemetry semantic conventions, shared resource attributes, and trace context let Dash0 correlate logs, metrics, and traces for the same service or resource rather than treating each signal as an island.
The practical appeal is reduced instrumentation lock-in and fewer context switches during investigation. Your OTel SDKs and collectors remain portable, although Dash0 dashboards, alerts, saved views, and investigation workflows are still vendor-specific. Spam filters can drop matching telemetry before storage and billing, and their rules can be exported as OTTL for earlier filtering in a collector (cost-control documentation).
Public pricing is consumption-based per metric data point, span, log record, web event, and synthetic run, with no seat or base platform fee (base subscription fee removal); a 14-day trial is available. Forecasting is straightforward when record counts are known, but noisy unsampled signals still increase spend. Also check the operator's current auto-instrumentation runtime list before assuming it covers every language in a heterogeneous estate; for the underlying tradeoffs of this approach, see what OpenTelemetry auto-instrumentation actually covers.
Worth exploring if: OTel portability, PromQL familiarity, and record-based pricing are central to your shortlist.
Give it a pass if: You need automatic runtime coverage beyond its documented operator support and do not want to instrument those services separately.
4. Dynatrace
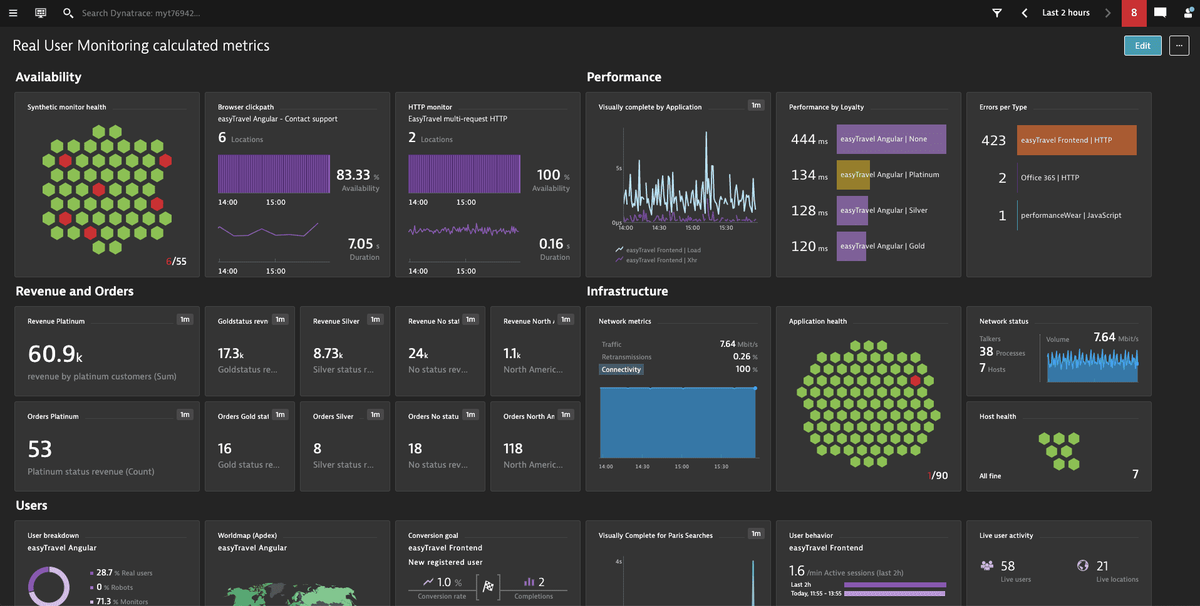
Best for: Large enterprises that want automated discovery, topology-aware analysis, and guided root-cause workflows.
Dynatrace is the automation-heavy alternative. OneAgent and Smartscape build topology across applications and infrastructure, while Dynatrace Intelligence and Grail correlate telemetry for problem analysis. It also accepts OpenTelemetry logs, metrics, and traces through the OpenTelemetry Protocol (OTLP) APIs and collectors (Dynatrace OpenTelemetry documentation).
This is a good fit when a central observability team wants the platform to discover dependencies and guide responders rather than relying primarily on handcrafted PromQL. The tradeoff is a substantial platform model of its own: Grail, the Dynatrace Query Language (DQL), apps, topology, and automation reward standardization, but they increase migration and training work if your teams are fluent in Prometheus-native tooling.
Dynatrace publishes a rate card under its Platform Subscription. Billing spans host or memory-GiB hours, pods, telemetry ingest and retention, query scans, sessions, synthetic actions, and other capabilities (Dynatrace pricing). The single commercial commitment helps procurement, but query volume, retention, and enabled product areas still need workload-level modeling; a public playground supports evaluation.
Worth exploring if: Automated topology and root-cause analysis justify adopting an enterprise-wide platform model.
Give it a pass if: Your engineers want to stay close to PromQL and OpenTelemetry-native concepts with a simpler consumption surface.
5. Honeycomb
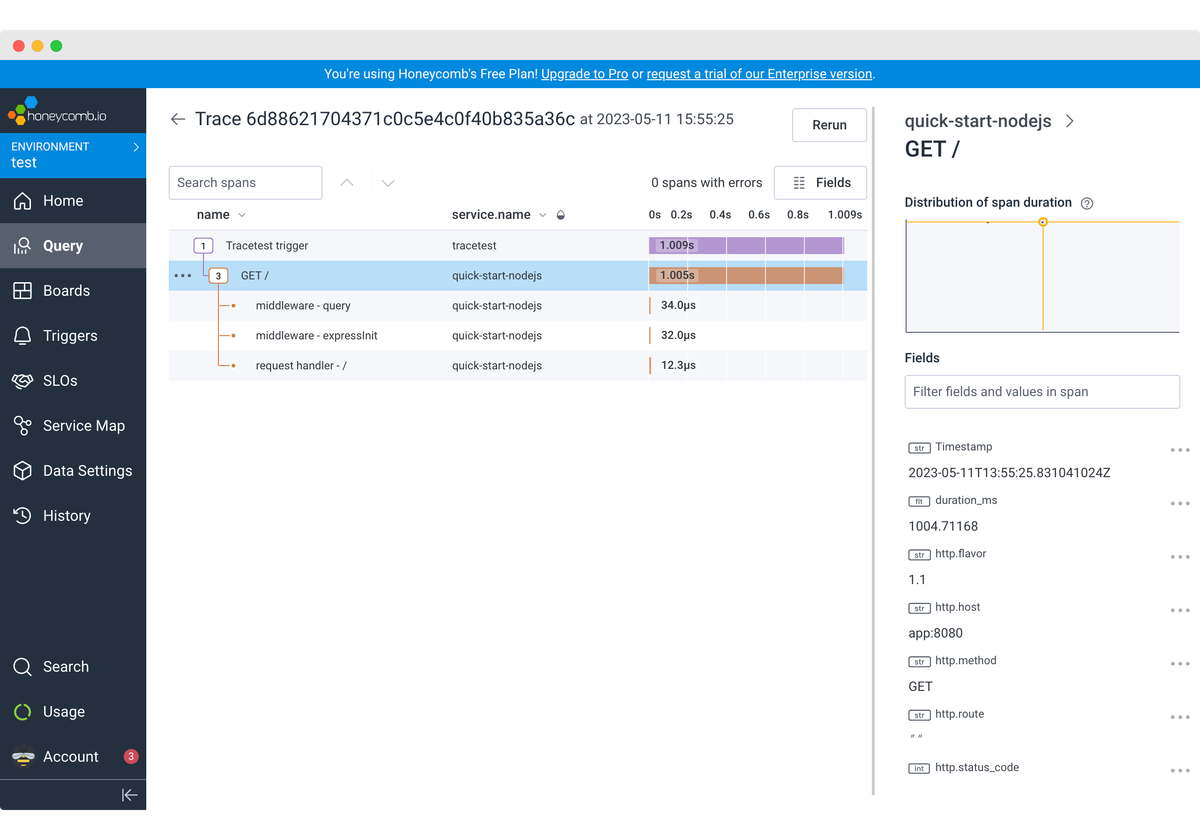
Best for: Application teams investigating high-cardinality, high-dimensional microservice behavior.
Honeycomb is the strongest specialist on this list for exploratory debugging. Its event model lets engineers query attributes such as customer ID, build ID, endpoint, or feature flag, while BubbleUp compares an outlier selection with the baseline and identifies the dimensions that differ (high-cardinality documentation).
That workflow is compelling when the central problem is finding unknown failure modes across distributed applications, not reproducing a conventional infrastructure dashboard estate. Honeycomb accepts OTLP through the standard OpenTelemetry Collector. For high-volume traces, its Refinery proxy supports tail-based sampling using the complete trace, but you deploy and operate Refinery in your environment (Refinery documentation).
Honeycomb prices around event volume and metric data points, with unlimited seats and querying; public Free, Pro, and Enterprise options make evaluation accessible (Honeycomb pricing). Event volume is the main cost driver, while sophisticated tail sampling adds pipeline infrastructure and tuning work.
Worth exploring if: Fast, ad hoc analysis of richly attributed application events matters more than a broad suite of infrastructure and security modules.
Give it a pass if: You want turnkey coverage across a heterogeneous enterprise estate and do not want to operate a tail-sampling tier.
6. New Relic
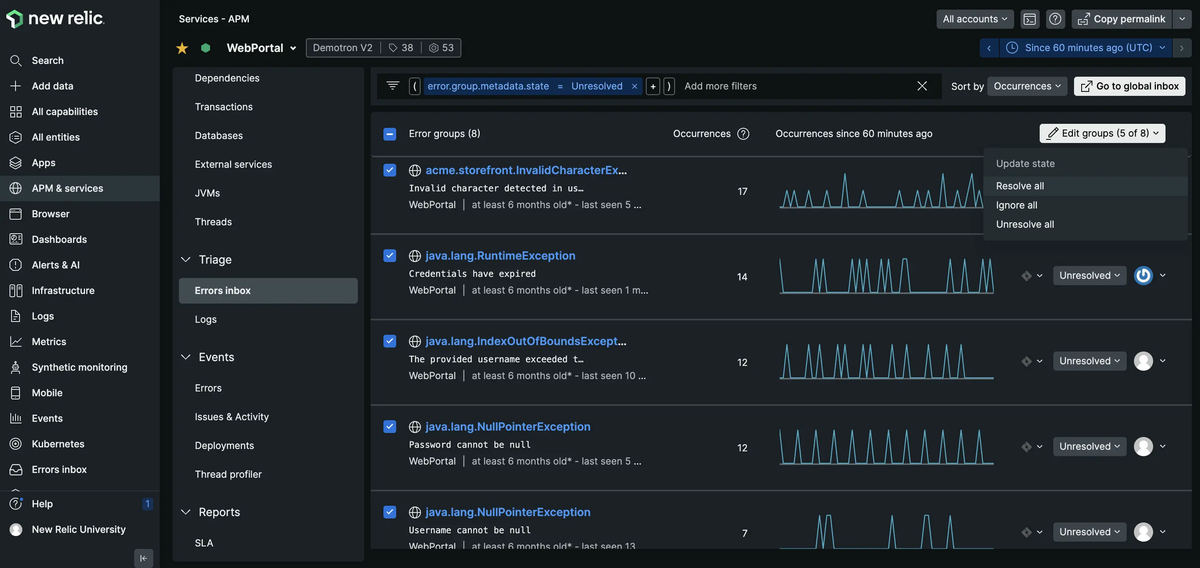
Best for: Teams seeking broad full-stack observability with low-friction self-service onboarding.
New Relic covers APM, infrastructure, Kubernetes, logs, browser and mobile monitoring, synthetics, and adjacent operational features. Its OpenTelemetry path is credible: the Kubernetes Helm chart deploys collectors for cluster metrics, events, and logs, and OTel-instrumented applications can be correlated with Kubernetes infrastructure in the UI (New Relic Kubernetes OTel documentation).
The platform is a useful middle ground between a focused cloud-native backend and a sprawling modular suite. Teams get the New Relic Query Language (NRQL), curated APM experiences, and many integrations without buying separate telemetry products. However, NRQL queries, entities, dashboards, and alerts remain migration work even when the underlying instrumentation uses OpenTelemetry.
New Relic's default model combines stored data ingest with billable user access; a preview Core Compute model can replace per-user licensing, and advanced capabilities consume separate compute units. Its perpetual free tier includes a monthly ingest allowance and one full-platform user (New Relic pricing). High ingest, a large population of full-platform users, and optional compute features are the main forecasting variables.
Worth exploring if: You want a broad SaaS platform that a small team can evaluate before a sales-led procurement cycle.
Give it a pass if: You want pricing tied only to telemetry or need PromQL to remain the primary investigation language.
7. groundcover
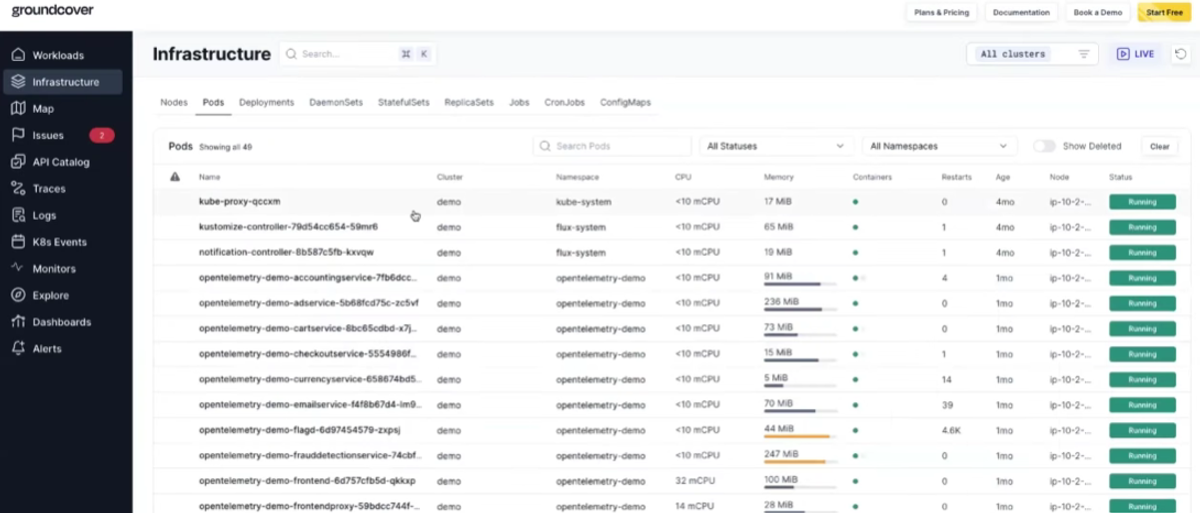
Best for: Kubernetes and Linux-heavy teams that need telemetry stored in their own cloud account.
groundcover takes a different architectural path from Chronosphere's SaaS backend. Its eBPF (extended Berkeley Packet Filter) sensor captures Kubernetes and Linux telemetry, while the managed BYOC deployment places the observability backend and data in your cloud; a fully on-premises option is also available (architecture documentation). This is useful when residency or egress policy rules out a conventional SaaS data plane.
eBPF reduces the amount of language-by-language setup needed for supported network and application visibility, and groundcover combines that data with external sources. The boundary is important: its deepest value is in Kubernetes and Linux estates, and BYOC means your team still funds the underlying compute, block storage, and object storage even though groundcover manages the application.
Pricing is based on the monthly average of monitored Kubernetes nodes or Linux hosts rather than telemetry volume, with public Free, Pro, Enterprise, and on-premises options (groundcover pricing). That makes license spend predictable for stable clusters, but the customer-cloud infrastructure bill and host count must both be included.
Worth exploring if: Data-plane control and node-based pricing matter more than having the vendor host every component.
Give it a pass if: You want a conventional SaaS backend with no customer-cloud footprint or most of your estate sits outside Kubernetes and Linux.
Comparison table
| Tool | Best fit | Primary edge | Pricing model | Main tradeoff |
|---|---|---|---|---|
| Grafana Cloud | Prometheus/Grafana estates | Ecosystem continuity | Host-hours plus signal-specific telemetry usage | Multiple backends and query patterns |
| Datadog | Enterprise consolidation | Platform and integration breadth | Separate product, host, usage, and add-on meters | Cost modeling and proprietary workflows |
| Dash0 | OpenTelemetry-first cloud-native teams | Unified OTel resource model and PromQL workflow | Telemetry records/data points; no seat fee | Check auto-instrumentation runtime coverage |
| Dynatrace | Automation-focused enterprises | Discovered topology and guided root cause | Platform commitment across hosts, telemetry, queries, and add-ons | Larger proprietary platform model |
| Honeycomb | Microservice debugging | High-cardinality exploratory analysis | Events and metric data points | Narrower suite; Refinery adds sampling operations |
| New Relic | Broad self-service SaaS | Accessible full-stack coverage | Data plus users or compute, with optional advanced compute | Seat/compute and ingest costs both matter |
| groundcover | Kubernetes with strict data control | Managed BYOC and eBPF collection | Monitored hosts plus customer-cloud infrastructure | Linux/Kubernetes focus and BYOC footprint |
Final thoughts
The strongest Chronosphere alternative depends on which part of Chronosphere you are actually replacing. Grafana Cloud is the continuity choice for a Prometheus-centered organization; Datadog and New Relic offer broader consolidation; Dynatrace emphasizes automated topology and guided diagnosis; Honeycomb specializes in high-cardinality application investigation; and groundcover changes the data boundary with BYOC. Dash0 is the OpenTelemetry-first option when you want a single OTel resource model and PromQL workflow across signals, plus a small number of record-based billing dimensions. None reproduces Chronosphere's mix of high-scale telemetry control, Prometheus orientation, and sales-led enterprise service exactly, so shortlist by operating model before comparing feature checklists.
Before switching, replay real dashboards, alerts, and incident queries against a production-sized dataset under peak incident conditions. Validate cardinality behavior, delayed or incomplete traces, collector CPU and memory, ingestion filtering, RBAC, data residency, and the cost of burst traffic. Then inventory what OpenTelemetry does not move for you: recording rules, saved views, SLO definitions, notification routing, access policy, and responder habits. If Dash0's OTel-native model fits that migration, its free trial is a practical way to test representative telemetry before making a platform decision.