Elastic Observability turns Elasticsearch and Kibana into a full-stack monitoring platform for logs, metrics, traces, application performance, infrastructure, and user experience. It fits teams that already operate the Elastic Stack, need strong search-driven log analysis, or want observability beside Elastic's search and security workloads. Elastic also offers hosted, serverless, and self-managed deployment paths, so it can accommodate both managed-cloud buyers and teams with strict infrastructure control.
Teams usually evaluate alternatives because the architecture is part of the purchase. Elastic Cloud Hosted requires capacity decisions and uses provisioned-resource pricing, while Serverless automates scaling and bills by usage; self-managed Elastic transfers more operational work to your platform team. Other common reasons are a preference for OpenTelemetry-first workflows, less Elasticsearch administration, more guided application troubleshooting, simpler cost attribution, or broader out-of-the-box coverage. The alternatives below solve different versions of that problem. There is no universal drop-in replacement.
Quick picks
| Tool | Best fit |
|---|---|
| Datadog | Organizations that want to standardize many monitoring and operations workflows with one SaaS vendor |
| Grafana Cloud | Prometheus- and Grafana-oriented teams that value ecosystem flexibility and managed cloud-native backends |
| Dynatrace | Large hybrid estates that prioritize automatic discovery, topology, and guided root-cause analysis |
| New Relic | Application teams seeking broad SaaS observability with relatively legible ingest-based pricing |
| Honeycomb | Engineers debugging high-cardinality behavior in distributed applications |
| Dash0 | OpenTelemetry-first teams that want portable instrumentation, PromQL-oriented workflows, and explicit cost controls |
| Splunk Observability Cloud | Existing Splunk customers that want strong real-time APM and infrastructure monitoring beside Splunk logs |
| SigNoz | Teams that want an OpenTelemetry-native platform with a credible self-hosted option |
What to look for in an Elastic Observability alternative
-
Start with the migration surface: every Elastic agent, Beat, Logstash pipeline, Kibana dashboard, alert rule, saved query, and index lifecycle policy you currently run. OpenTelemetry can reduce instrumentation and transport lock-in, but it won't translate any of these vendor-specific assets for you.
-
What investigation workflow do your engineers actually want? Free-form search, PromQL-style analysis, high-cardinality event exploration, and guided topology or root-cause views are different jobs, and a technically capable backend can still fail if it fights the team's incident habits.
-
Validate telemetry and environment coverage against your real estate, not a generic feature matrix: application runtimes, Kubernetes, hosts, databases, serverless, frontend monitoring, synthetics, profiling, and any legacy sources you still run.
-
Deployment and data control matter as much as features do. Elastic can run hosted, serverless, or self-managed; swapping it for a SaaS-only platform may simplify operations, but it can conflict with residency, isolation, air-gap, or retention requirements.
-
Operational overhead shifts rather than disappears. Self-hosting trades subscription cost for capacity planning, upgrades, storage design, backups, and on-call ownership, while managed platforms cut that work but demand careful ingestion and egress planning.
-
Pricing mechanics deserve a spreadsheet, not a guess. Model every unit that grows in your architecture, hosts, containers, active metric series, ingested gigabytes, spans or events, retained data, queries, users, add-ons, and run the estimate against production cardinality and burst patterns.
-
Compare data controls before you migrate: sampling, filtering, redaction, routing, retention, and cost allocation. These decide both the size of your bill and whether engineers keep enough context to actually debug.
1. Datadog
Best for: Organizations consolidating application, infrastructure, network, security, and operational workflows under one SaaS vendor
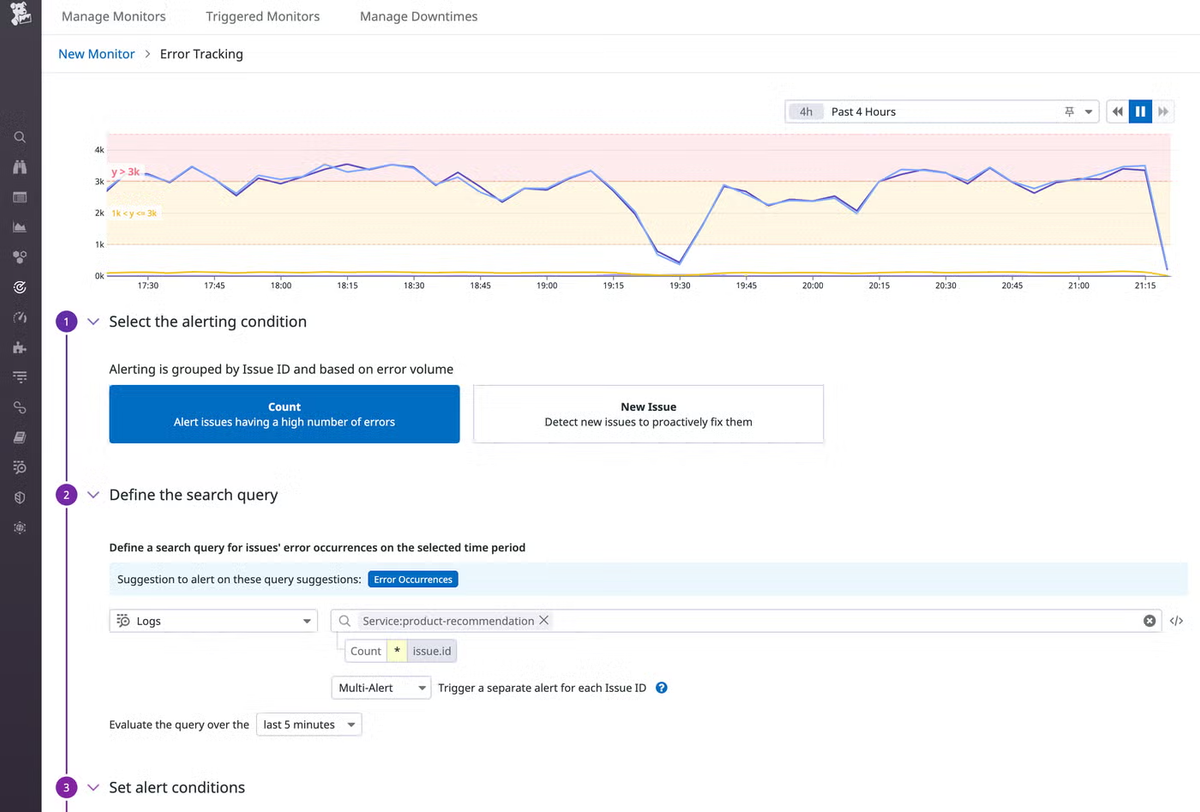
Datadog is the broad-platform alternative. It has deep coverage across modern cloud estates and a mature integration catalog, so a team replacing Elastic can standardize more than logs and APM without assembling several backends. It also accepts metrics, traces, and logs from OpenTelemetry, although the platform's dashboards, monitors, queries, service catalog, and incident workflows remain Datadog-specific.
The main advantage is operational reach: application and infrastructure telemetry can connect to database, network, frontend, synthetic, security, and incident data in the same vendor ecosystem. That is useful for a large organization that values consistent onboarding and governance more than backend portability.
Datadog's public pricing separates infrastructure, APM, logs, custom metrics, RUM, synthetics, and other products into distinct meters. Selective adoption is easy, but forecasting a fully standardized deployment requires modeling elastic host and container counts, indexed log volume, custom metrics, sessions, and add-ons. A free trial is available. Teams weighing Datadog against an OpenTelemetry-first path can also consult this Datadog-to-OpenTelemetry migration guide for a concrete look at what that switch involves.
Worth exploring if: you want the most credible one-vendor replacement for a wide production monitoring estate.
Give it a pass if: your priority is a small billing surface, self-hosting, or keeping queries and operational workflows close to open standards.
2. Grafana Cloud
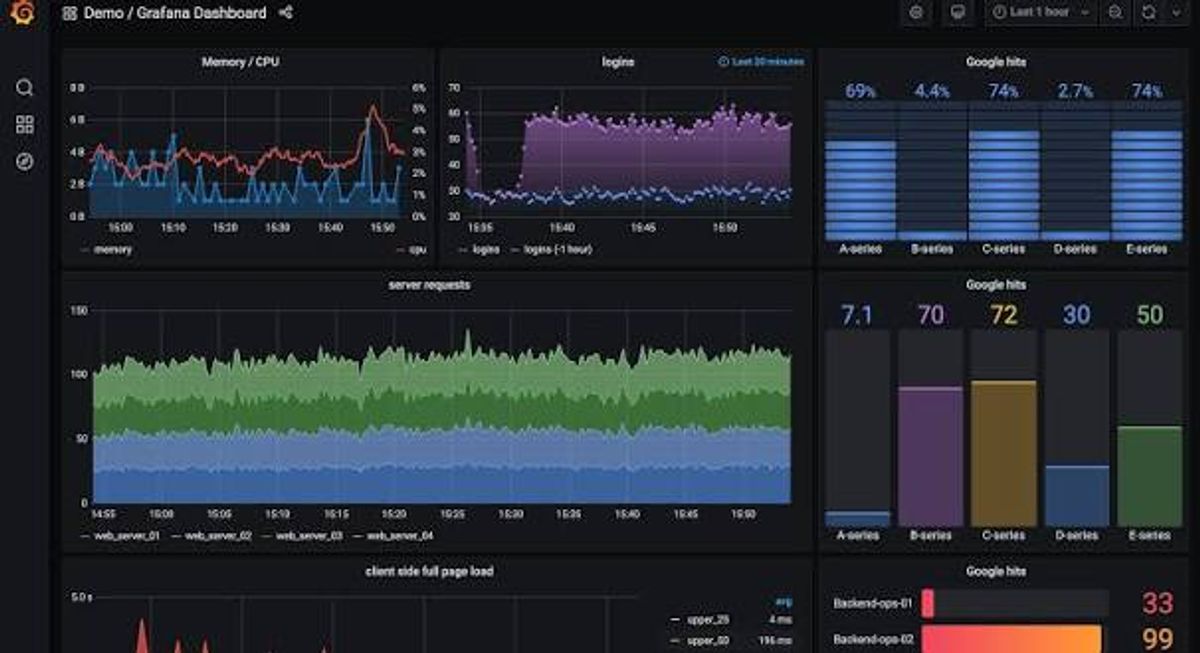
Best for: Teams already fluent in Grafana, Prometheus, and cloud-native telemetry
Grafana Cloud is the ecosystem-flexible alternative. It combines managed metrics, logs, traces, profiles, dashboards, and alerting while preserving familiar Grafana and Prometheus practices. Its Kubernetes setup can deploy Grafana Alloy and collect metrics, logs, events, traces, and cost data; the curated Kubernetes Monitoring experience, however, works only with data sources hosted in Grafana Cloud, according to Grafana's own configuration documentation.
The strength is choice. Teams can keep a Grafana-centered operating model, use OpenTelemetry and Prometheus collection, and adopt managed backends without running the full stack themselves. The tradeoff is that flexibility still exposes several data models and query patterns; platform teams need conventions for labels, dashboards, alert rules, and cross-signal navigation.
Billing also has multiple dimensions. Metrics are sensitive to active-series growth, while Grafana's own invoice documentation shows logs, traces, and profiles metered by processing, writing, retention, and, in high-query cases, query usage. Public plans include an evaluation-friendly free tier.
Worth exploring if: your engineers already think in PromQL and Grafana dashboards and want managed infrastructure behind that workflow.
Give it a pass if: you want one uniform query model and strongly guided troubleshooting instead of an ecosystem you must standardize.
3. Dash0
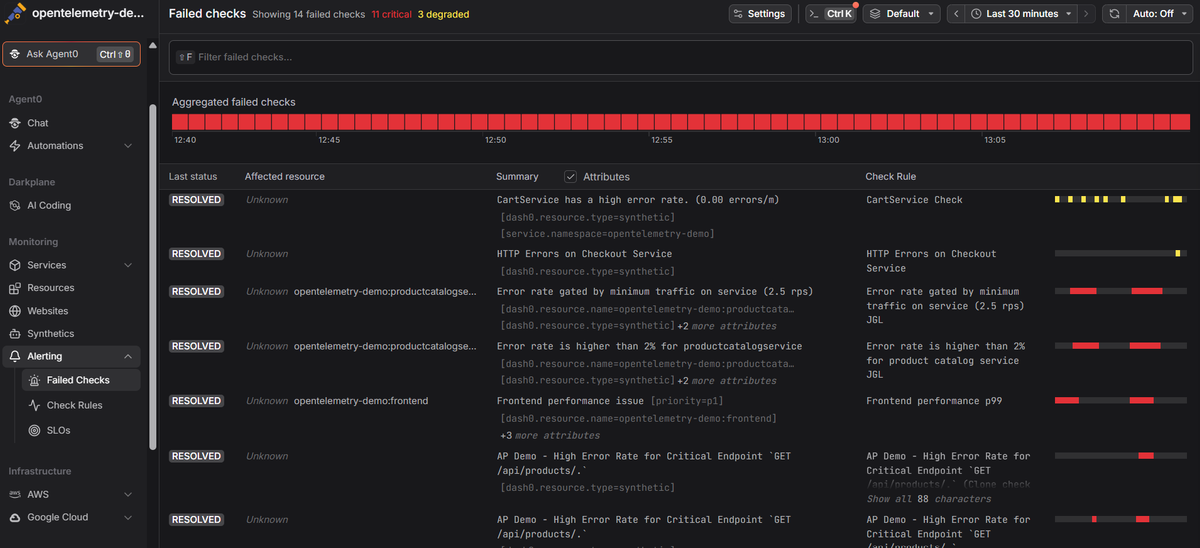
Best for: OpenTelemetry-first platform teams that want portable instrumentation and a focused multi-signal workflow
Dash0 is built around OpenTelemetry, PromQL-oriented analysis, and open dashboard and alerting formats. For an Elastic migration, the practical benefit is reduced instrumentation lock-in: OTLP pipelines and OpenTelemetry SDKs can remain portable even though saved views, investigations, teams, and other product workflows still create switching cost.
Dash0 bills by telemetry records (metric data points, spans or span events, logs, web events, and synthetic runs) rather than by hosts or active series. The pricing model is public and includes a 14-day trial. Teams can also drop low-value telemetry before storage and billing, set a monthly budget, and inspect cost drivers, which helps when Elastic ingest volume has become difficult to govern.
The main caveat is coverage maturity. Dash0's Kubernetes operator currently lists automatic workload instrumentation for Java, Node.js, and .NET by default, with opt-in support for Python and Ruby; teams using other runtimes may need to configure OpenTelemetry themselves. Its integration catalog and enterprise operating history are also smaller than the long-established suites.
Worth exploring if: your replacement project is also an OpenTelemetry standardization project and cost visibility matters.
Give it a pass if: you need the broadest zero-code runtime coverage or want a platform with Datadog- or Dynatrace-scale integration maturity.
4. Dynatrace
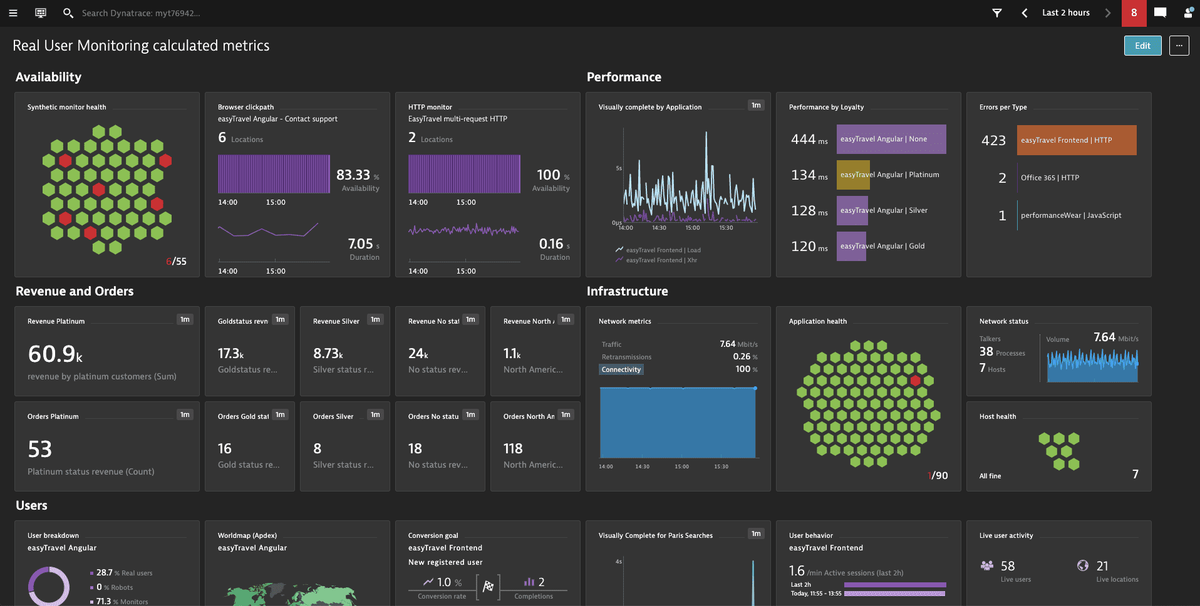
Best for: Large hybrid and enterprise environments that value automatic discovery and topology-aware analysis
Dynatrace is the automation-heavy alternative. OneAgent, Smartscape topology, Grail, and Dynatrace Intelligence are designed to discover dependencies and connect application, infrastructure, log, event, and user-experience data with less manual dashboard assembly. This is especially attractive when the replacement project covers a mixed estate rather than only Kubernetes and cloud-native services.
Dynatrace also supports OpenTelemetry ingest through OTLP and its Collector distribution. OpenTelemetry data is integrated into the Dynatrace Platform Subscription model, but OneAgent and Dynatrace-specific analysis still provide much of the differentiated automation. That makes the platform easier to operate for some enterprises while increasing workflow switching costs.
The Dynatrace Platform Subscription uses an annual platform-level spend commitment consumed against a rate card, with on-demand consumption beyond the commitment. Logs, full-stack monitoring, infrastructure, digital experience, and other capabilities have their own usage units, so cost planning requires a representative pilot. Public rate-card information and a free trial are available.
Worth exploring if: automatic topology and root-cause guidance matter more than preserving Elastic-style search workflows.
Give it a pass if: you want a low-commitment tool, self-hosted open-source control, or an investigation model centered on open queries rather than vendor automation.
5. New Relic
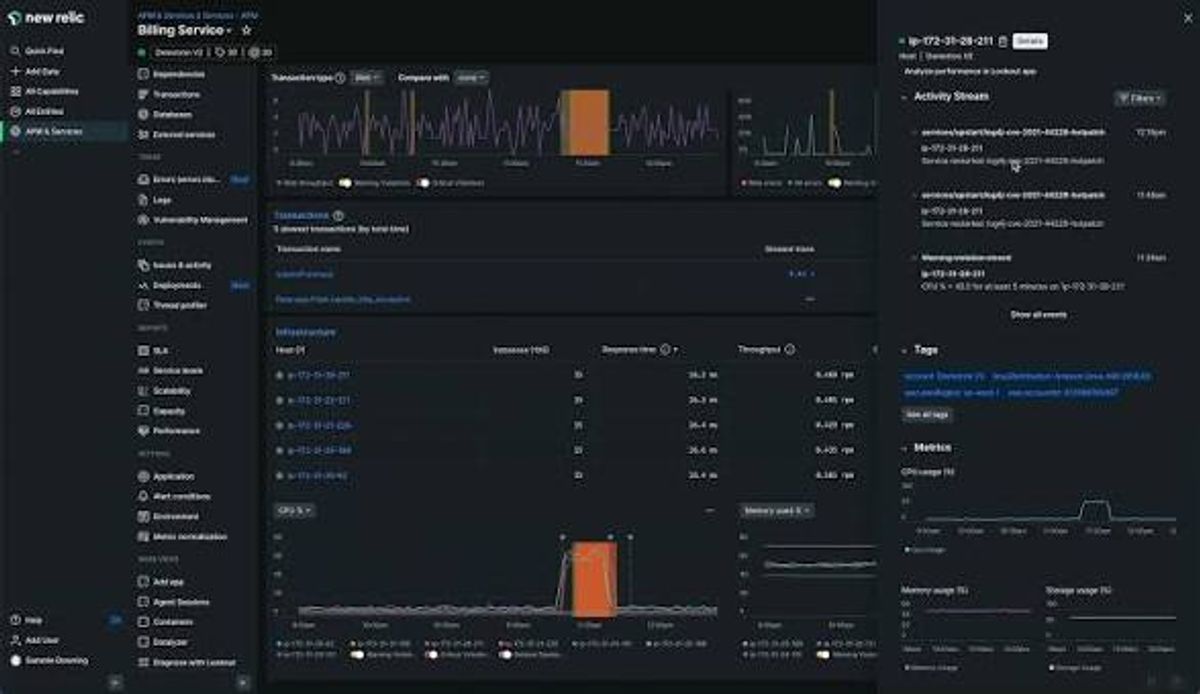
Best for: Application-centric teams that want broad SaaS coverage and a simpler starting cost model
New Relic is a practical general-purpose replacement for teams that want APM, infrastructure, logs, browser, mobile, synthetics, errors, dashboards, and alerting without operating Elasticsearch. It supports native OTLP ingest and recommends it for OpenTelemetry data, which gives migrating teams a standards-based collection path.
Its main advantage over Elastic is a more managed application workflow: teams can onboard quickly, query telemetry in NRQL, and use curated experiences without sizing an Elasticsearch deployment. The tradeoff is that NRQL, dashboards, alert policies, and entity models become a new proprietary operating layer, so OpenTelemetry does not make the whole migration reversible.
New Relic primarily bills by stored data ingest, then varies access through user types and optional compute features. Its pricing documentation publishes the ingest model and includes a perpetual free allowance, making small pilots straightforward. Verbose logs and richly attributed spans still increase ingest, while full-platform users and advanced compute can add separate cost dimensions.
Worth exploring if: you want broad commercial observability with fast onboarding and an easy way to test production ingest economics.
Give it a pass if: self-hosting is mandatory or you want dashboards, alerts, and queries to remain portable across backends.
6. Honeycomb
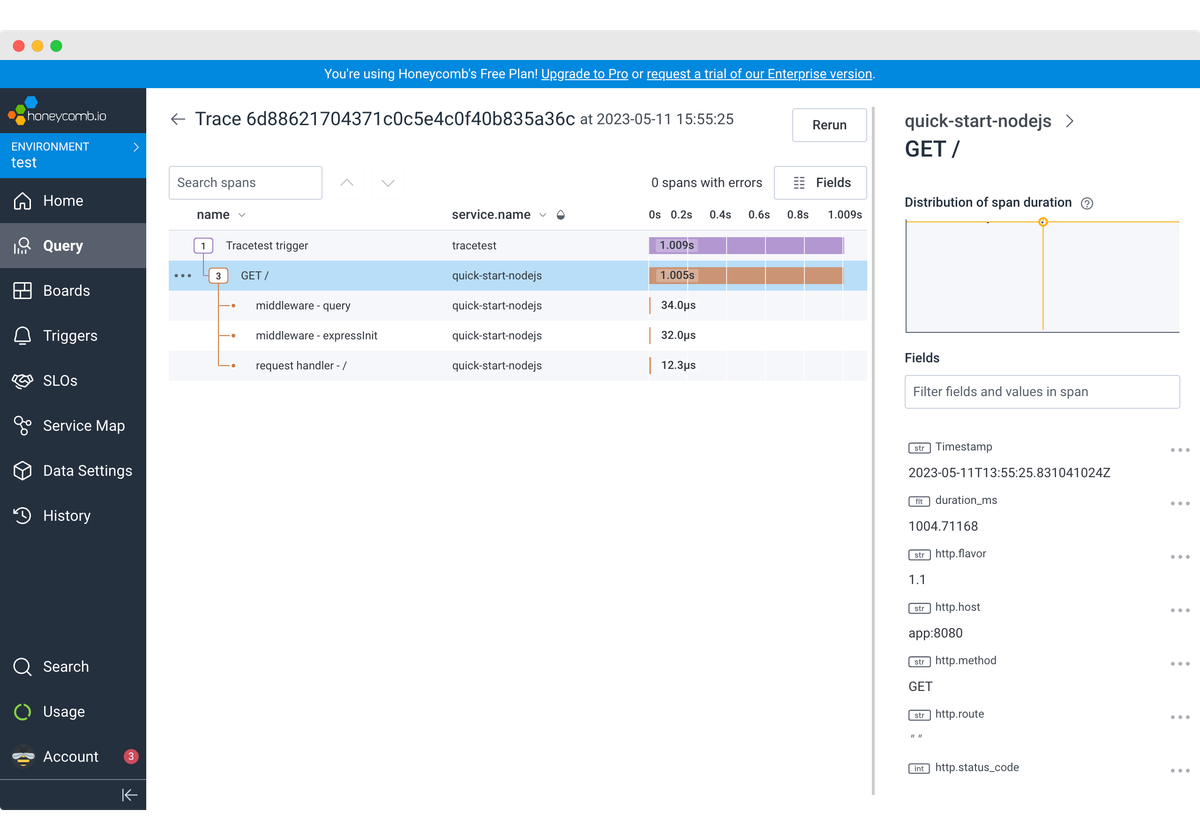
Best for: Software engineers investigating high-cardinality failures and unusual request behavior in distributed systems
Honeycomb is the debugging-focused alternative. Rather than reproducing Elastic's search-centric log workflow, it treats rich events and traces as the basis for interactive exploration. BubbleUp, trace analysis, and high-cardinality grouping are particularly useful when engineers need to find what differs about a small set of slow or failing requests.
The OpenTelemetry path is strong: Honeycomb accepts standard OTLP over gRPC or HTTP for traces, metrics, and logs without a proprietary exporter, as described in its Collector documentation. Honeycomb now supports time-series metrics as well, but its center of gravity remains application behavior rather than being the broadest infrastructure, security, or long-term log archive.
Pricing is capacity-oriented around events per month and metric data points. Each span counts as an event, so trace shape and sampling strategy directly affect the bill. Public Free and Pro plans make evaluation easy, while high-span-count services require careful volume modeling.
Worth exploring if: the real reason for leaving Elastic is to give developers a faster, high-cardinality debugging workflow.
Give it a pass if: your primary requirement is fleet-wide infrastructure monitoring, SIEM-like log retention, or one suite for every operations function.
7. Splunk Observability Cloud
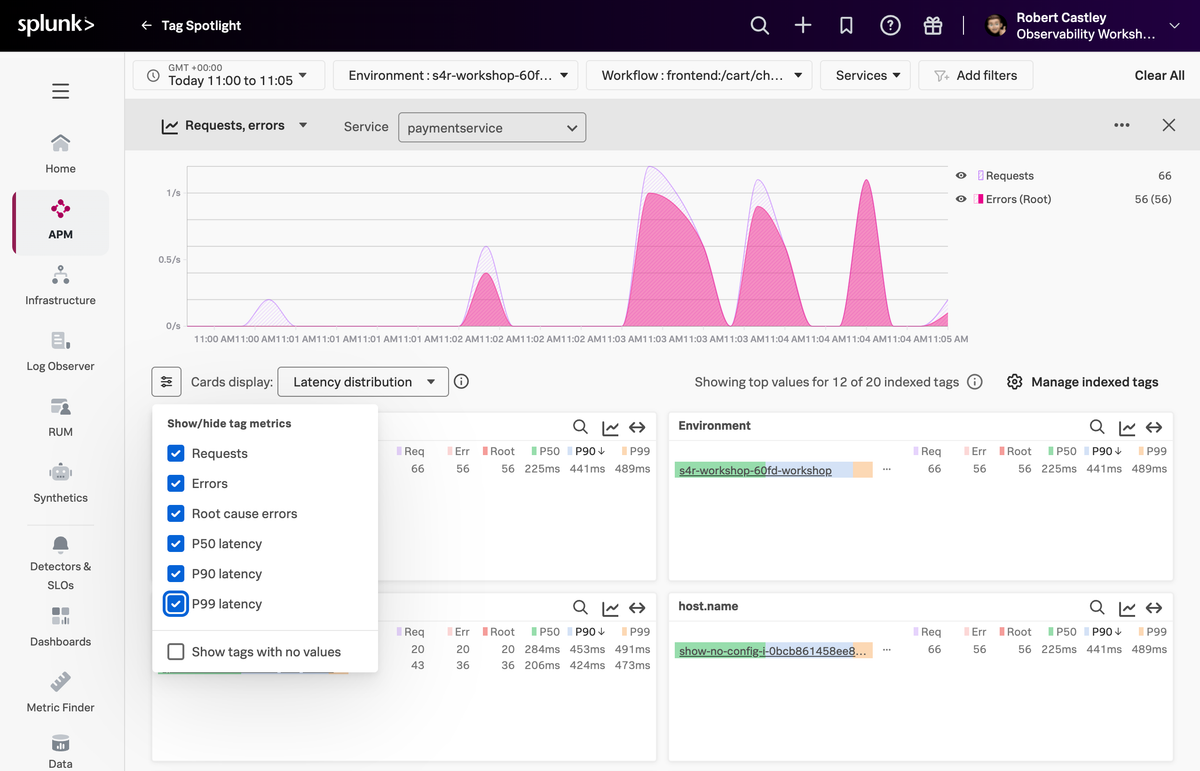
Best for: Existing Splunk Platform customers that want real-time infrastructure and application monitoring beside their logs
Splunk Observability Cloud combines infrastructure monitoring, APM, RUM, synthetics, dashboards, and streaming SignalFlow analytics. Its supported OpenTelemetry Collector distribution can run in agent or gateway mode, giving teams a modern collection path for hybrid and cloud-native environments. For organizations already committed to Splunk, it can correlate operational metrics and traces with the log estate rather than forcing another log migration.
That last point is also the key limitation for an Elastic replacement. Log Observer Connect does not store or index logs; the logs remain in Splunk Cloud Platform or Splunk Enterprise. A log-heavy Elastic customer therefore needs to evaluate the combined Splunk architecture and commercial model, not Observability Cloud in isolation.
Splunk offers entity-based plans for hosts and containers as well as usage models tied to product-specific units such as metric time series and RUM sessions. Public starting information and free trials exist, but the full bill depends on the chosen package and whether a Splunk Platform log backend is also required.
Worth exploring if: your organization already runs Splunk for logs or security and wants tightly connected APM and infrastructure monitoring.
Give it a pass if: you want a single, self-contained replacement for Elastic log storage and observability with one simple usage meter.
8. SigNoz
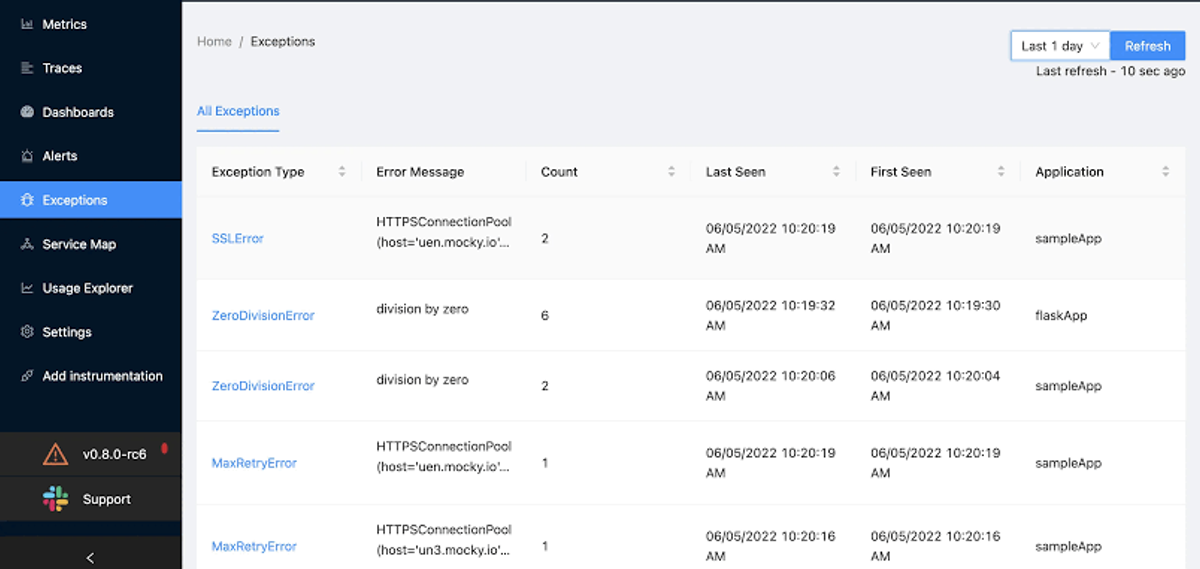
Best for: Teams that want an OpenTelemetry-native platform and are prepared to operate it themselves
SigNoz is the self-hostable alternative on this shortlist. It brings logs, metrics, traces, alerts, dashboards, and application and infrastructure views into one OpenTelemetry-native platform. The community edition gives teams control of their telemetry endpoints and data plane, while Cloud and enterprise variants remove some of the operational burden.
The appeal for Elastic users is architectural control without rebuilding a separate Prometheus, tracing, and log UI stack. The self-hosted edition accepts OTLP directly and leaves authentication, TLS, scaling, storage, backups, upgrades, and high availability in your hands. That is a meaningful trade: it can satisfy residency and customization requirements, but it does not make observability operations free.
SigNoz Cloud uses usage-based pricing, while self-hosted software shifts spend to your infrastructure and staff. The project's official GitHub repository documents the managed, enterprise, and community paths and offers a cloud trial. Cloud telemetry volume, retention, and enterprise controls still need to be modeled; self-hosted buyers should model ClickHouse capacity and operator time.
Worth exploring if: data-plane control and self-hosting are requirements, not just preferences.
Give it a pass if: you want a vendor to own scaling, upgrades, resilience, and enterprise operations from day one.
Comparison table
| Tool | Best fit | Main strength | Main tradeoff | Pricing model | Deployment |
|---|---|---|---|---|---|
| Datadog | Broad vendor standardization | Product and integration breadth | Many proprietary workflows and billing meters | Hosts, ingest, custom metrics, sessions, tests, add-ons | SaaS |
| Grafana Cloud | Grafana/Prometheus teams | Ecosystem flexibility | Multiple backends and query disciplines | Active series; processed, written, retained, and queried data | SaaS; OSS components can be self-managed separately |
| Dynatrace | Large hybrid estates | Automatic topology and guided analysis | Platform commitment and vendor-specific automation | Annual consumption commitment across capability units | SaaS and managed enterprise options |
| New Relic | Application-centric teams | Fast onboarding and broad SaaS coverage | Proprietary NRQL and entity workflows | Data ingest, user access, optional compute | SaaS |
| Honeycomb | High-cardinality debugging | Rich event and trace exploration | Less suited to broad fleet or log-archive replacement | Events and metric data points | SaaS |
| Dash0 | OpenTelemetry-first teams | Portable instrumentation and explicit cost controls | Narrower auto-instrumentation and integration coverage | Telemetry records by signal; separate AI usage | SaaS |
| Splunk Observability Cloud | Existing Splunk customers | Streaming APM and infrastructure analytics | Full log workflow requires Splunk Platform | Entities or product-specific usage units | SaaS plus separate Splunk log backend |
| SigNoz | Self-hosting and data control | OTel-native unified platform | You own reliability and capacity when self-hosted | Cloud usage or self-hosted infrastructure and labor | SaaS, BYOC, or self-hosted |
Final thoughts
Elastic Observability alternatives fall into four practical groups. Datadog, Dynatrace, and New Relic replace Elastic with another managed suite, trading Elasticsearch operations for proprietary platform workflows. Grafana Cloud and Dash0 lean further toward open telemetry and query conventions, but still require discipline around dashboards, alerts, and cost. Honeycomb optimizes for application debugging rather than full estate replacement, Splunk is strongest when a Splunk log platform already exists, and SigNoz is the clearest path when self-hosting is non-negotiable.
Before replacing Elastic, run two proofs at once: a technical pilot and a migration inventory. Send representative production telemetry, including cardinality spikes and verbose logs, then compare incident workflows, not demo dashboards. In parallel, count the Kibana assets, Elasticsearch queries, retention policies, alert integrations, RBAC rules, and ingest pipelines that must be rebuilt. Validate runtime coverage, redaction, sampling, data residency, and a full-month cost model before committing. If an OpenTelemetry-first managed workflow fits that test, the Dash0 free trial is one option to include alongside the finalists that best match your deployment and operating model.