Splunk Observability Cloud is an OpenTelemetry-based platform for infrastructure monitoring, APM, real user monitoring, and synthetics. Its streaming metrics analytics and high-cardinality investigation suit large cloud-native and hybrid environments, especially organizations that already use Splunk Cloud Platform or Splunk Enterprise for logs. Splunk uses OpenTelemetry as its default ingestion path, while Log Observer Connect links observability views to logs stored in the wider Splunk platform (Splunk overview).
Teams compare Splunk Observability Cloud alternatives when they want logs, metrics, and traces stored in one backend; a lighter query and administration model; self-managed deployment; or billing that maps more directly to telemetry volume. Splunk offers host-based entity pricing as well as usage models that vary by signal—for example, metric time series for infrastructure monitoring and web sessions for RUM (service description). The best replacement therefore depends on which Splunk job you are actually moving, not on who has the longest feature list.
Quick picks
| Tool | Best fit |
|---|---|
| Datadog | Teams that want the broadest SaaS platform and integration catalog under one vendor |
| Dynatrace | Large enterprises prioritizing automatic topology and root-cause analysis |
| New Relic | Teams that want fast SaaS onboarding and one analytics database for all telemetry |
| Grafana Cloud | Prometheus and Grafana users who want managed open-source-rooted backends |
| Elastic Observability | Log-heavy teams that need deployment and data-model control |
| Chronosphere | High-scale Kubernetes organizations that need aggressive telemetry governance |
| Dash0 | OpenTelemetry-first teams that value portable instrumentation and simpler billing |
| Honeycomb | Developers debugging high-cardinality distributed systems through wide events |
What to look for in a Splunk Observability Cloud alternative
-
Decide whether you are replacing Observability Cloud only, or also Splunk Cloud Platform, Enterprise, or SIEM. Most tools here cover operational telemetry, not Splunk's security analytics.
-
Native OTLP ingest preserves more of your existing OpenTelemetry work, but vendor agents can still offer deeper automatic discovery. Inventory proprietary dashboards, detectors, SignalFlow, searches, and routing rules separately from instrumentation.
-
Compare how quickly engineers can move among a service, trace, log, metric, deployment, and alert. A single UI is not necessarily a single data model or query language.
-
SaaS reduces backend operations. Self-managed software gives you more control over residency, upgrades, retention, and infrastructure. Hybrid options sit between those extremes but still require a clear ownership model.
-
Evaluate filtering, metric aggregation, trace sampling, retention, cardinality management, and cost attribution before data reaches storage. These controls matter more than a low headline rate when volume spikes.
-
Model your actual hosts, containers, active series, spans, log records or bytes, users, queries, retention, and add-ons. A predictable unit is only useful if it follows the way your environment grows.
1. Datadog
Best for: Organizations standardizing observability, security, service management, and developer workflows on one SaaS vendor
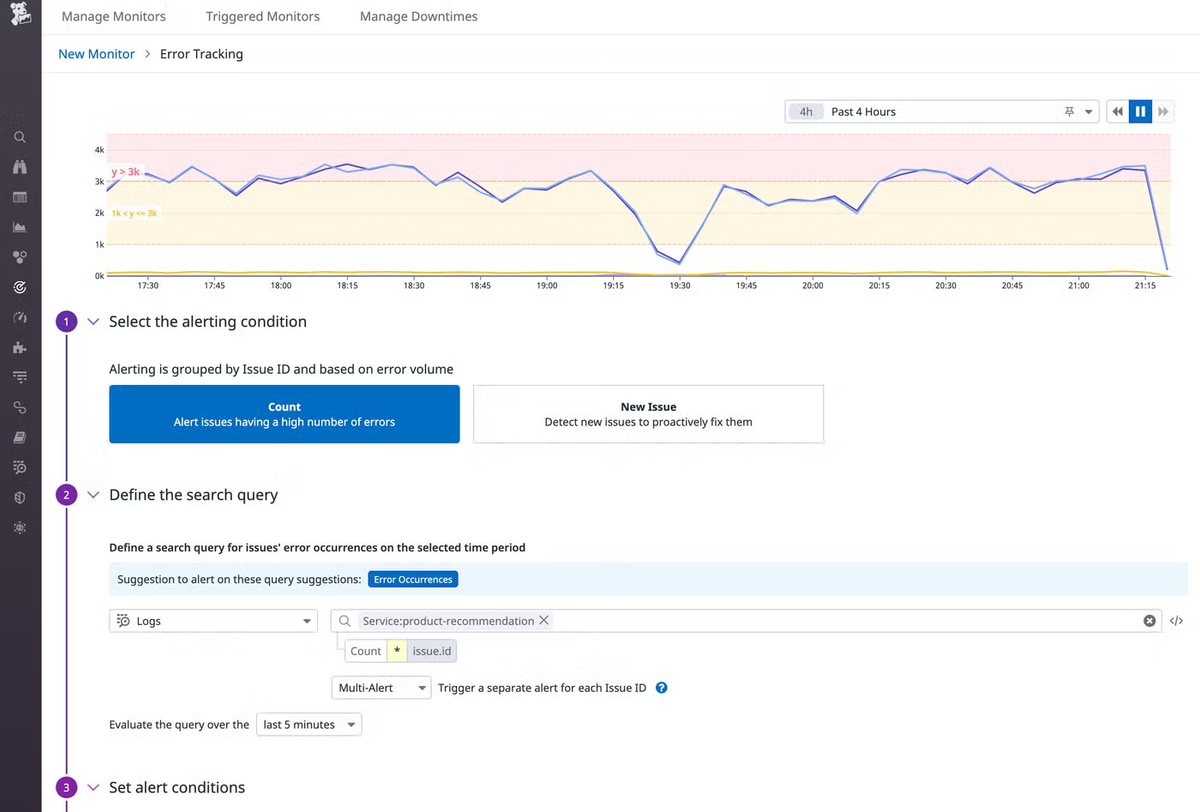
Datadog is the closest broad-platform substitute for Splunk Observability Cloud. It combines a polished investigation experience with more than 1,000 built-in integrations, making it a strong choice for heterogeneous infrastructure where fast onboarding matters more than query portability.
It can ingest OpenTelemetry data and integrate it with Datadog's service catalog, monitors, dashboards, and other platform workflows (OpenTelemetry documentation). That compatibility reduces reinstrumentation, but the higher-level configuration remains Datadog-specific. The benefit is breadth: application, infrastructure, logs, digital experience, security, and incident workflows can live under one vendor. Teams evaluating a parallel-run migration path can also review a step-by-step Datadog-to-OpenTelemetry migration guide that covers fan-out collector configuration, dashboard and alert translation, and attribute mapping.
The tradeoff is billing surface. Infrastructure, APM, logs, custom metrics, synthetics, and add-ons use separate meters, so elastic host counts, high-cardinality custom metrics, verbose logs, and wider module adoption can all move the bill. Datadog publishes its pricing and billing models and offers a free trial, but you should model the combined platform rather than one SKU.
Worth exploring if: You want the widest ready-made integration catalog and are comfortable standardizing operational workflows on Datadog.
Give it a pass if: Open query models, self-managed deployment, or a small number of billing dimensions are hard requirements.
2. Dynatrace
Best for: Large, dynamic estates where automatic discovery and causal topology are worth enterprise-platform complexity
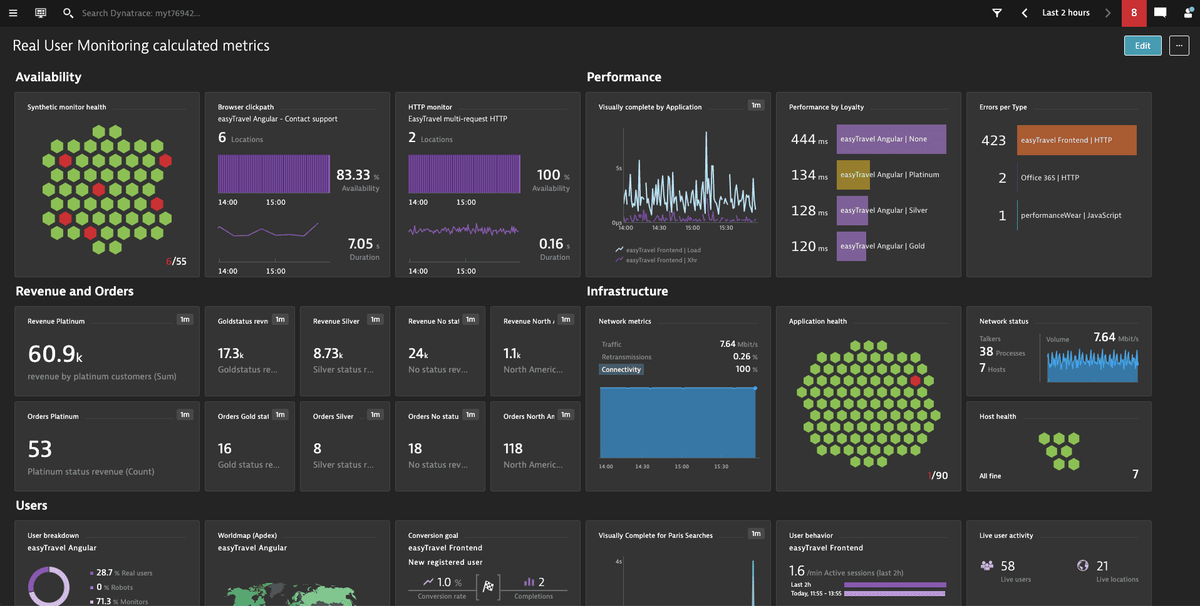
Dynatrace is strongest when the replacement project is really an automation project. OneAgent discovers application and infrastructure relationships, while Smartscape builds topology from metrics, events, logs, and traces; Davis uses those relationships during automated root-cause analysis (event correlation documentation).
That model works well across large Kubernetes, cloud, and traditional estates where manually maintaining service maps is unrealistic. Dynatrace also accepts OpenTelemetry data, but its deepest workflows revolve around Grail, DQL, Smartscape, Davis, and OneAgent. Migration therefore preserves telemetry collection more readily than it preserves queries, dashboards, and operational habits.
Dynatrace publishes a detailed rate card with meters such as host or memory-GiB hours, pods, ingested data, retained data, and platform operations. Public pricing and a trial improve buying access, but a mixed estate can activate several dimensions; validate OneAgent modes and retention assumptions against production inventory.
Worth exploring if: Automated topology, fleet management, and causal analysis can replace meaningful manual SRE work.
Give it a pass if: Your target is a lightweight OTLP backend with PromQL-oriented, easily portable operational configuration.
3. New Relic
Best for: Teams that want one SaaS data platform and a relatively short path from signup to useful APM
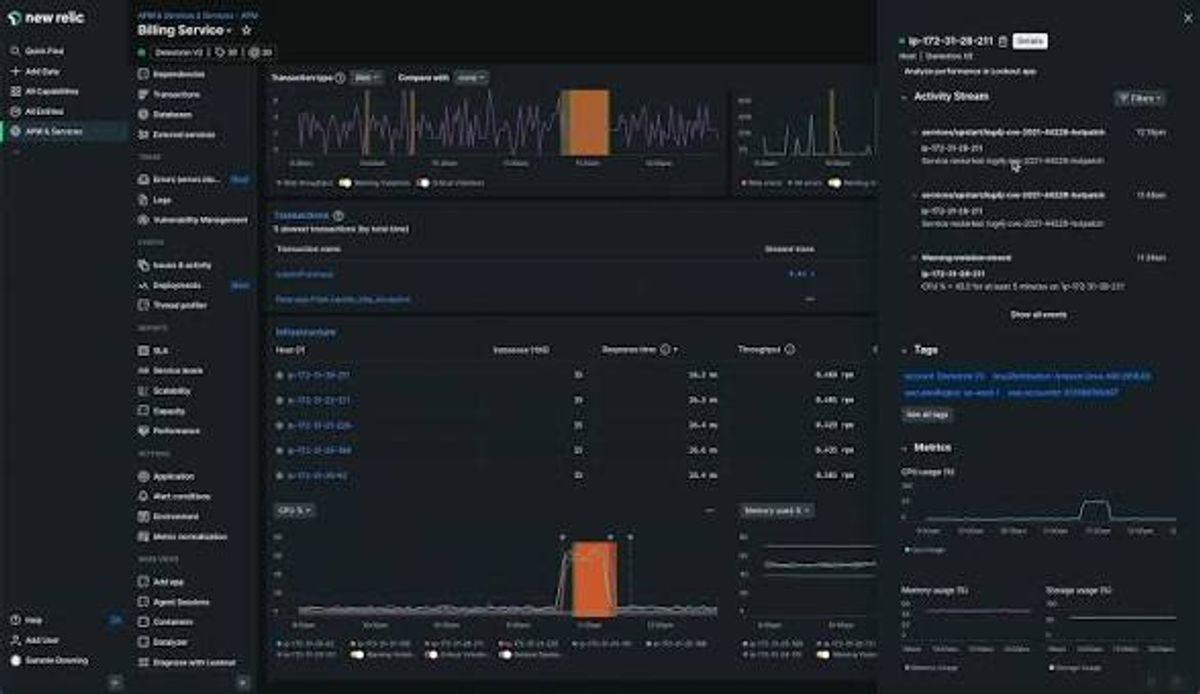
New Relic stores core telemetry types in NRDB and uses NRQL across logs, dimensional metrics, events, and spans. That gives engineers a consistent analytics surface and lets them view logs alongside APM data rather than bridge to a separate log platform (New Relic data types).
Its agent catalog and curated APM experiences make onboarding straightforward, while native OTLP ingest lets OpenTelemetry-instrumented services participate in the platform. The compromise is that NRQL, dashboards, alerts, entity metadata, and curated workflows remain New Relic-specific. Teams should also test how sampled events and raw metric query limits affect investigations rather than assuming every NRDB data type behaves identically.
New Relic pricing combines data ingest with user access and, for some newer capabilities, advanced compute (pricing model). Public pricing, a free tier, and self-service onboarding make evaluation easy. Forecast both data growth and the number of engineers who need billable curated experiences; neither dimension stays flat automatically.
Worth exploring if: You want unified SaaS analytics without assembling separate signal backends.
Give it a pass if: You require self-hosting or want your query and alert configuration to remain usable outside New Relic.
4. Grafana Cloud
Best for: Teams already fluent in Grafana and Prometheus that want managed metrics, logs, traces, and profiles
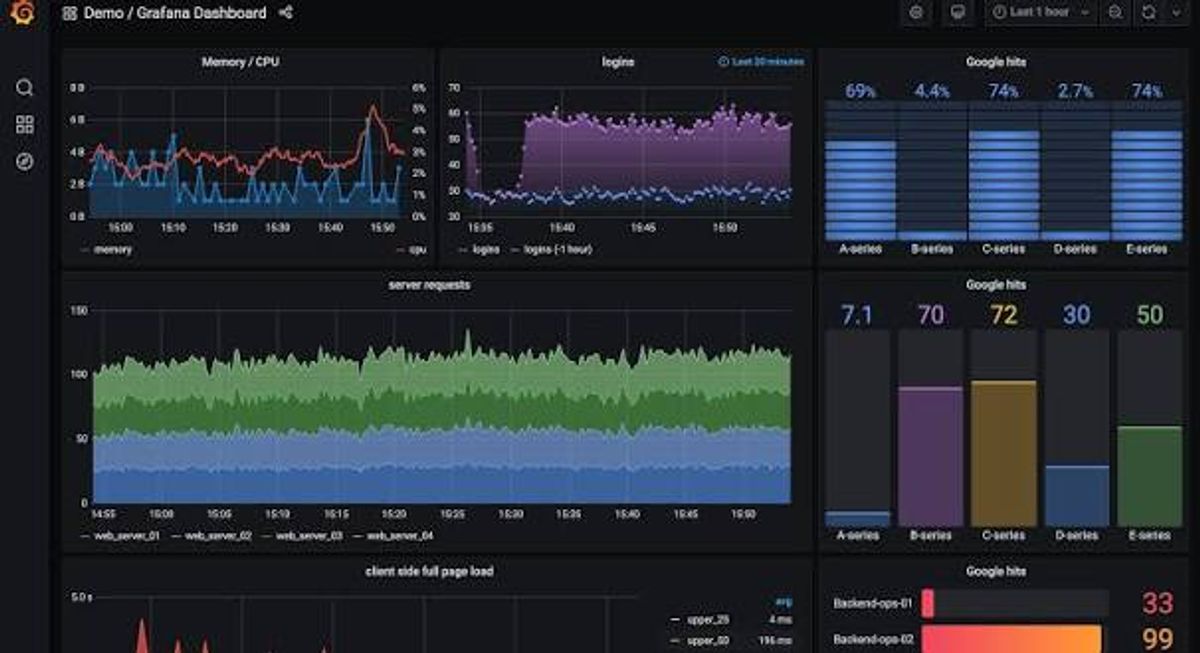
Grafana Cloud turns the Grafana ecosystem into a managed service: Prometheus-compatible metrics, logs, traces, profiles, dashboards, alerting, and an OpenTelemetry endpoint are available without operating the storage layer. It accepts OTLP metrics, logs, and traces directly (OTLP documentation).
Its main advantage is ecosystem flexibility. Existing PromQL knowledge, dashboards, exporters, and OpenTelemetry pipelines can carry over more readily than with a proprietary suite. The cost of that flexibility is cognitive: Grafana Cloud uses PromQL for metrics, LogQL for logs, and TraceQL for traces, so cross-signal work still spans distinct backends and query patterns (query language documentation).
Metrics billing considers active series and data points per minute at the 95th percentile; logs, traces, and profiles add processing, retention, and in some cases query dimensions (metrics billing, signal billing). A free tier and trial support evaluation, but scrape intervals, cardinality, retention, and application-observability host hours all deserve modeling.
Worth exploring if: Your team wants managed operations without leaving the Prometheus, Grafana, and OpenTelemetry ecosystem.
Give it a pass if: You want one query model and heavily curated cross-signal workflows more than backend flexibility.
5. Elastic Observability
Best for: Log-centric organizations that need strong search plus cloud, serverless, or self-managed deployment choices
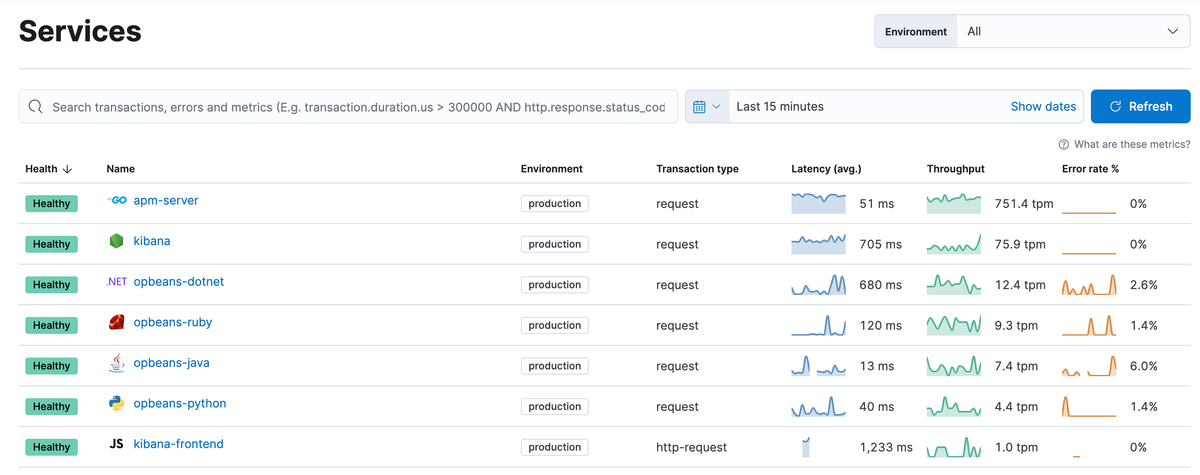
Elastic Observability uses Elasticsearch as a common analytics foundation for logs, metrics, application traces, and user-experience data (solution overview). This is a credible Splunk replacement path when log search and long-term data control matter as much as APM. Elastic also provides distributions of OpenTelemetry and a managed OTLP endpoint for logs, metrics, and traces.
Deployment choice is the differentiator. Elastic Cloud Serverless manages scaling, Hosted exposes more capacity decisions, and a self-managed cluster gives you full control and full operational responsibility. The last option can satisfy residency or infrastructure requirements that rule out SaaS-only competitors, but shard sizing, data tiers, index lifecycle policies, upgrades, and query performance become your problem.
Elastic Cloud Hosted bills provisioned resources; Serverless uses consumption-based dimensions, while self-managed costs combine your infrastructure and operations with any paid subscription. Elastic publishes resource-based pricing guidance and offers a trial. Forecast hot-tier capacity, retention, replicas, query load, and egress rather than treating ingest volume as the only driver.
Worth exploring if: Search depth, log volume, deployment control, or reuse of an existing Elastic estate drives the decision.
Give it a pass if: You want a fully managed APM experience with minimal backend and data-lifecycle tuning.
6. Chronosphere
Best for: Large Kubernetes and Prometheus estates where controlling telemetry growth is a platform requirement
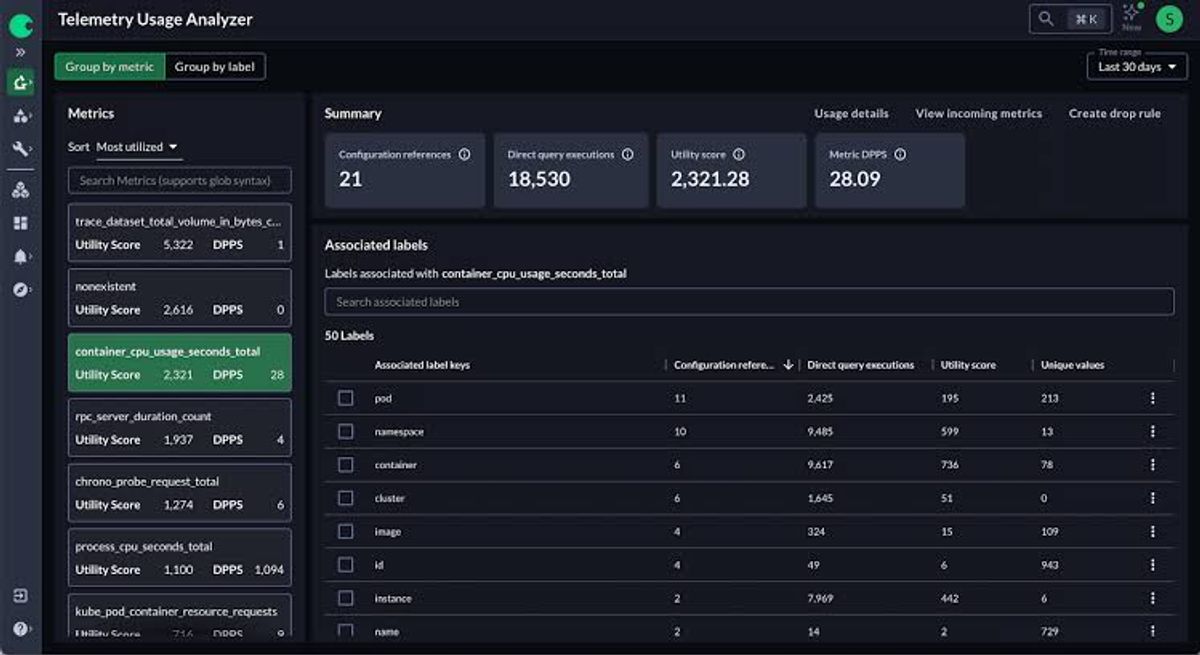
Chronosphere targets organizations whose main problem is observability data at scale. It supports Prometheus-compatible metrics, OpenTelemetry ingestion, traces, and logs, while its Control Plane can aggregate or drop low-value metrics and change trace sampling before persistence. Metrics remain fully PromQL compatible, which lowers migration friction for Prometheus-heavy teams.
The strongest differentiator is governance. Recommendations identify unused metrics and labels, and teams can compare the effect of shaping rules on persisted writes and cardinality (shaping recommendations). That is valuable when cardinality and volume management are themselves platform-engineering responsibilities, not occasional cleanup tasks.
Buying is enterprise and contract-led rather than a simple public rate card. Licensing can track processed and persisted bytes, writes, cardinality, and separate signal dimensions; the product exposes usage against those contract limits (licensing documentation). Controls improve predictability, but they require ownership and policy design.
Worth exploring if: Your platform team must govern Prometheus and OpenTelemetry data across a very large, fast-changing estate.
Give it a pass if: You need self-service procurement, a small-team setup, or do not have a platform team to own telemetry policy.
7. Dash0
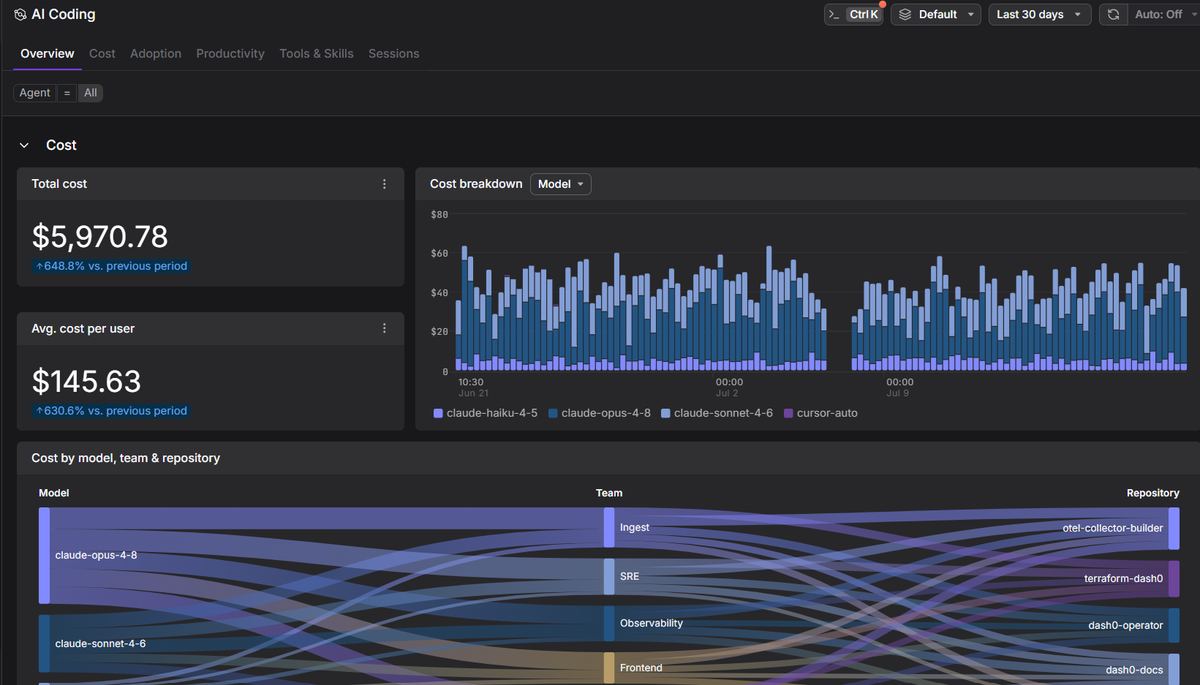
Best for: OpenTelemetry-first teams seeking a managed backend with portable instrumentation and fewer billing dimensions
Dash0 is built around OTLP ingestion, PromQL, OpenTelemetry semantic conventions, and Perses-based dashboards. That reduces instrumentation lock-in and keeps Prometheus alerting and dashboard concepts familiar, although saved investigations, resource rules, and other product workflows still create switching costs.
The platform correlates logs, metrics, traces, resources, and web events, with ingestion-time spam filters for dropping low-value telemetry before storage and billing. Its Kubernetes operator installs an OpenTelemetry collector and automatically instruments Java, Node.js, and .NET workloads out of the box, with opt-in support for Python and Ruby. That list is also the honest limitation: other runtimes need existing OpenTelemetry instrumentation or manual setup (operator overview).
Dash0 pricing uses separate per-data-point meters for metrics, spans, log records, and web events, without per-seat or base-platform charges; a 14-day trial is public. Record-based billing is easy to explain, but noisy high-volume signals still raise spend unless you filter them.
Worth exploring if: You are standardizing on OpenTelemetry and want cost controls plus PromQL-oriented operations in a managed service.
Give it a pass if: You require self-hosting, automatic instrumentation for a runtime outside the documented list, or the integration depth of a long-established suite.
8. Honeycomb
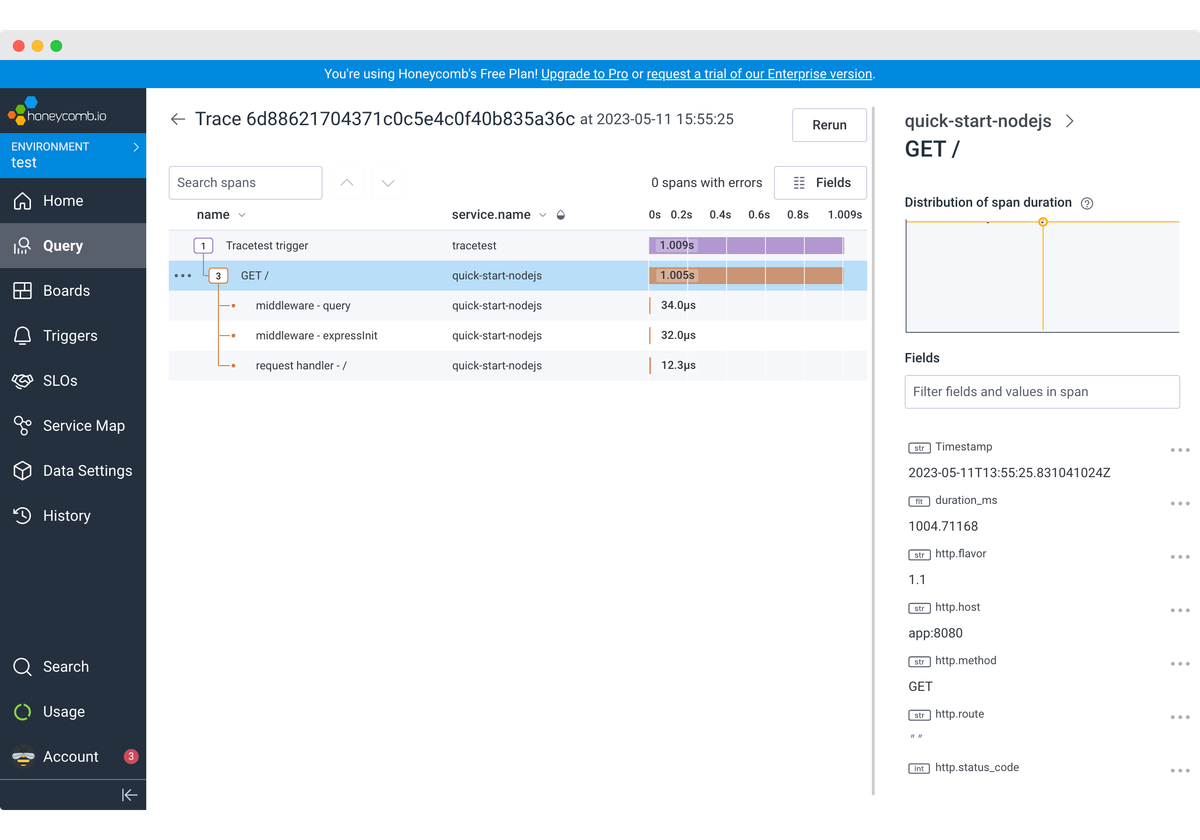
Best for: Developer-led teams investigating novel production failures in high-cardinality distributed systems
Honeycomb centers investigation on wide, structured events. Traces and logs are stored as events with fields available for high-dimensional queries, while metrics use dedicated time-series datasets (signal model). OpenTelemetry is the primary instrumentation path, so existing OTel services move cleanly at the collection layer.
The standout workflow is BubbleUp: select an anomalous region and Honeycomb compares its dimensions with the baseline, surfacing attributes such as customer, endpoint, build, or region that correlate with the difference (BubbleUp documentation). This is excellent for unknown-unknown debugging. It is less like Splunk's conventional log-search experience, so teams should test it with their actual on-call questions rather than judging it from a feature matrix.
Honeycomb measures usage in events and metric data points, with public Free and Pro plans and enterprise purchasing (usage calculation). Event volume, metric frequency, and retention are the main forecast inputs; high cardinality itself does not require predeclared indexes, but richer telemetry can still increase event volume.
Worth exploring if: Your engineers value fast, high-cardinality exploratory debugging over a traditional monitoring-console workflow.
Give it a pass if: Your primary replacement job is broad infrastructure monitoring or unstructured enterprise log search with a large ready-made integration catalog.
Comparison table
| Tool | Best fit | Main strength | Main tradeoff | Pricing model |
|---|---|---|---|---|
| Datadog | Broad SaaS standardization | Integration and product breadth | Proprietary workflows and many meters | Separate host, ingest, usage, and add-on meters |
| Dynatrace | Complex enterprise estates | Automatic topology and causal analysis | Platform and query-model complexity | Consumption across hosts, memory, data, and platform operations |
| New Relic | Fast unified SaaS onboarding | NRDB and NRQL across telemetry | Proprietary configuration; data plus user costs | Data ingest, user access, and advanced compute |
| Grafana Cloud | Prometheus/Grafana teams | Open ecosystem and managed backends | Three signal-specific query languages | Active series/DPM plus signal processing, retention, and queries |
| Elastic Observability | Logs and deployment control | Search depth and deployment choice | Self-managed operational burden or cloud capacity planning | Hosted resources, serverless consumption, or self-managed costs |
| Chronosphere | Very large cloud-native estates | Telemetry shaping and governance | Sales-led buying and platform ownership | Contract dimensions by processed and persisted telemetry |
| Dash0 | OpenTelemetry-first teams | Portable instrumentation and simple cost controls | SaaS-only with narrower auto-instrumentation coverage | Per-signal telemetry records/data points; no seat fee |
| Honeycomb | High-cardinality debugging | Wide-event exploration and BubbleUp | Less conventional for broad monitoring and log-search buyers | Events and metric data points |
Final thoughts
The serious alternatives divide into four approaches. Datadog, Dynatrace, and New Relic offer the broadest managed-suite experience, but they replace Splunk-specific configuration with their own agents, queries, workflows, and billing dimensions. Grafana Cloud and Dash0 lean harder on OpenTelemetry and open operational models; Grafana provides more ecosystem flexibility, while Dash0 presents a more opinionated cross-signal experience. Elastic is the strongest deployment-control option, Chronosphere is built for telemetry governance at very large scale, and Honeycomb is the specialist choice for exploratory high-cardinality debugging.
Before replacing Splunk Observability Cloud, run the same production incident through each finalist and measure the path from alert to service, trace, log, deployment, and owner. Export an inventory of SignalFlow, detectors, dashboards, RBAC, retention, collectors, and Splunk Cloud log mappings; then price a representative month that includes a traffic spike, a high-cardinality release, and your real retention policy. Finally, separate instrumentation portability from migration effort: OpenTelemetry can preserve collection and transport, but queries, dashboards, alert rules, sampling policies, and response workflows still need validation. If Dash0 matches the OpenTelemetry-first path, test those assumptions with the Dash0 free trial.