Last updated: July 24, 2026
Find Performance and Error Outliers
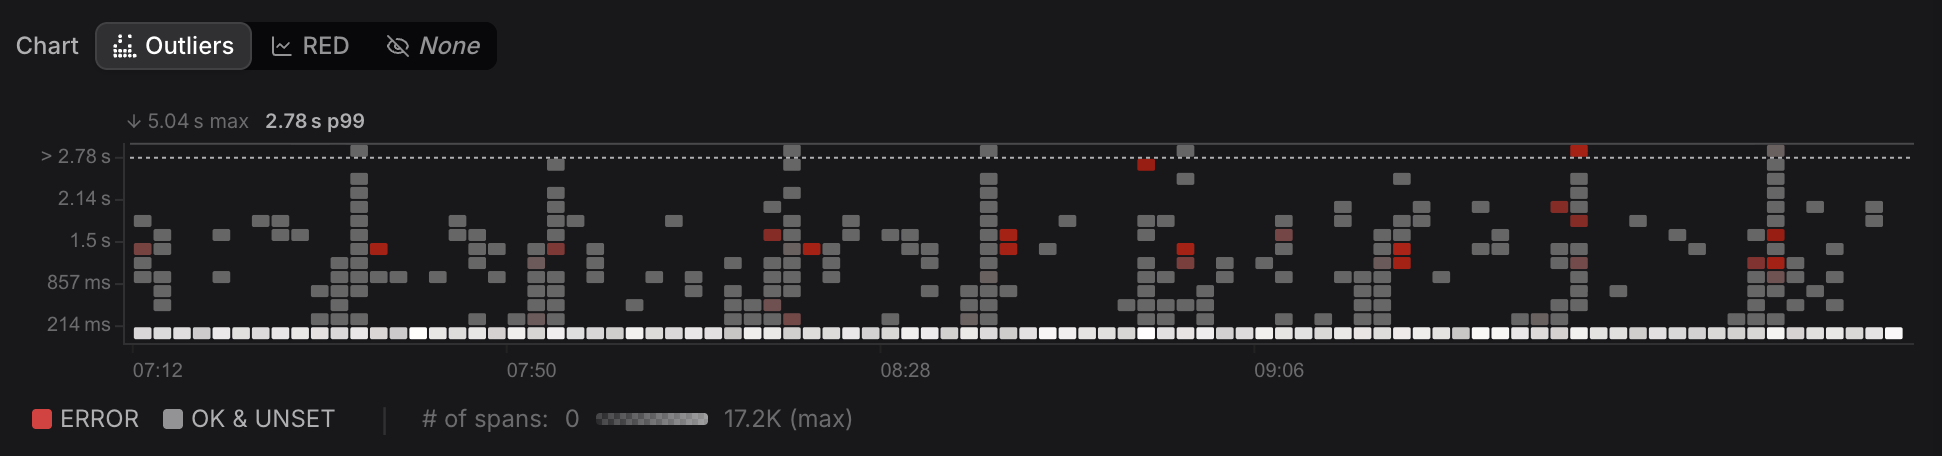
The Outliers Map is a visualization for understanding the distribution and health of spans over time. It is specifically helpful in surfacing outliers in performance and error rate.
Select a Region
Click and drag to select a region of the Outliers Map. After creating the selection, you can move and resize it to change the region.
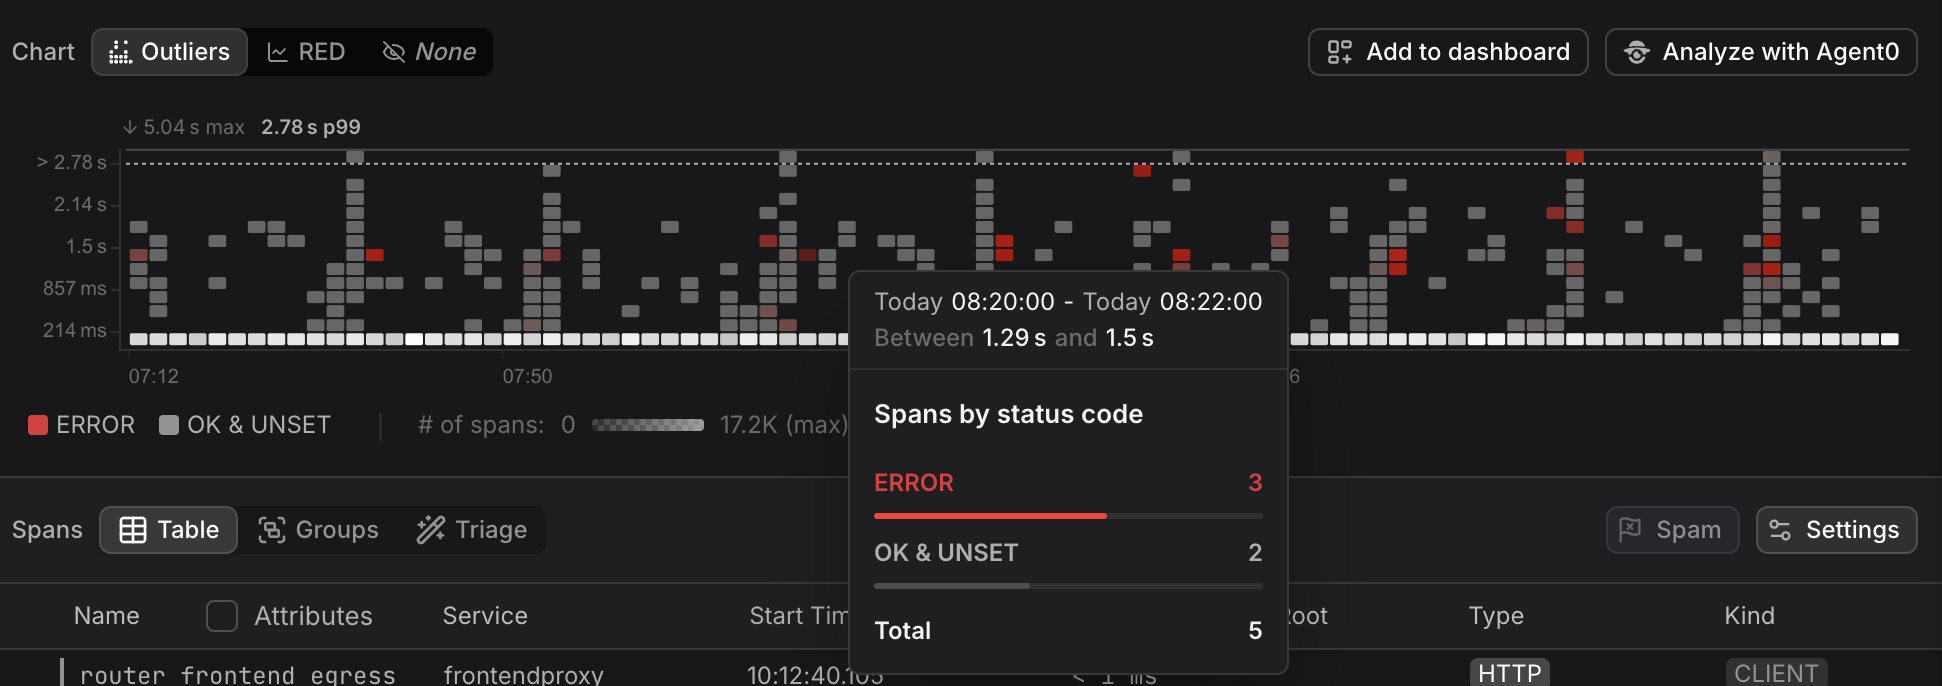
Use selections to compare a specific time window or duration band against a baseline.
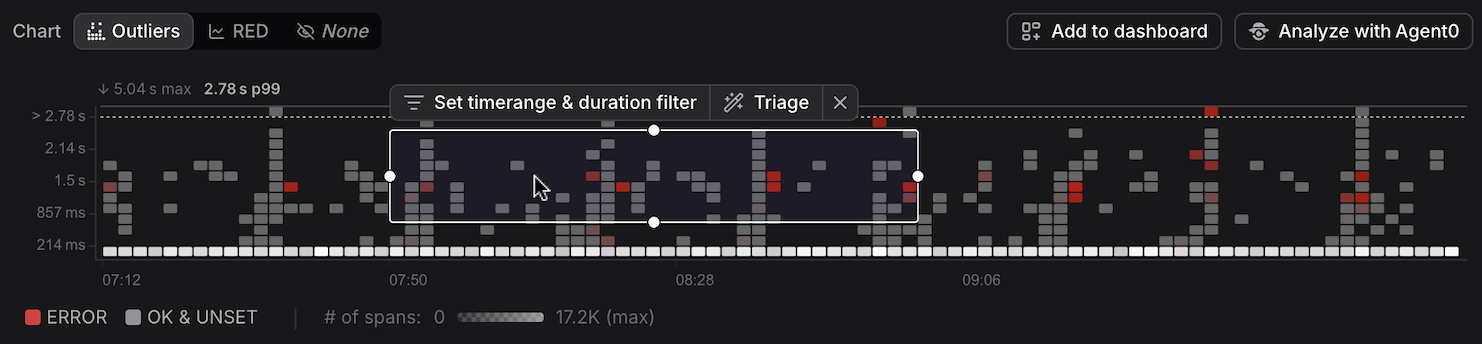
The selection:
- Filters the Span Table below it to show only spans within the selected region, which you can finetune by clicking Set time range & duration filter right above the selection.
- Defines the analysis group for Triage, which you can access directly by clicking Triage right above the selection.
- Defines the initial analysis group that is used when you switch to RED Metrics.
- Defines the dashboard that is created when you click Add to dashboard above the selection.
- Defines the inferred context in the Agent0 prompt when you click Analyze with Agent0 above the selection.
The Outliers Map does not support creating alerting rules directly. Because it combines multiple time series (error spans and non-error spans) to produce its coloring, there is no single metric to alert on. To alert on error patterns, use RED Metrics instead.
Understand the Dimensions
Instead of a standard three-dimensional heatmap, each pixel in the Outliers Map encodes four pieces of information simultaneously.
- X-axis: time
- Y-axis: duration. The Y-axis uses a non-linear scale. The last tick is always reserved for the range between P99 and the maximum observed duration. This ensures extreme outliers remain visible without distorting the rest of the distribution.
- Brightness: concentration of spans in that bucket, proportional to the rest of the map — the brighter a region, the more spans fall within it relative to the overall distribution
- Redness: percentage of spans in the bucket with span status code
ERROR
- Redness reflects the OpenTelemetry span status code attribute, not an HTTP response status code. A span is considered erroneous only when its status is explicitly set to
ERROR. - HTTP status codes do not automatically translate to span errors. According to OpenTelemetry semantic conventions,
5xxresponses are always recorded as span errors, but4xxresponses are only considered errors on the client side — a404or422on a server span is not automatically an error.