Last updated: July 24, 2026
Visualize the Full Trace
The Trace View provides a detailed look at a single trace, showing all spans and their relationships.
If a span has incoming span links from other traces, those upstream spans are visible in the Trace View. This allows you to follow a request chain across trace boundaries.
The Trace View offers three visualizations of the same data.
Waterfall
The Waterfall view lists spans as rows in a tree that shows the parent-child hierarchy of the trace.
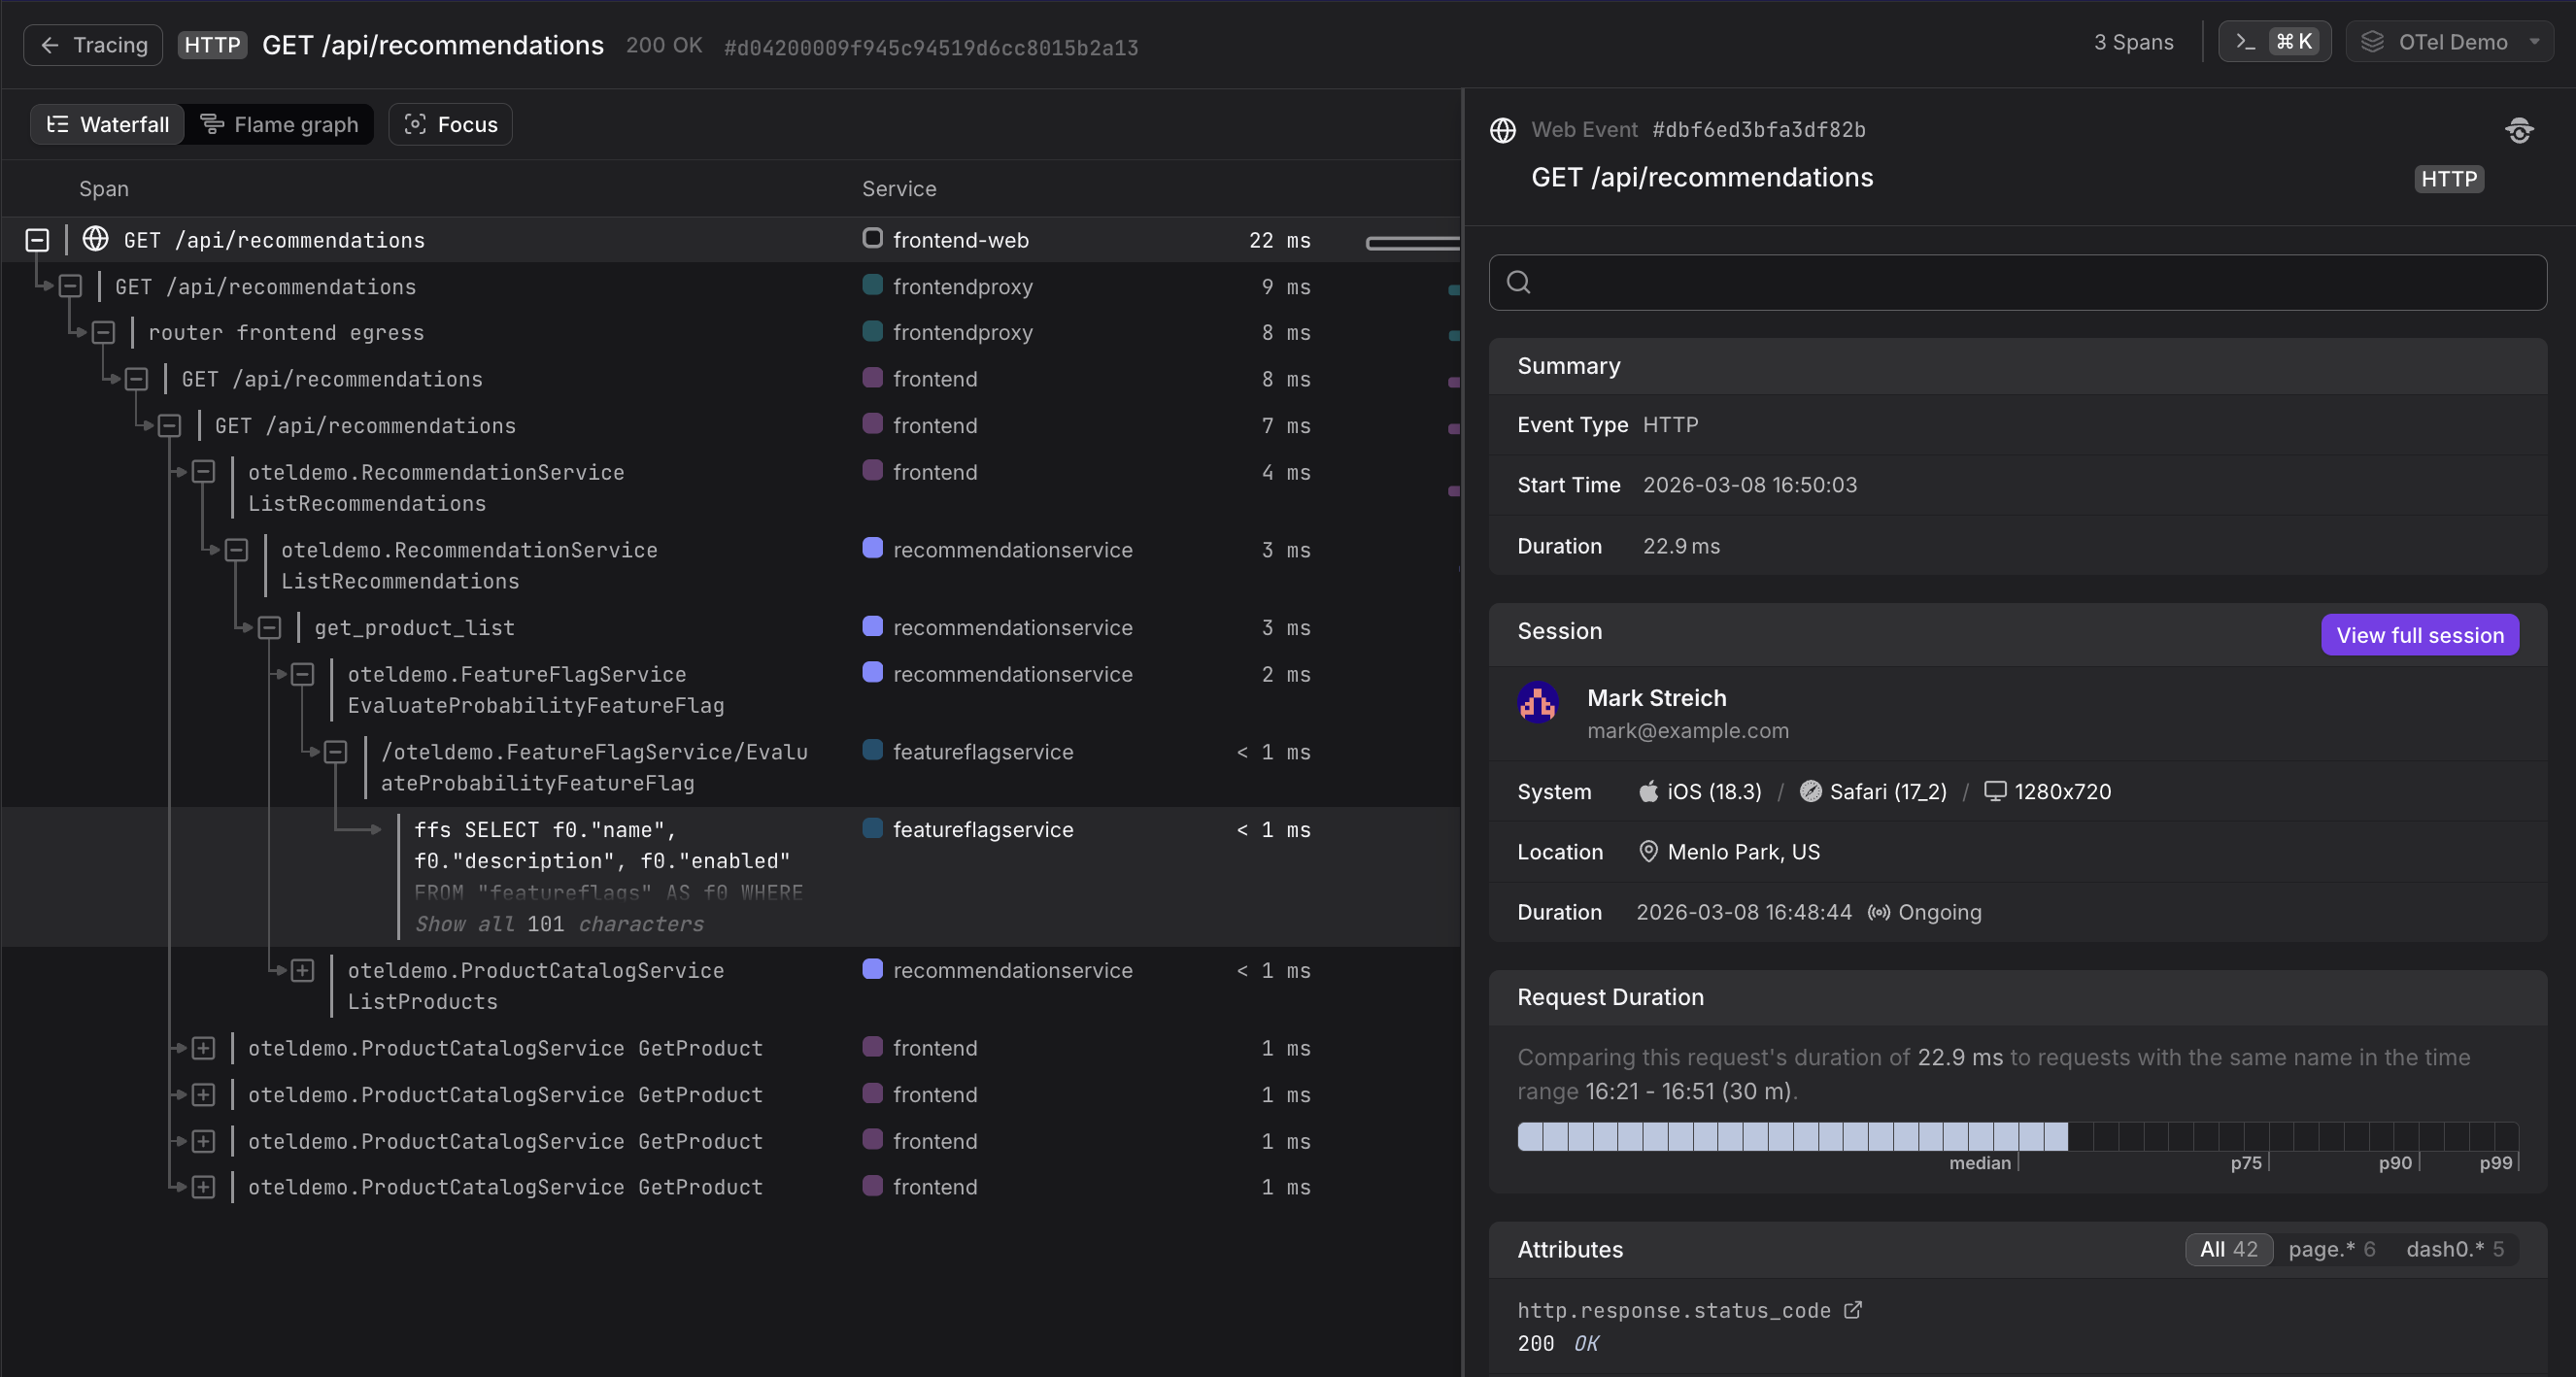
Each row shows:
- The span name and its position in the call tree, indented to reflect nesting depth
- The service name the span belongs to, shown alongside a colored dot that identifies the service consistently across the view
- The duration in milliseconds
- A proportional bar on the right, showing when the span started and ended relative to the total trace duration
Selecting a span opens the Span Sidebar on the right, showing the Overview, Attributes, Resource, Infrastructure, Related Logs & Events, and Links tabs for that span.
The top of the trace may include a Web Event entry — a span originating from web monitoring that triggered the trace. When selected, this entry shows a Session panel in the sidebar with the user's name, email, system details (OS, browser, screen resolution), and location. A View full session button links to the full web monitoring session. A Request Duration chart is also shown, comparing the duration of this specific request against requests with the same name over the selected time range.
Flame Graph
The Flame graph renders spans as colored, labeled blocks on a shared timeline. The X-axis represents absolute time in milliseconds, and blocks are stacked vertically by call depth — the root span at the top, with child spans appearing below it.
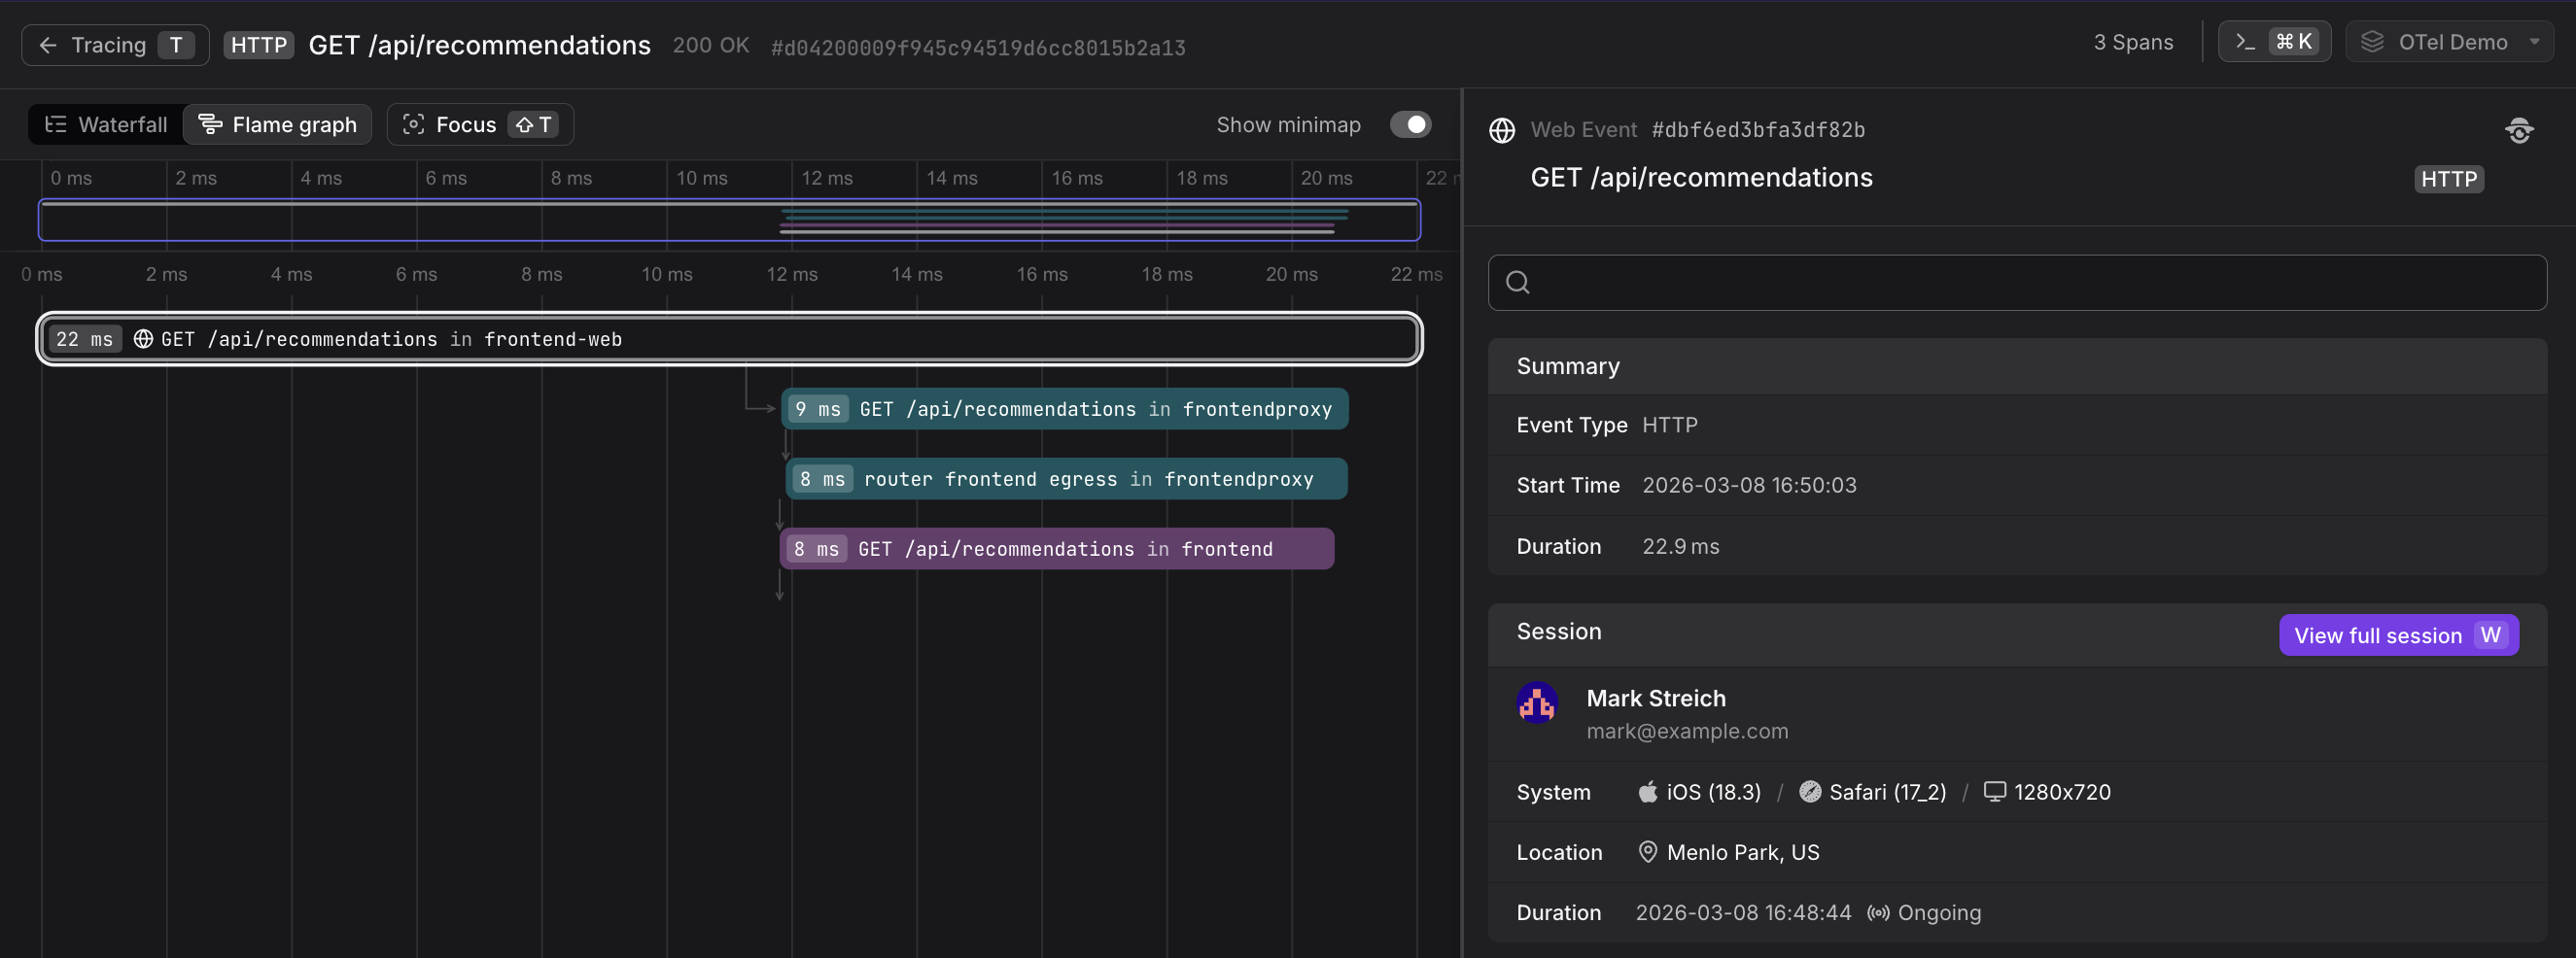
Each block displays the span's duration, name, and service. Spans from the same service share a color, making it easy to visually identify which service is responsible for which portion of the trace.
A minimap at the top of the view shows the full trace compressed into a narrow strip, with a highlighted selection window indicating the currently visible region. Drag the selection window left or right to pan through the trace, or resize it to zoom in or out. Toggle Show minimap to show or hide it.
Selecting a span in the Flame graph opens the same Span Sidebar as in the Waterfall view.
Trace Graph
The Trace Graph renders a distributed trace as a service topology diagram, where each node represents a service and edges represent calls between them.
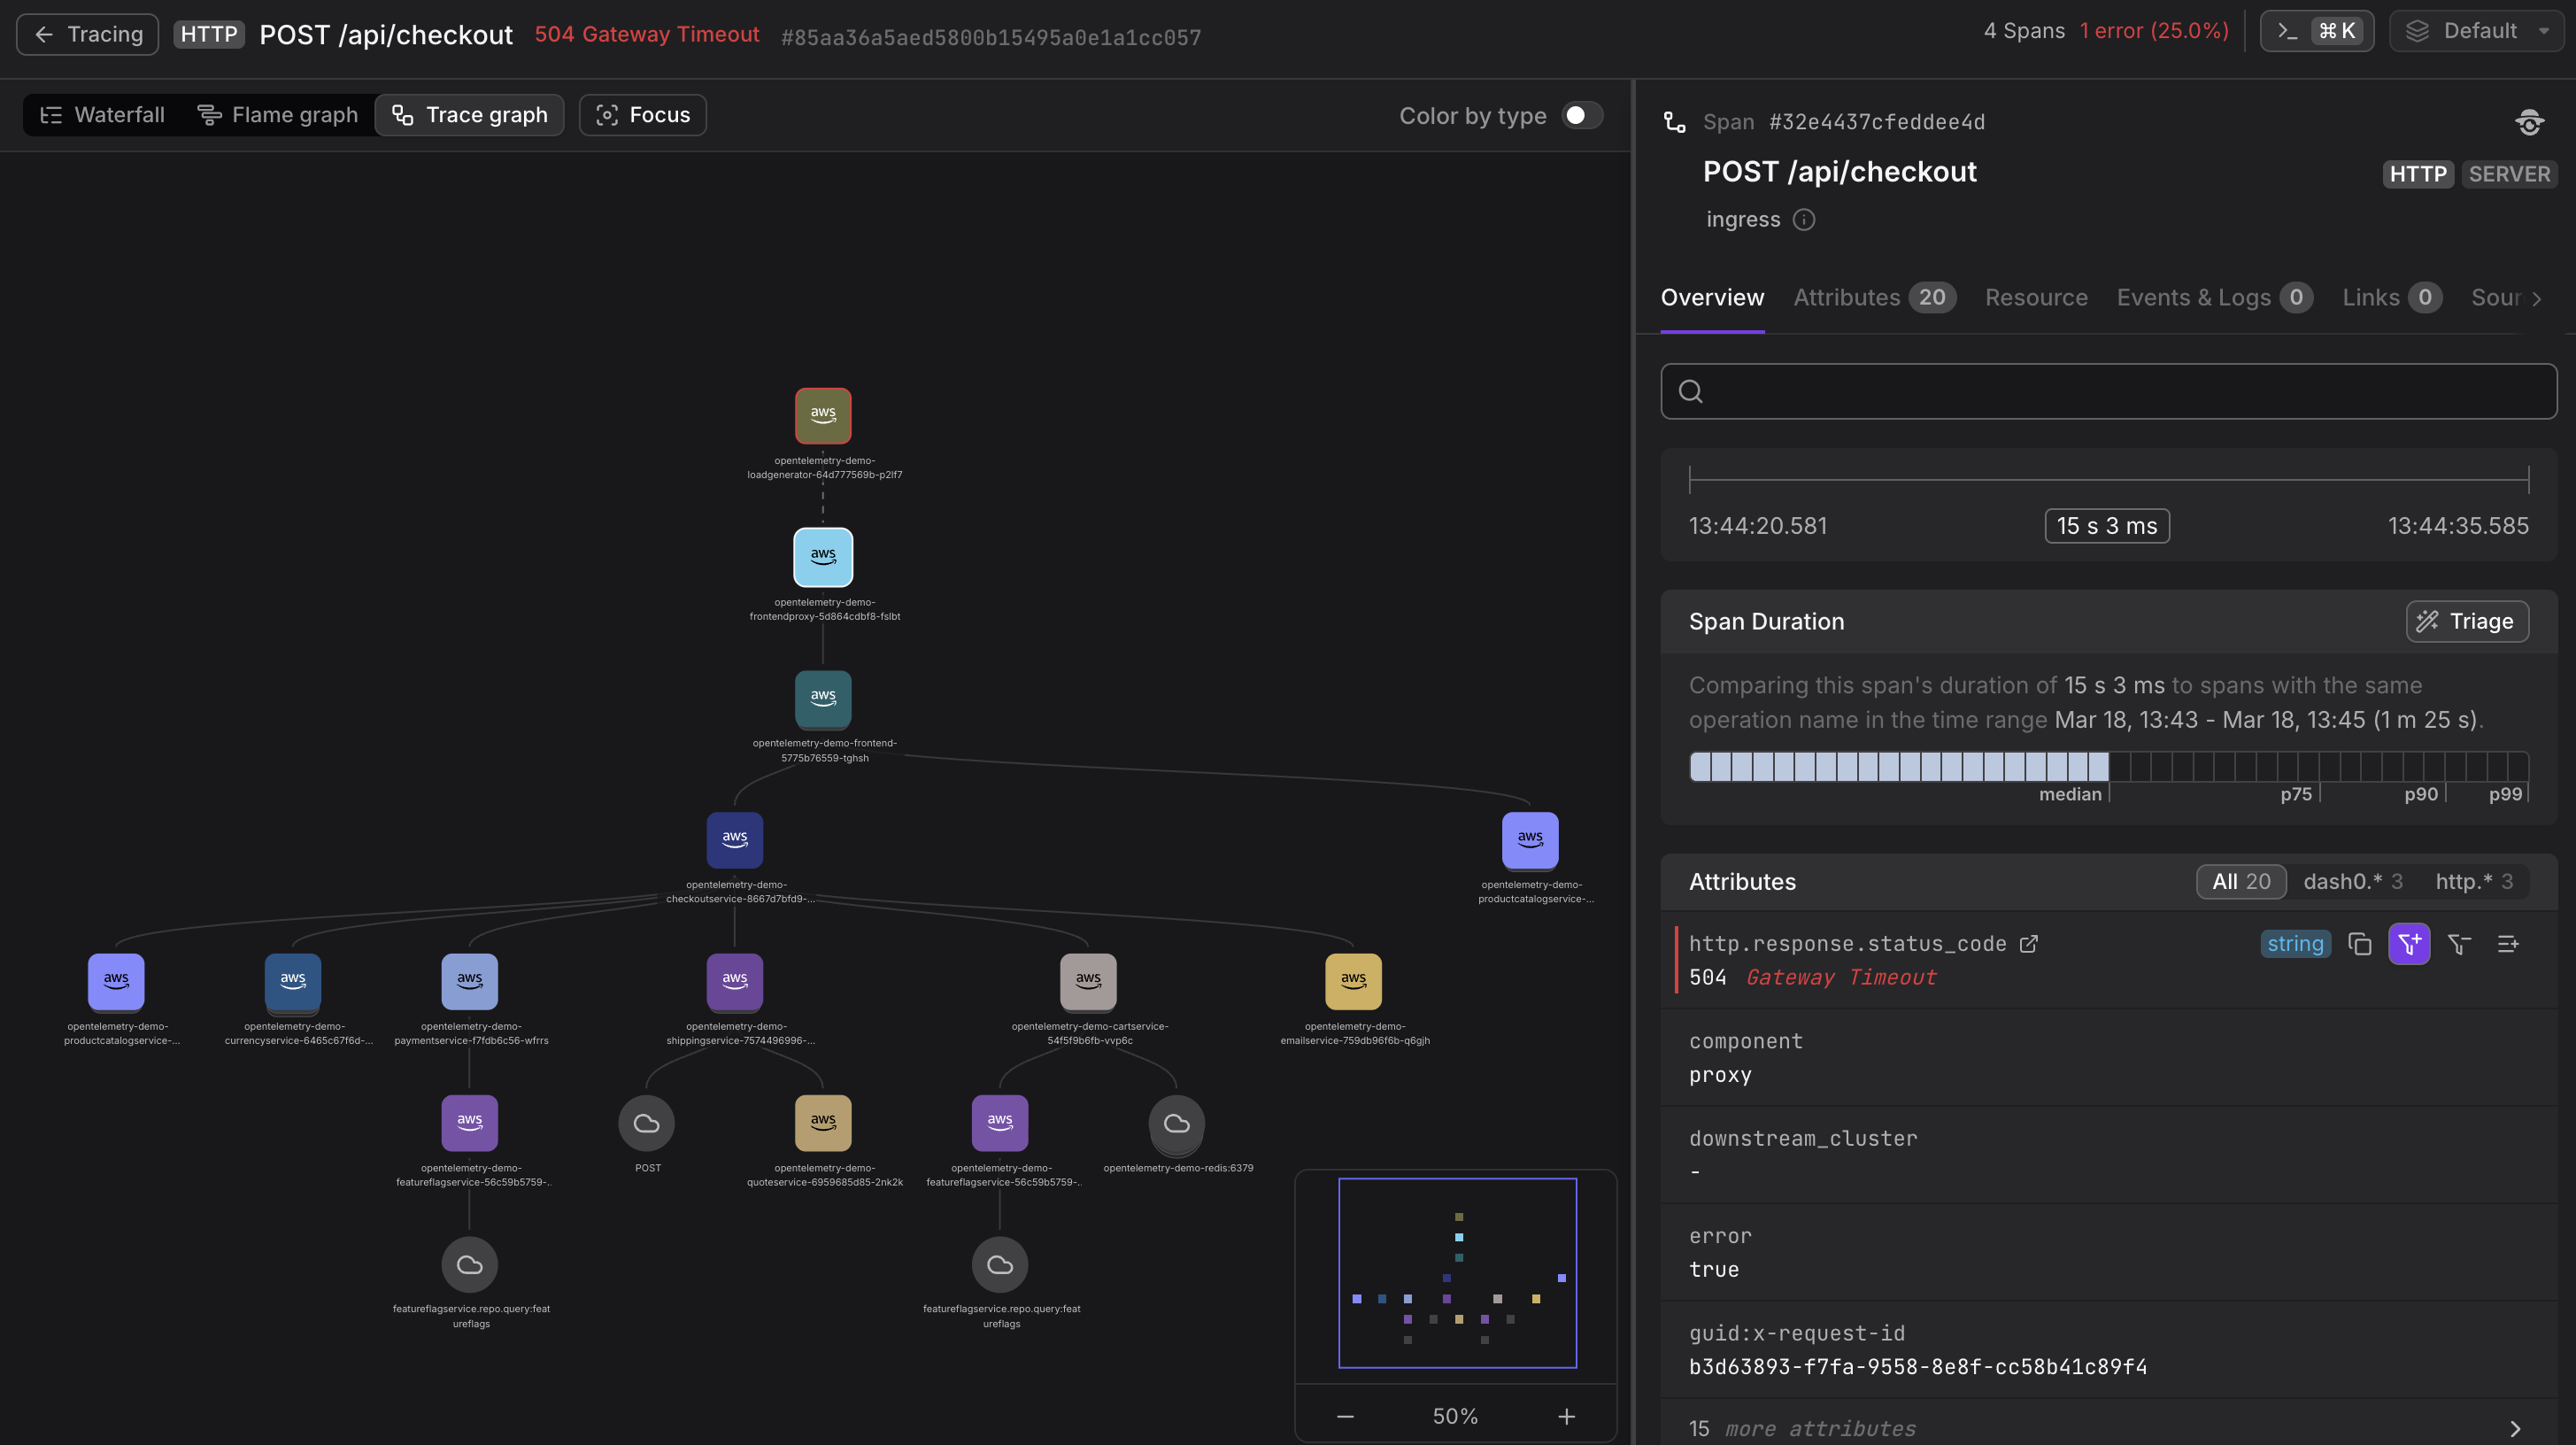
Each node shows:
- Node color consistent with the Waterfall and Flame Graph, so services are visually identifiable across all three views
- A red border if that service reported at least one error within this trace
- A stacked appearance if the service was called multiple times — due to retries or fan-out. Click to expand and compare individual calls by timestamp, duration, and error status.
External dependencies that don't emit spans to Dash0 — such as databases or third-party APIs — appear as grey inferred nodes. Clicking one shows its request count, error rate, and average duration within this trace.
Selecting a node opens the Span Sidebar for the corresponding spans.