Last updated: July 24, 2026
Browse and Filter Spans
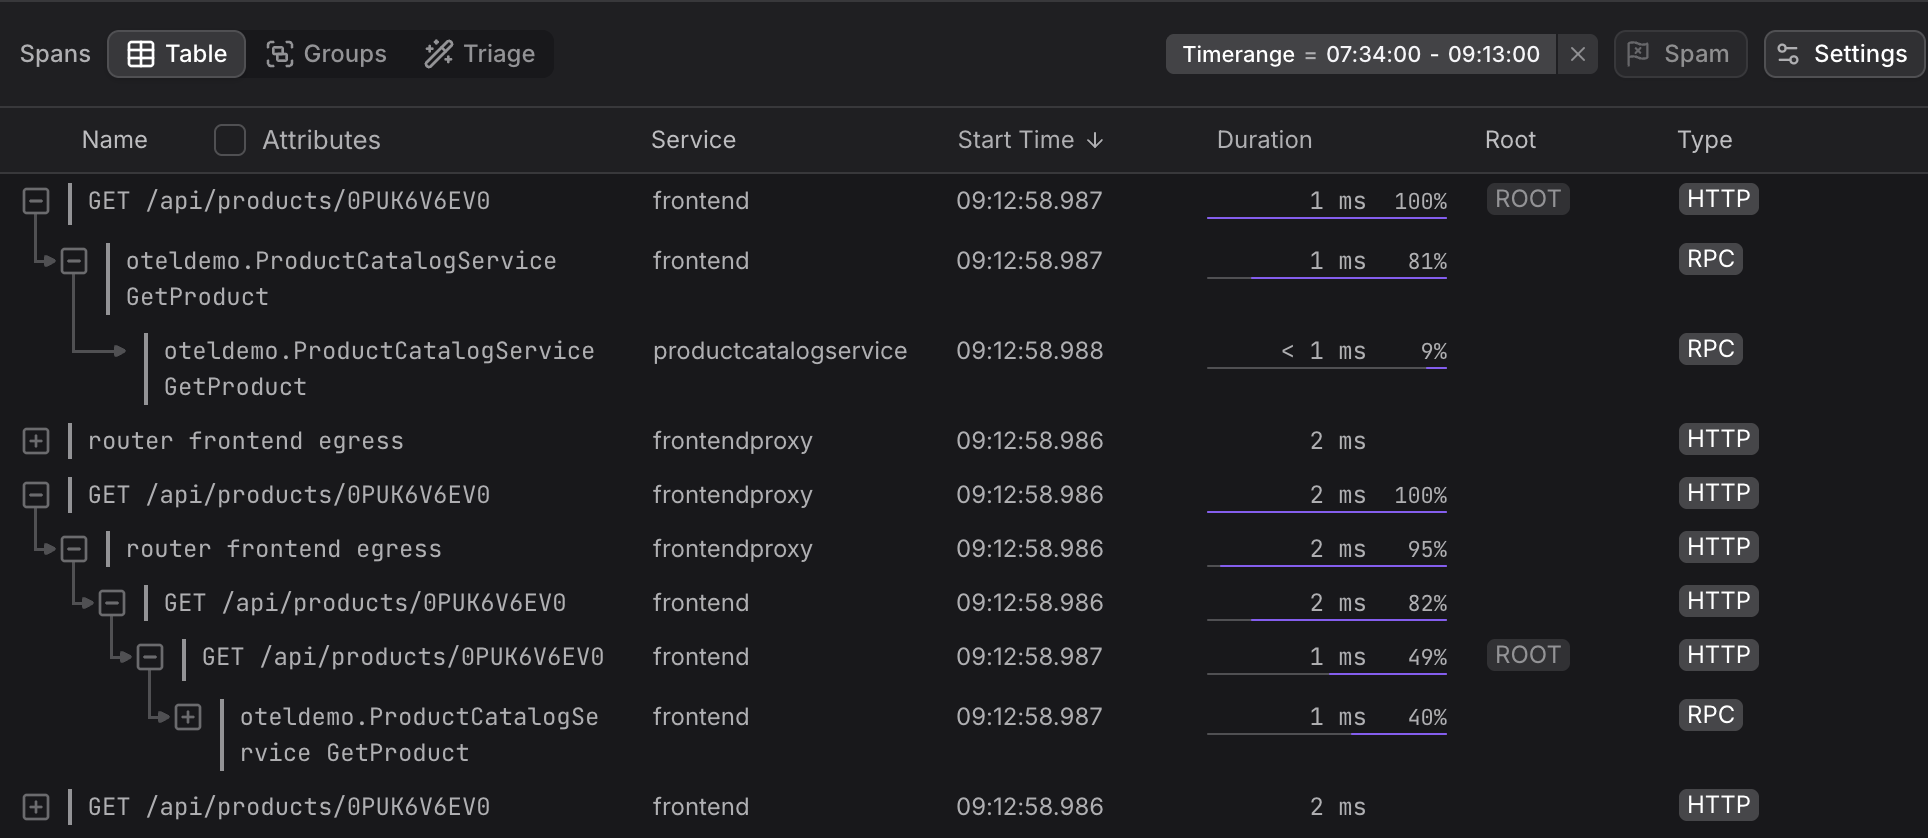
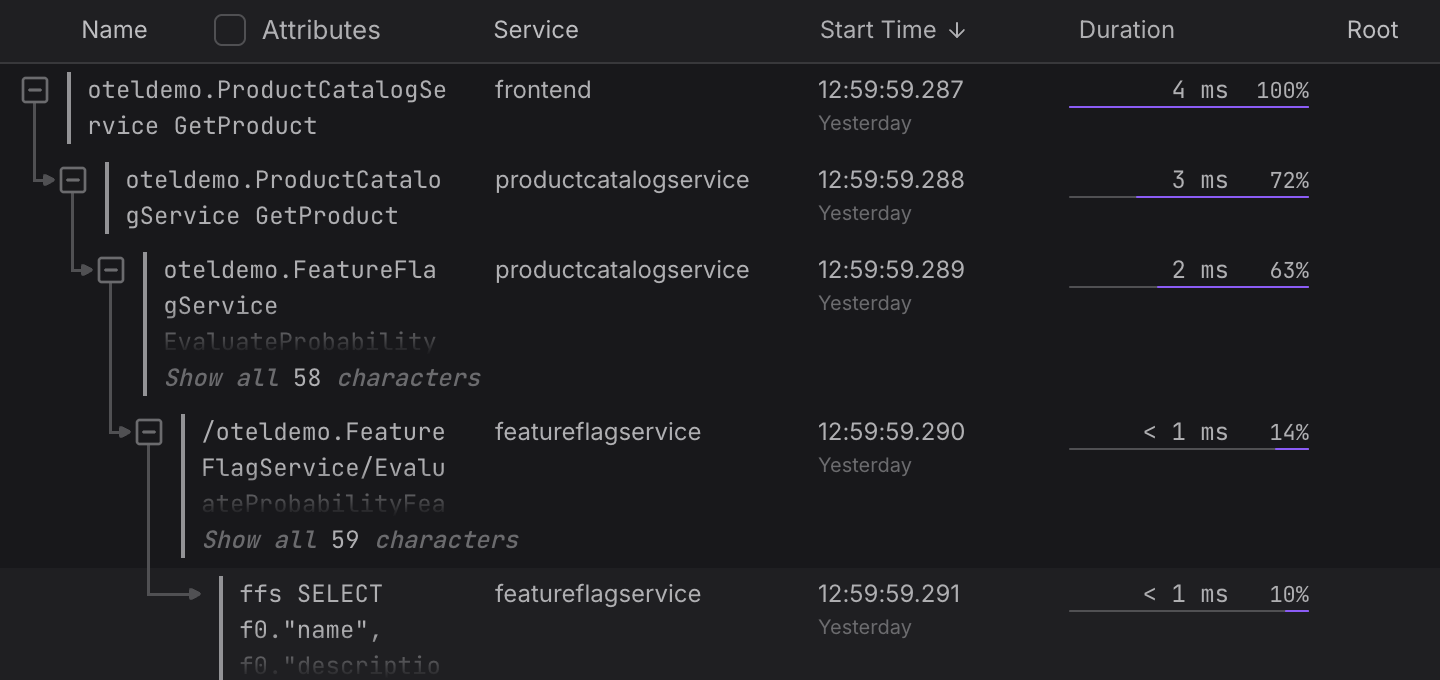
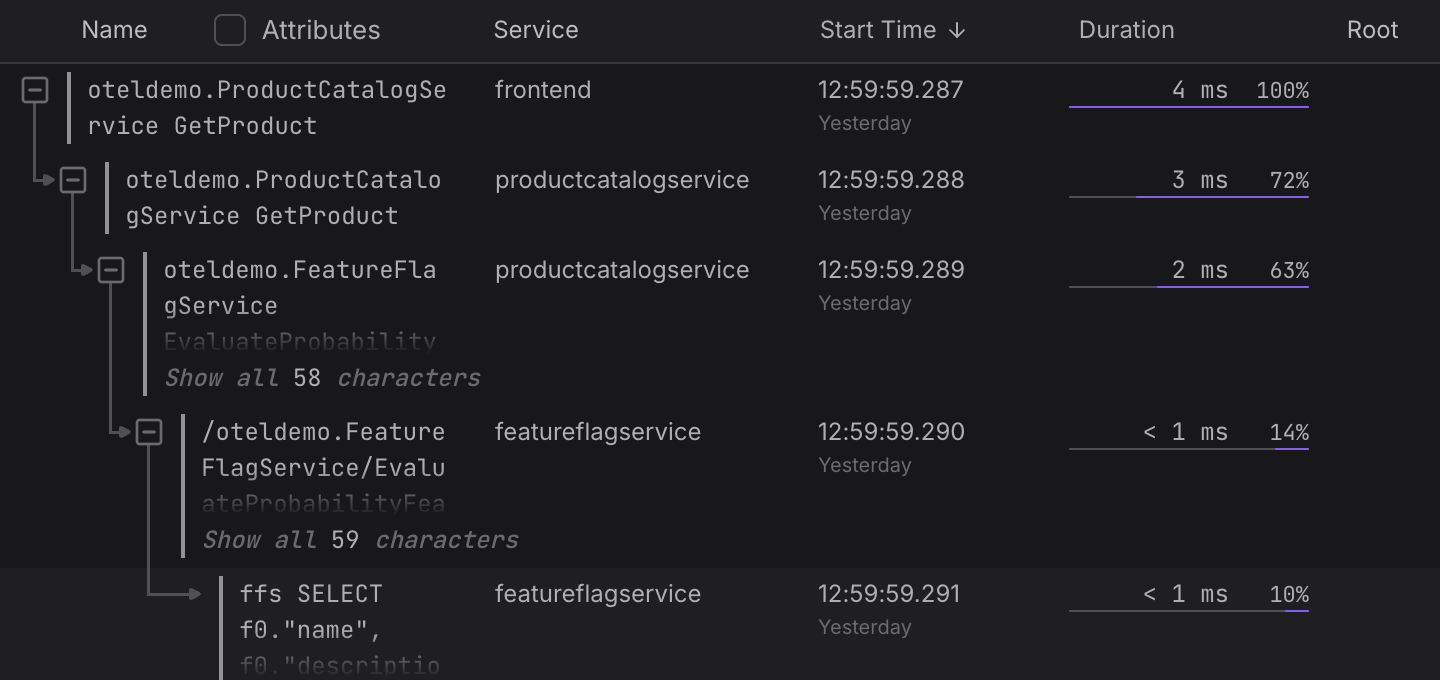
The Span Table displays spans as a tree that shows the parent-child relationships within a trace.
The Span Table groups by service, not by resource. This differs from the Log Explorer, which uses resources as its reference point.
The distinction is intentional:
- Tracing concerns the logical service — what operation happened and where in the call graph.
- Logs are tied to the specific infrastructure instance (container, pod) that emitted them — mixing logs from different containers running the same software can obscure per-instance behavior.
-
When you apply a filter, the table shows spans that match the criteria. Descendant spans appear beneath each matching span regardless of whether they themselves match — so you always see the full structural context of a matching span without losing the tree structure.
-
The Span Table traverses span links forward. If a span in another trace points to a span in the current view, you can navigate downward from that span through its descendants.
-
The Duration column expresses all durations relative to the reference span, which is always shown as 100%.
The reference span is not necessarily the trace root — it is the span used as the frame of reference for the current view. This design reflects that most traces are effectively synchronous: parents start before and end after their children. Asynchronous patterns exist but are less common.
TipDuration is not a native span field. It is calculated by subtracting the span's start time from its end time.
-
Click the Attributes checkbox to see more finegrained information directly in the Span Table.

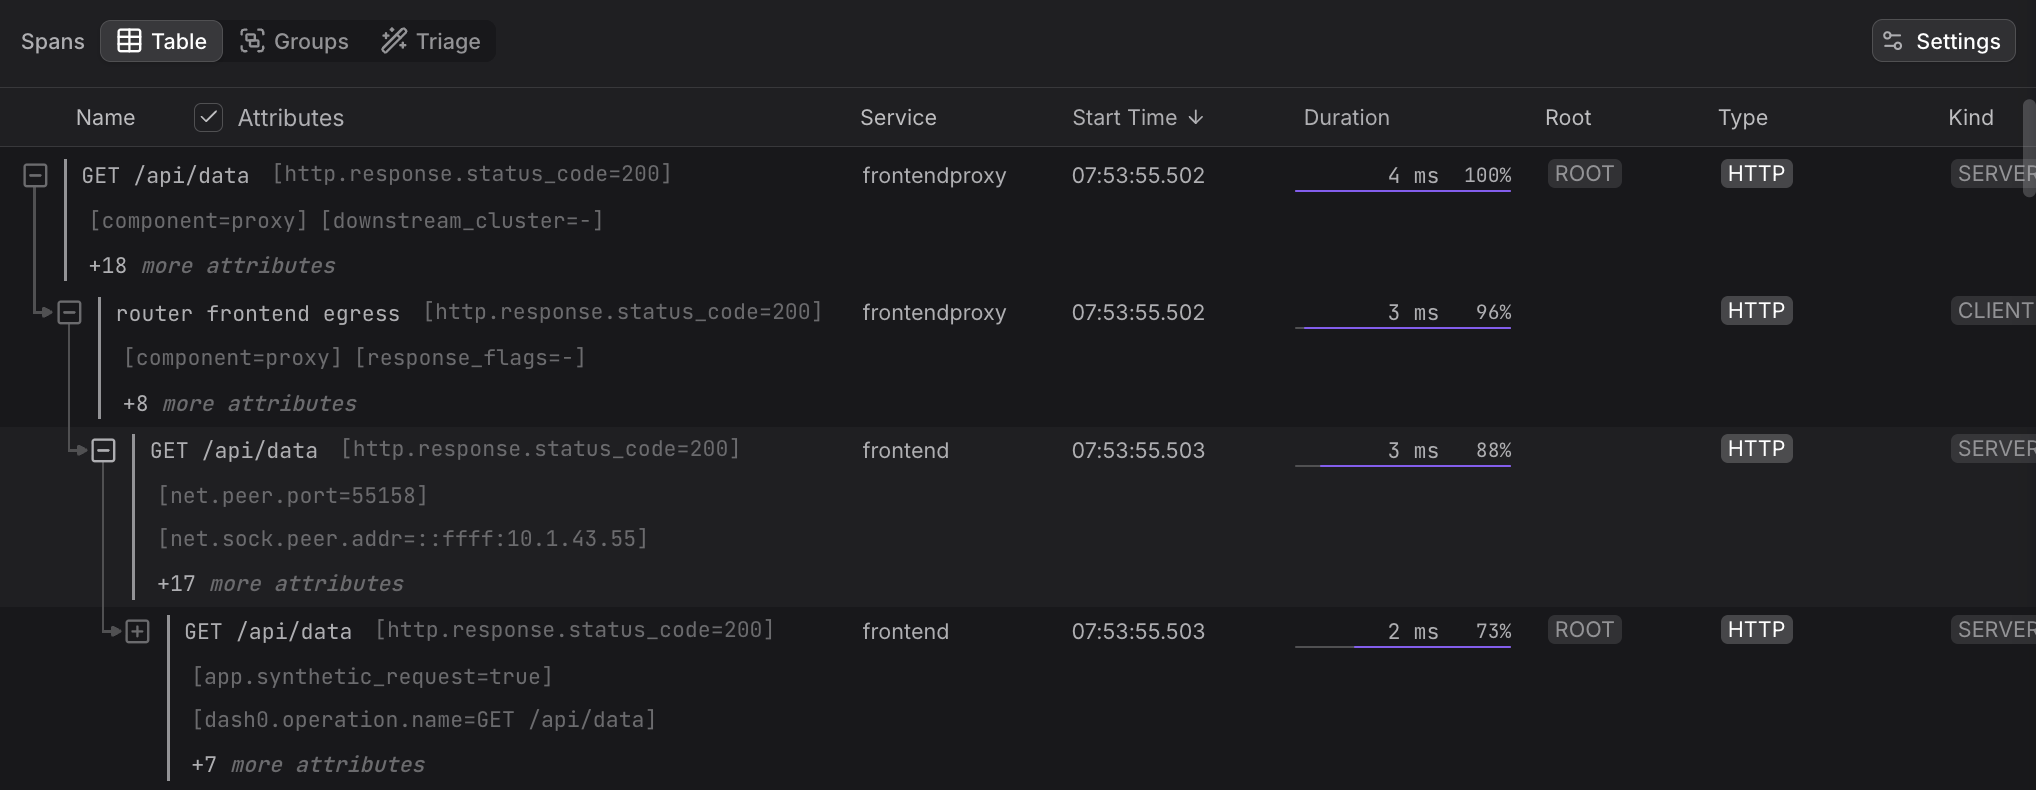
Configure Columns
You can add, remove, and reorder columns in the Span Table after clicking Settings at the end of the Span Table toolbar. These settings apply only to the table and are independent of other view settings.
For example, built-in columns, which are always available, include span name, service name, duration, status, and timestamp. All other columns — such as specific span or resource attributes — are custom and must be added via the Settings dialog.
Column configurations can be saved as named views in the Custom section of the Trace Views Explorer, when you click Save as in the top left, after reconfiguring the columns in the Settings dialog.
![]()
When you click Save as, you're prompted to provide details to uniquely identify your new view in the Trace Views Explorer.