Last updated: July 24, 2026
Inspect Span Details
Dash0 provides quick access to relevant information based on context. The Span Sidebar on the right-hand side opens automatically when a record in the Span Table or Trace View is selected.
It contains information distributed across several tabs. The Overview tab is active by default and contains the most relevant information for quick access and navigation.
Overview Tab
The Overview tab provides a high-level summary of the selected span, including:
-
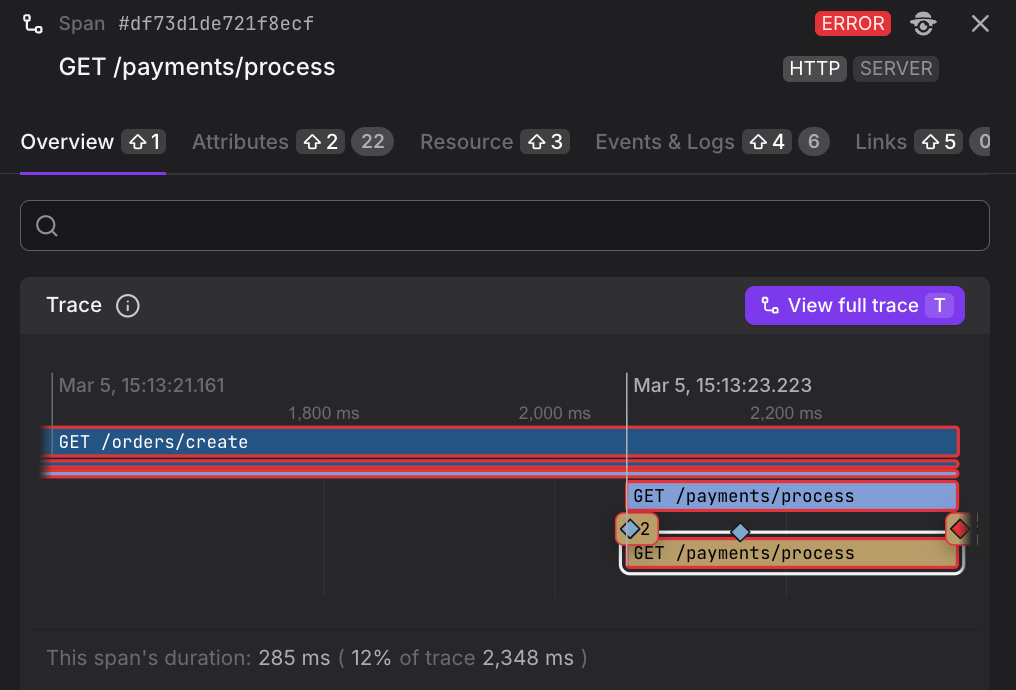
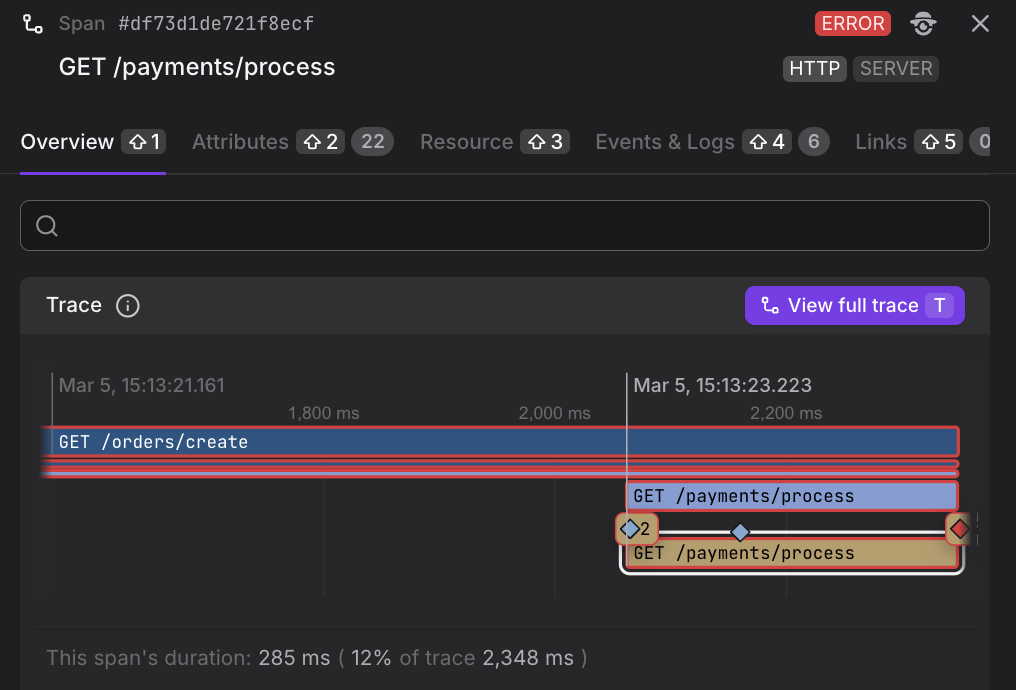
Trace visualization — A miniature waterfall view showing where the selected span fits within the full trace timeline. Click Visualize the full trace to open the complete trace in the Trace View.
-
Span Duration — The absolute duration of the span alongside a percentile distribution chart (median, p75, p90, p99), comparing it to spans with the same operation name over the selected time range. The Triage button is available to quickly investigate anomalies, via Triage.
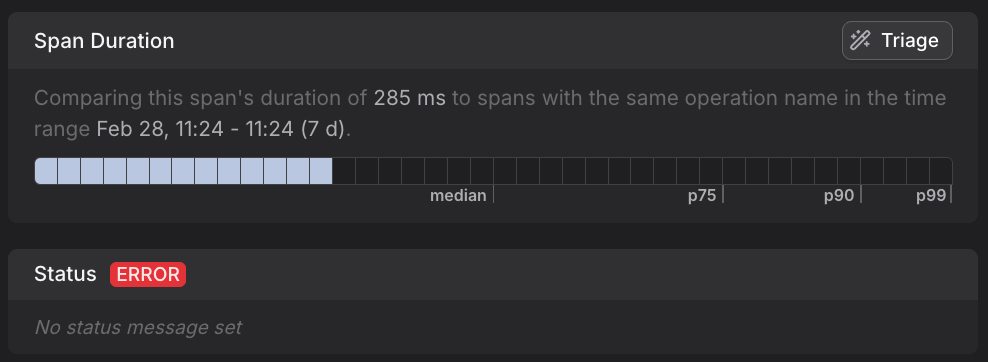

Percentiles describe the distribution of span durations across all matching spans in the selected time range. For example:
- p99 means 99% of spans completed faster than this value — making it a useful indicator of worst-case latency that real users may experience.
- Median (p50) reflects the typical case.
- p75 and p90 help you understand how performance degrades for slower requests.
Investigating a gap between the median and p99 is a good starting point for finding outliers or performance regressions.
-
Attributes — A filterable list of key-value pairs attached to the span. Tabs allow you to filter by attribute namespace (e.g.
http.*,dash0.*). Clicking the external link icon next to an attribute name opens a filtered view for that attribute across all spans.
-
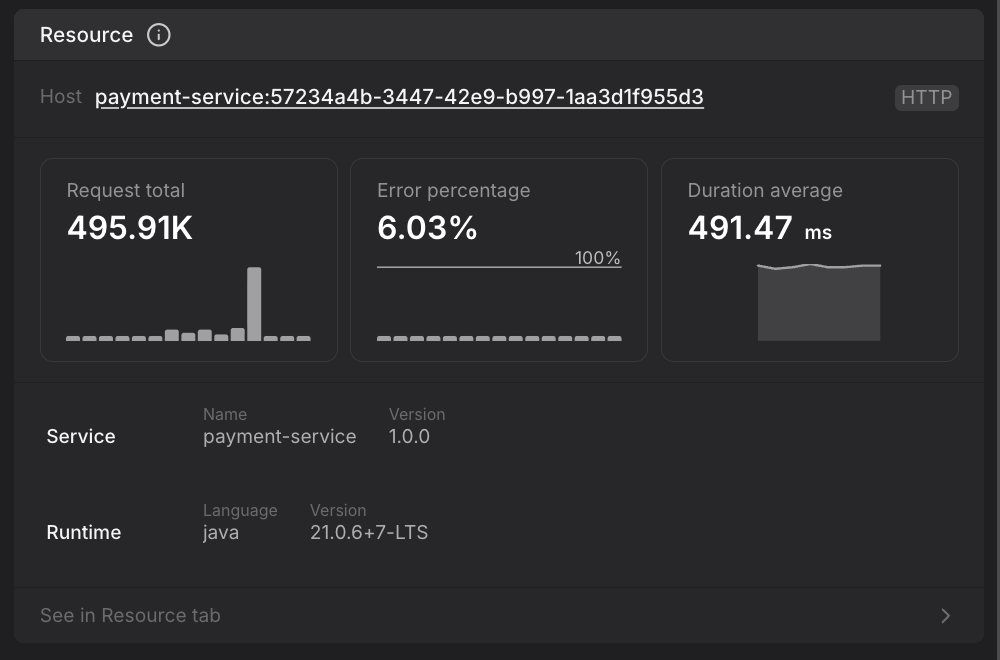
Resource summary — A condensed view of the resource that produced the span, including request volume, error percentage, and average duration sparklines. The service name, namespace, and runtime details (language and version) are shown here.

Not all resource attributes on your spans, logs, and metrics come from your application — Dash0 automatically enriches telemetry at ingestion time using resource equality rules. This is central to how Dash0 works: every signal type — traces, logs, metrics, services, and web events — shares the same resource model and the same filtering and view mechanics. Understanding how resources are coalesced gives you a unified mental model across the entire platform. To get the most out of resource equality, ensure that you have consistent attribute usage across all your telemetry sources so that Dash0 can merge them into a single coalesced resource.
Attributes Tab
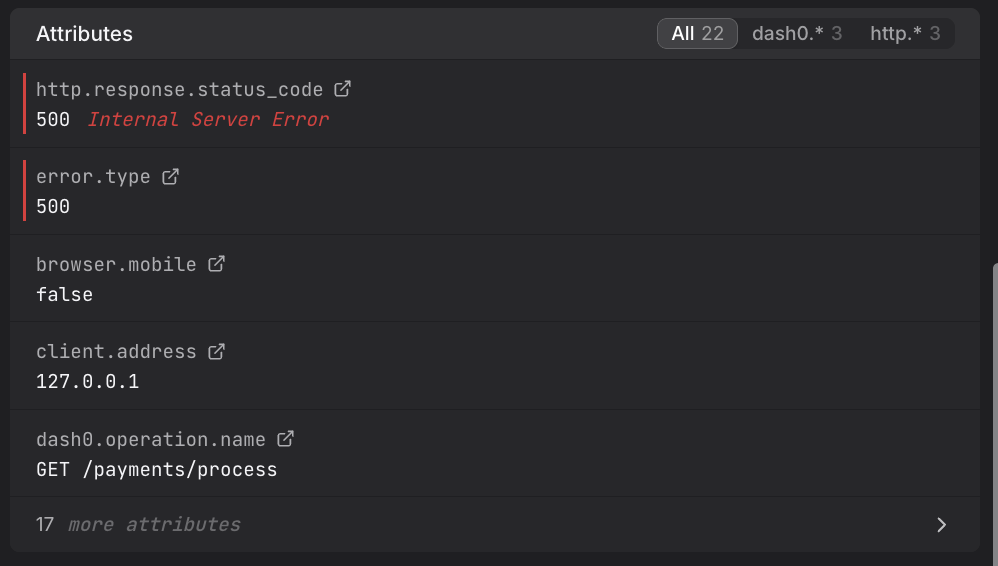
The Attributes tab lists all key-value pairs attached to the span. Each entry shows the attribute name and its value. The tab header displays the total attribute count as a badge.
Attributes are grouped by namespace. You can use the filter buttons at the top to narrow the list to specific namespaces such as http.*, dash0.*, or process.*. A search box is also available to find attributes by name.
Common attributes include:
http.response.status_code— The HTTP status code returned by the operation (e.g.200 OK). Per OpenTelemetry semantic conventions,5xxresponses always indicate a span error, but4xxresponses are only errors on the client side.server.address— The hostname or IP address of the server being called. This is commonly populated by instrumentation for outbound HTTP and RPC calls.rpc.grpc.status_code,rpc.method,rpc.service,rpc.system— For gRPC spans, these describe the remote procedure call details. See the OpenTelemetry RPC semantic conventions.server.address,server.port— The hostname and port of the downstream service (for client-side spans).client.address,client.port— The hostname and port of the upstream client (for server-side spans).net.peer.name,net.peer.port— (Deprecated) Legacy attributes for network peer information. Modern instrumentation usesserver.*orclient.*depending on span kind.dash0.span.type,dash0.operation.name,dash0.operation.type— Dash0-specific metadata describing the span classification.app.*— Application-level attributes such asapp.order.idfor business context.
Resource Tab
The Resource tab shows the full set of attributes describing the entity that produced the span. This includes host, process, and SDK metadata.
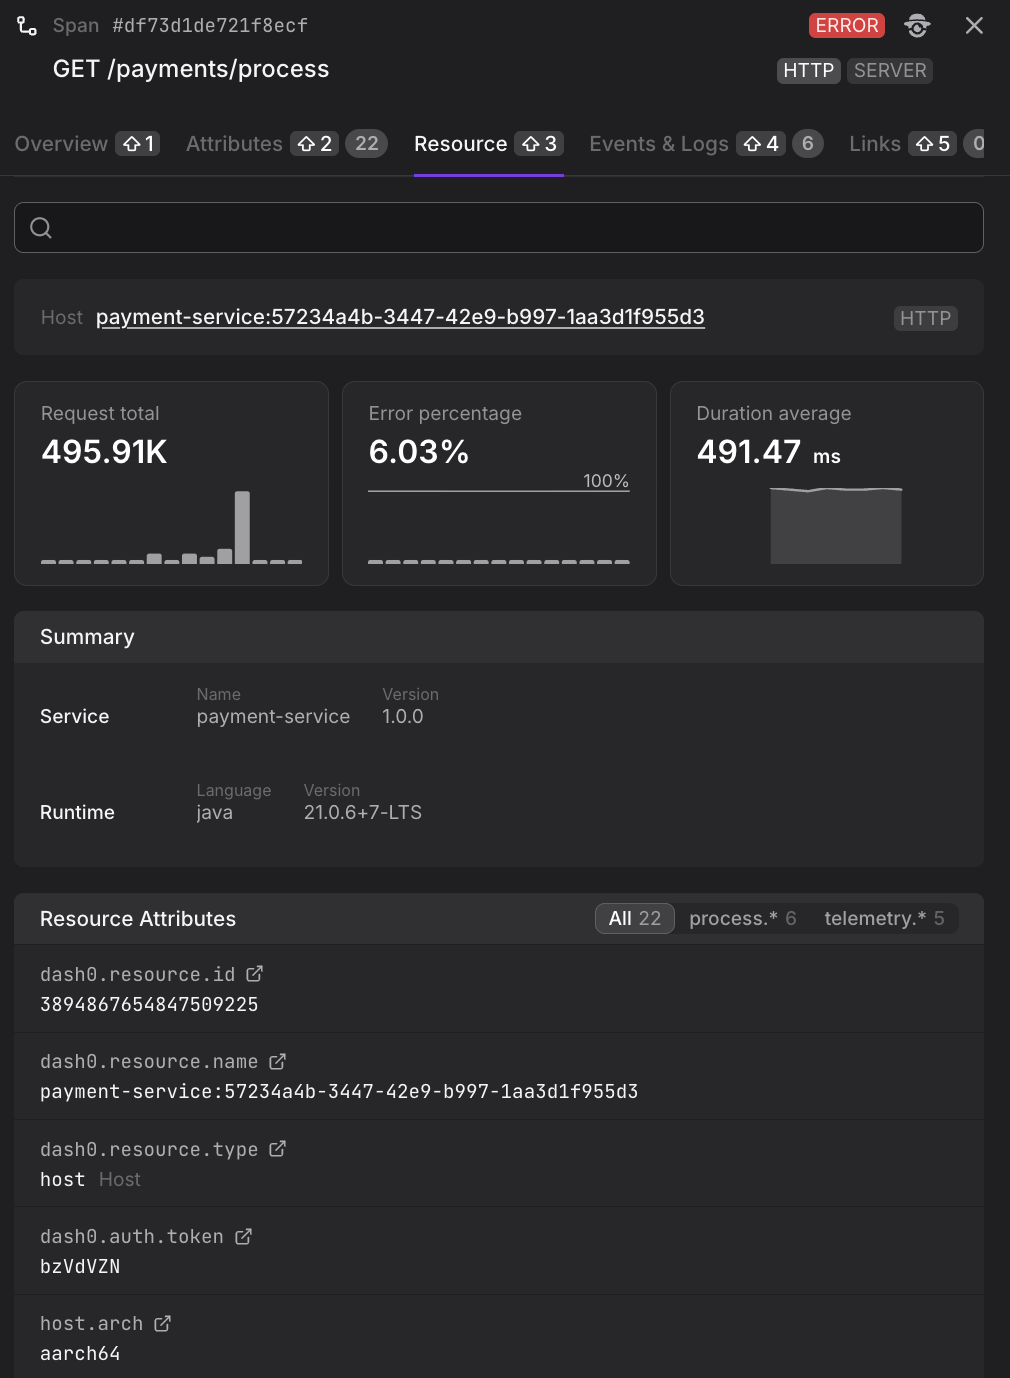
Not all resource attributes originate from your instrumentation. Dash0 enriches incoming spans with additional resource metadata at ingestion time — for example, infrastructure-level attributes derived from the environment in which your service is running.
Resource attributes are grouped and filterable by namespace (e.g. process.*, dash0.*). Common entries include:
- Service —
service.nameandservice.namespaceidentify the instrumented service (e.g.frontendin theopentelemetry-demonamespace). - Runtime —
process.runtime.nameandprocess.runtime.versionindicate the execution environment (e.g.nodejs 18.20.8). - Host —
host.name,host.arch,os.type, andos.versiondescribe the underlying host. - Process —
process.command,process.executable.path,process.pid, andprocess.ownerdescribe the running process. - SDK —
telemetry.sdk.name,telemetry.sdk.language, andtelemetry.sdk.versionidentify the OpenTelemetry SDK used for instrumentation. - Dash0 resource metadata —
dash0.resource.id,dash0.resource.name,dash0.resource.type, anddash0.auth.tokenare added by Dash0 for resource tracking.
A summary card at the top of the tab shows the host name, request total, error percentage, and average duration for the resource over the selected time window.
Related Logs & Events Tab
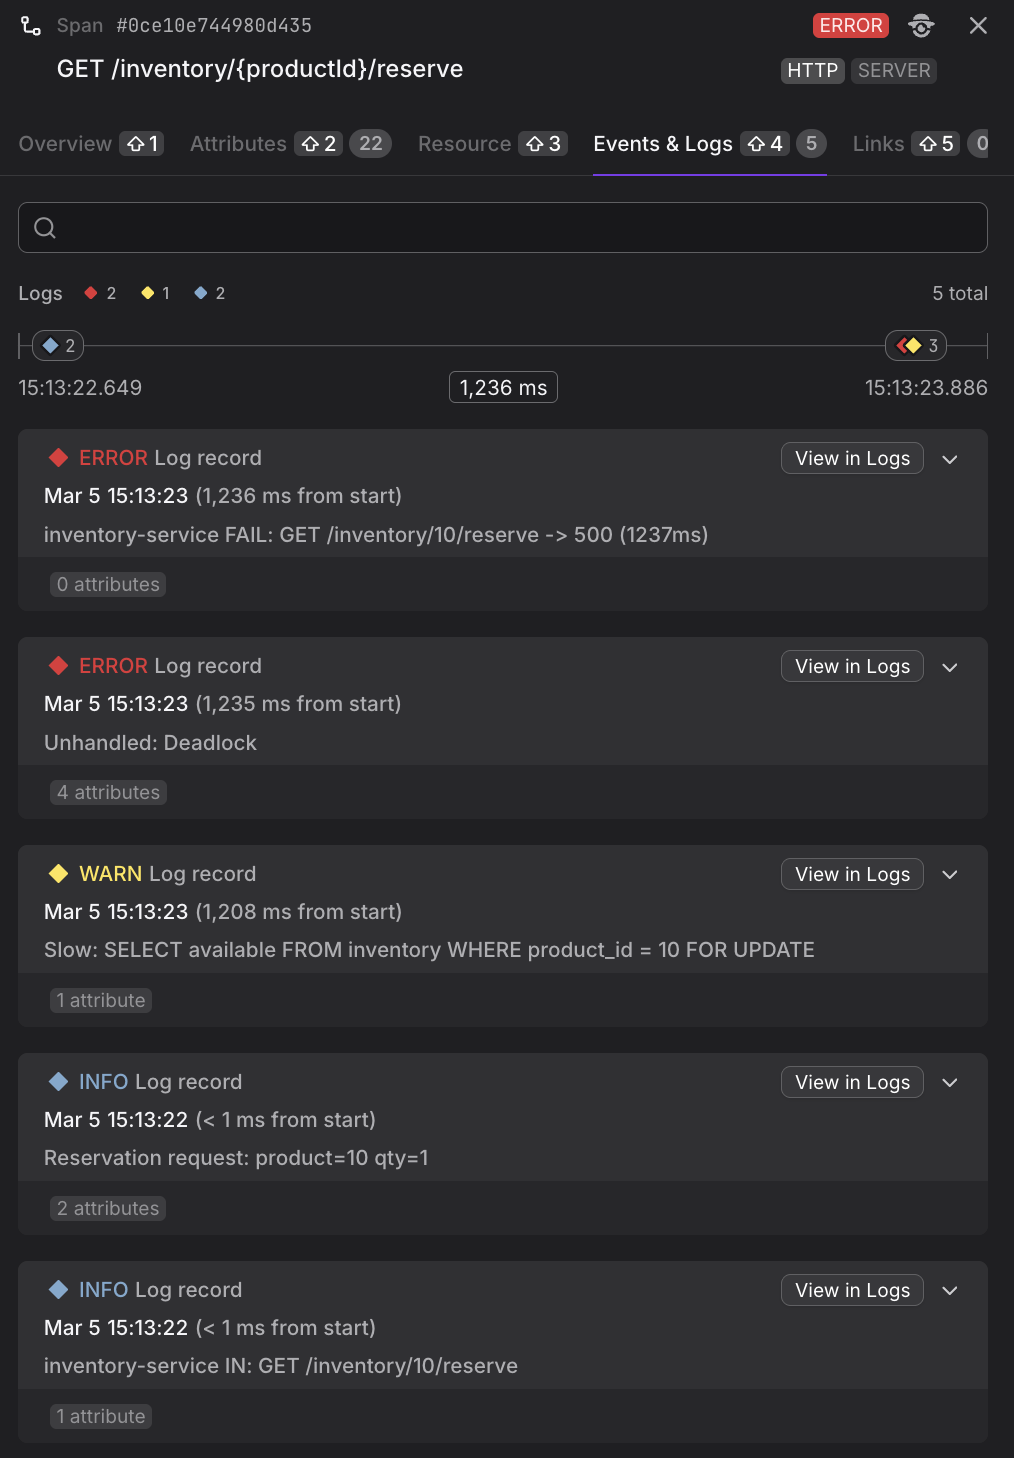
The Related Logs & Events tab shows log records and span events correlated with the selected span, interleaved in a single time-ordered list. A mini-timeline at the top of the tab visualises the span itself and any items attached directly to it, and inline "This span started" / "This span ended" markers appear within the list so you can see exactly when the span's lifetime overlaps the surrounding stream.
Correlation modes
Use the Show related logs by dropdown to change which items appear in the list:
- Trace (default) — every log record and span event in the same distributed trace as the selected span. Best for reconstructing an end-to-end request.
- Resource — everything on the same resource within ±30 minutes of the span. Useful when the interesting logs live outside the span's own trace context (background jobs, scheduled tasks).
- Resource & Trace — the union of the two above.
- Span — only the log records and span events directly attached to this span.
Navigating the list
- The mini-timeline's duration pill is clickable: it snaps the list back to the "This span started" marker at any time. If you have paginated far enough that the marker is no longer in the cached window, the click also re-fetches around the span.
- Load more buttons appear at both ends of the list whenever there are more records to fetch in that direction. The cached window is bounded, so scrolling in one direction eventually prunes the far side; clicking Load more on the pruned side re-fetches it on demand.
- Clicking a span event in the Trace View waterfall or trace tree scrolls the list to that event and briefly highlights the row, so you can navigate from a span's timeline into the surrounding logs without losing your place.
- The View in Logging button in the tab header opens the Logs Explorer with the same filter and time range applied, so you can dive deeper into the log stream when needed.
Links Tab
The Links tab lists span links — references to other spans that are causally or contextually related but not part of the same parent-child trace hierarchy.
Span links are an OpenTelemetry concept used to connect spans across separate traces; see the OpenTelemetry specification for details.
Each link shows the linked span's operation name and its role (e.g., SERVER). Links have zero or more custom attributes attached, which are shown beneath each entry.
This is useful when a span was triggered by or is related to a span in a separate trace, such as when a background job is initiated from a web request.
Source Tab
For any span, the raw OpenTelemetry payload can be viewed in YAML or JSON format directly within the sidebar.
The Source tab shows the full resourceSpans structure as sent to Dash0, including all scope spans, their attributes, and dropped attribute counts.