Last updated: July 24, 2026
Analyze Spans with Triage
Triage performs automated comparative analysis to surface attributes that differentiate erroneous or slow spans from a baseline.
Analyze All Spans
Triage lets you compare two groups of spans within specified timeframes.
-
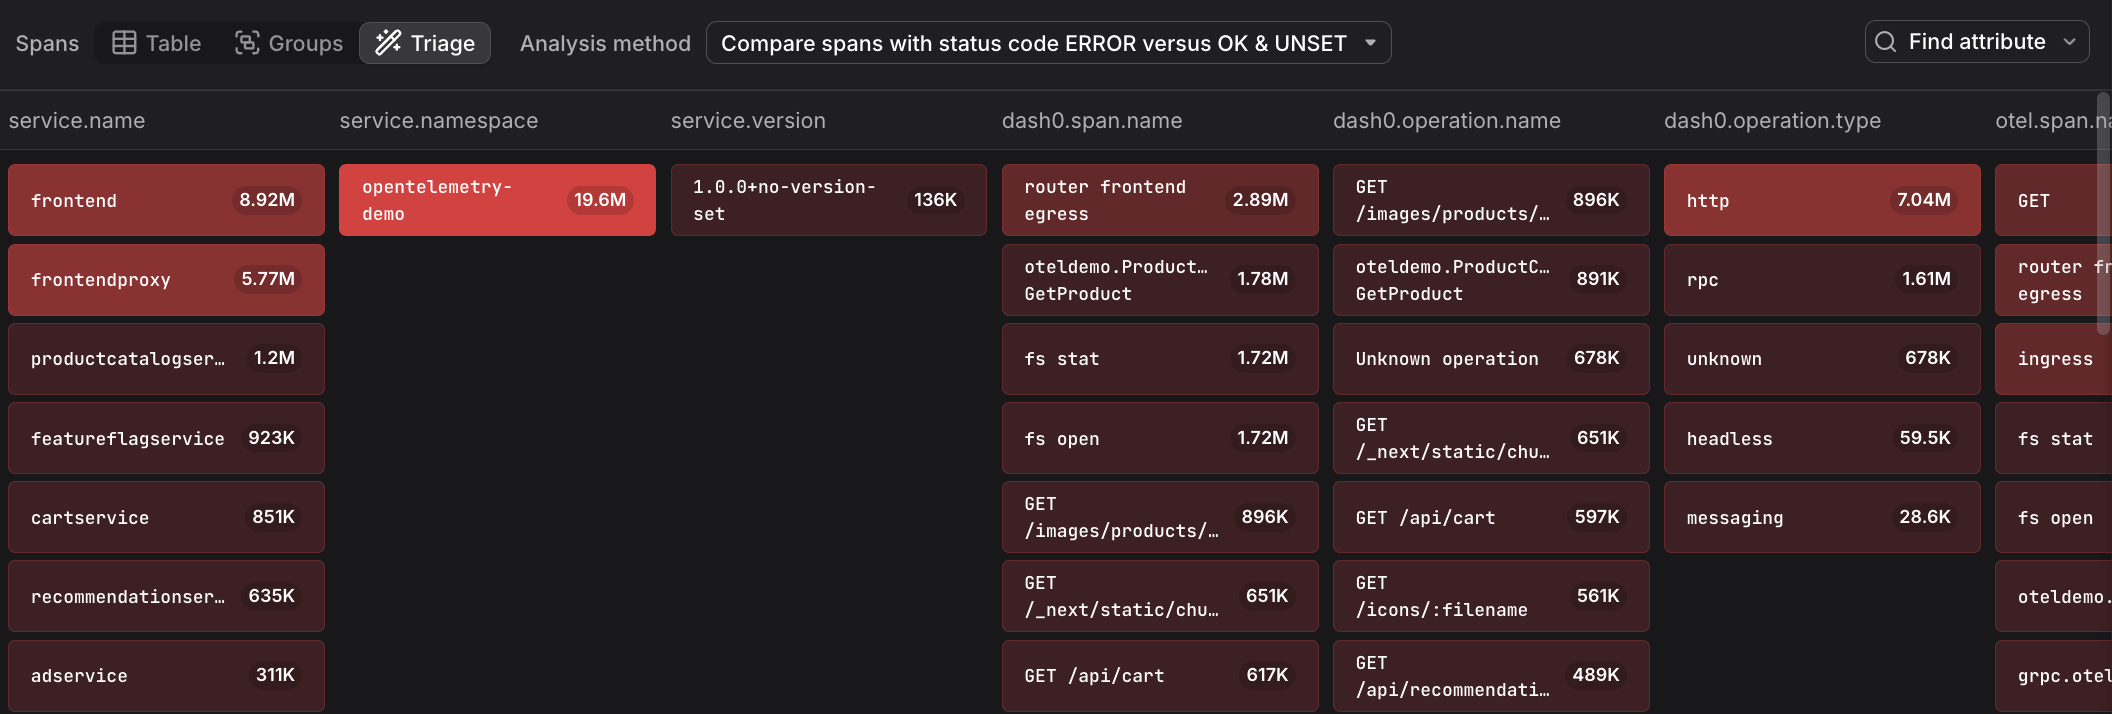
Status code ERROR versus OK & UNSET. Use Triage to analyze spans with status code
ERRORas the analysis group against spans without errors as the control group — excluding the status code attribute itself from results, since it would trivially explain the difference.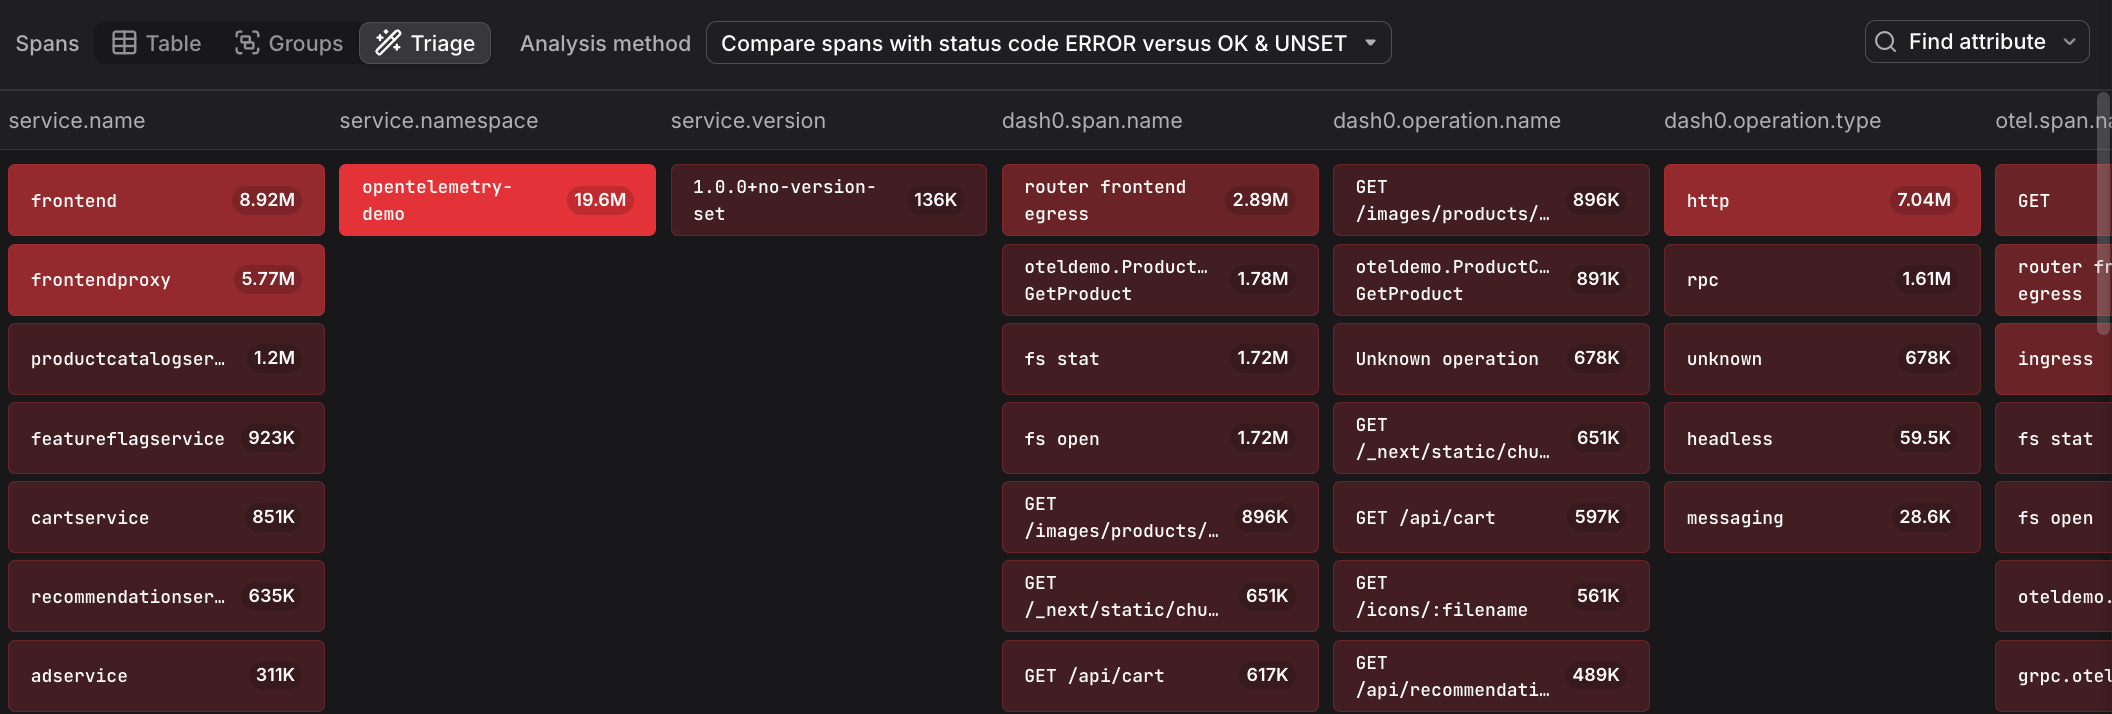
When launched from error mode, Triage automatically scopes to erroneous spans within your selection You can add further criteria to narrow the analysis — for example, restricting to spans from a specific service or operation.
-
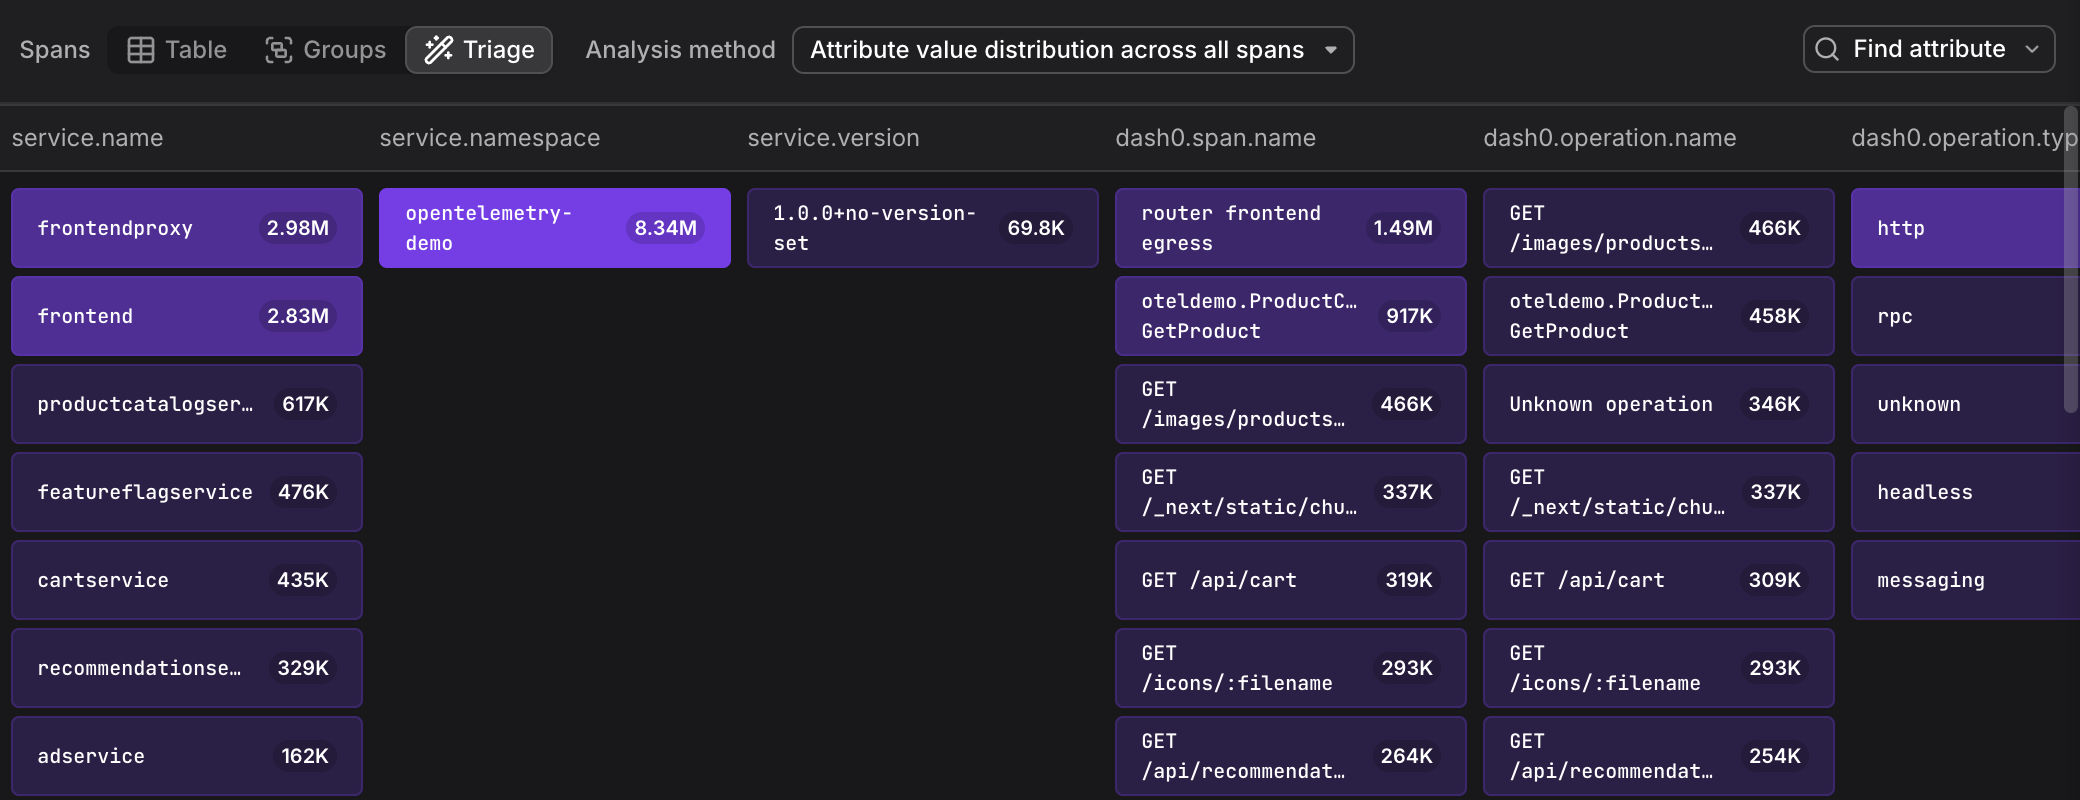
Attribute values. With Triage, you can identify attribute values that are disproportionately concentrated in one group vs. the other. Results are shown as a distribution: the brighter a value, the higher its concentration in the analysis group.

Compare Selections
Triage supports three different time ranges.
-
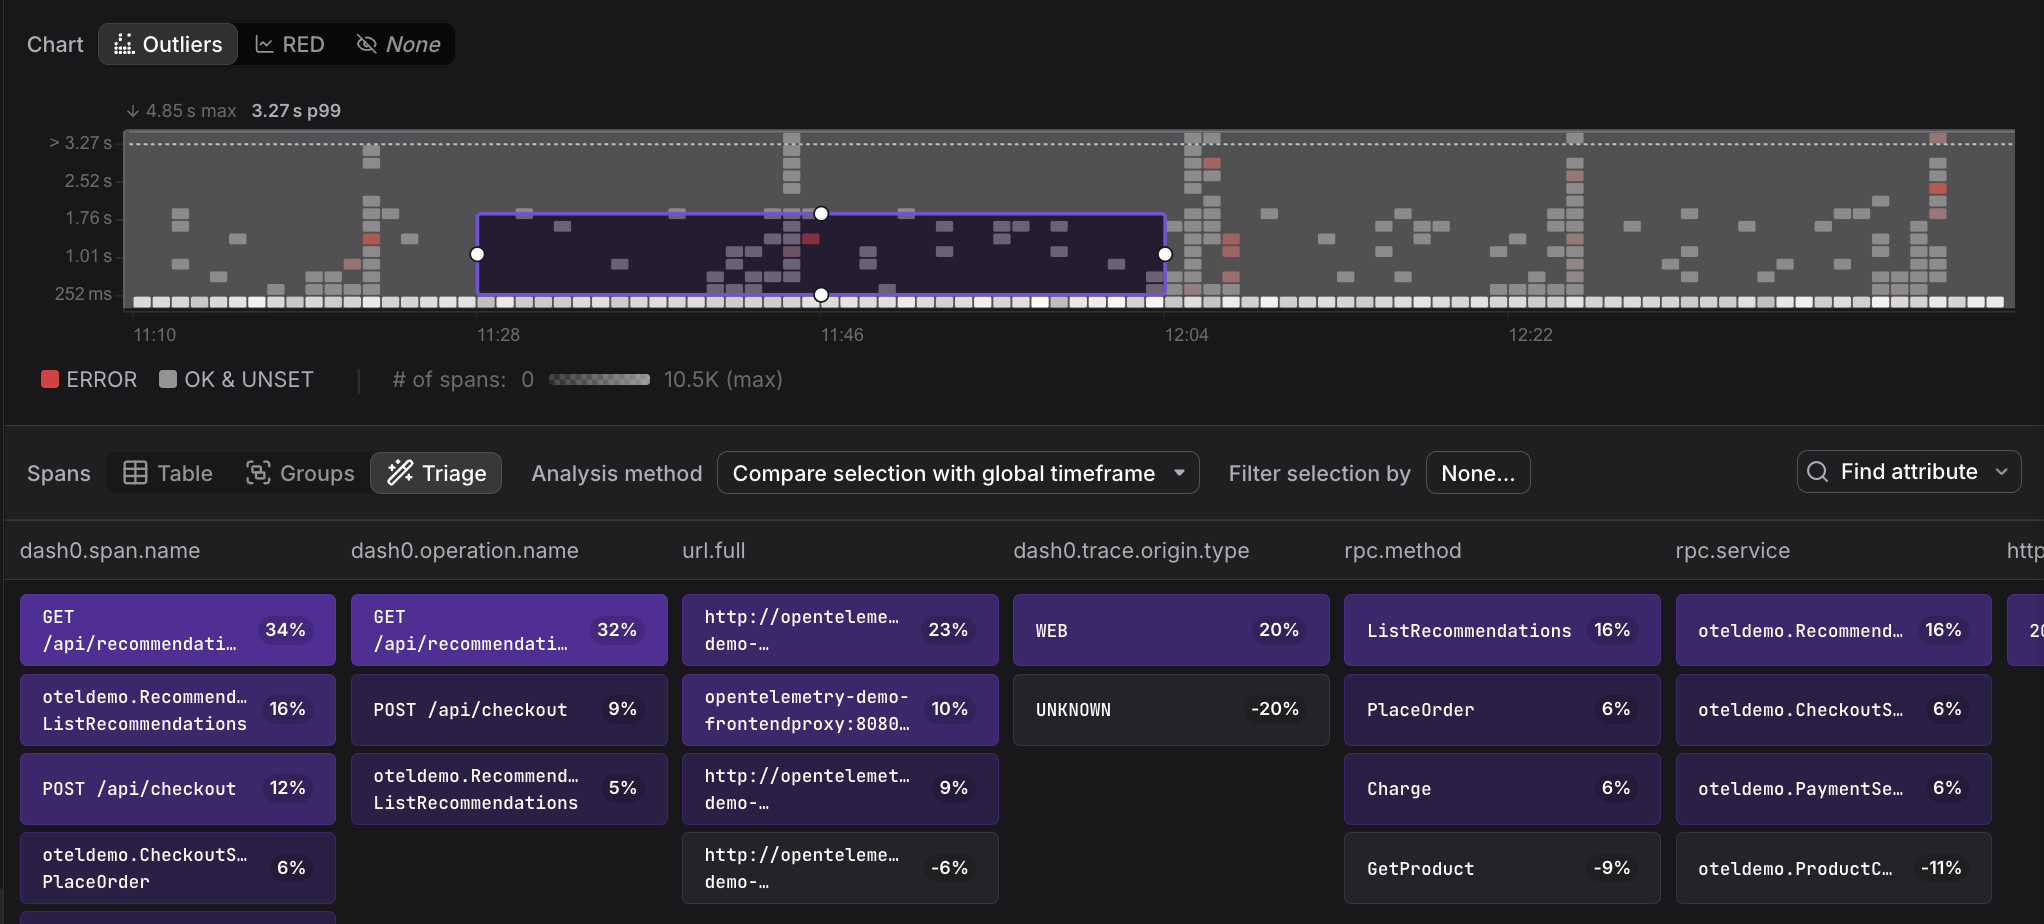
with global timeframe: compares spans in the selected region across the full visible time range
 Tip
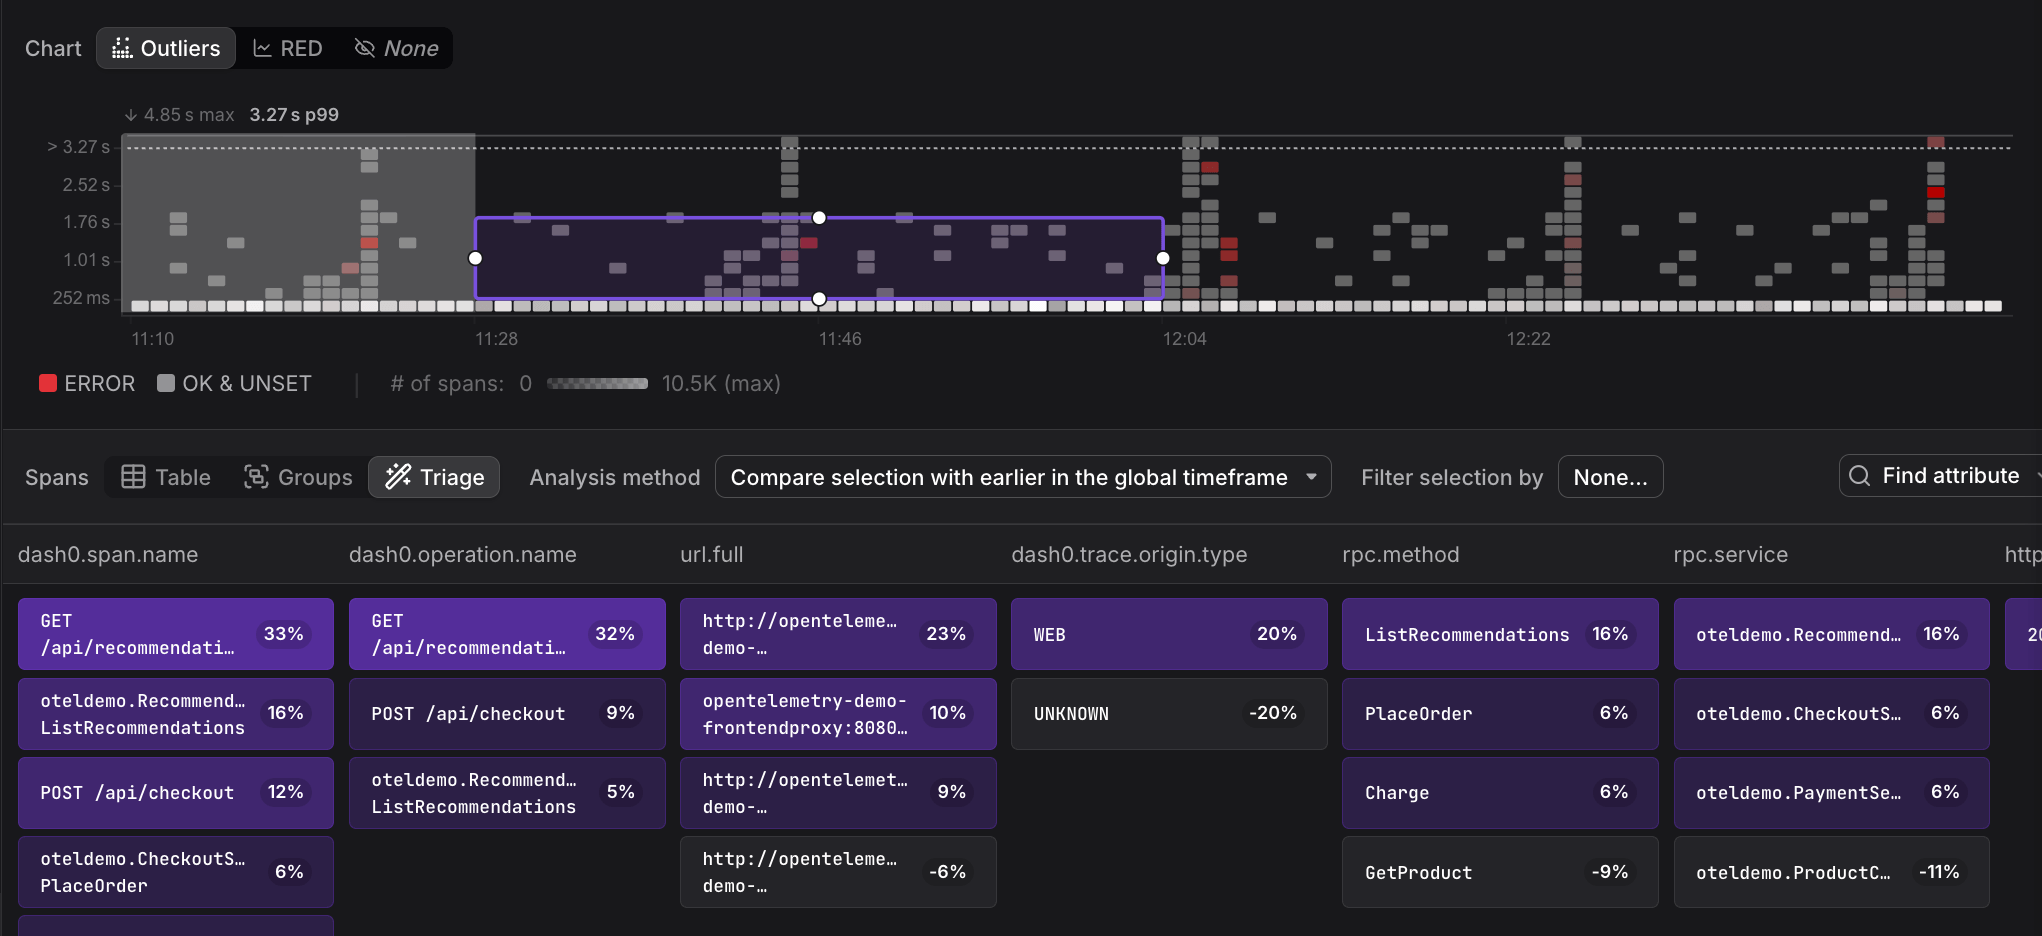
TipUse this to find what makes a region stand out from typical activity. For example: select a cluster of red spans in the Outliers Map and compare against the baseline to find which attributes — such as a specific customer ID, endpoint, or database instance — are concentrated in the failing spans. It also works well for latency: select high-duration spans and compare them against the rest to surface common factors like a slow downstream service or an unusual query pattern.
-
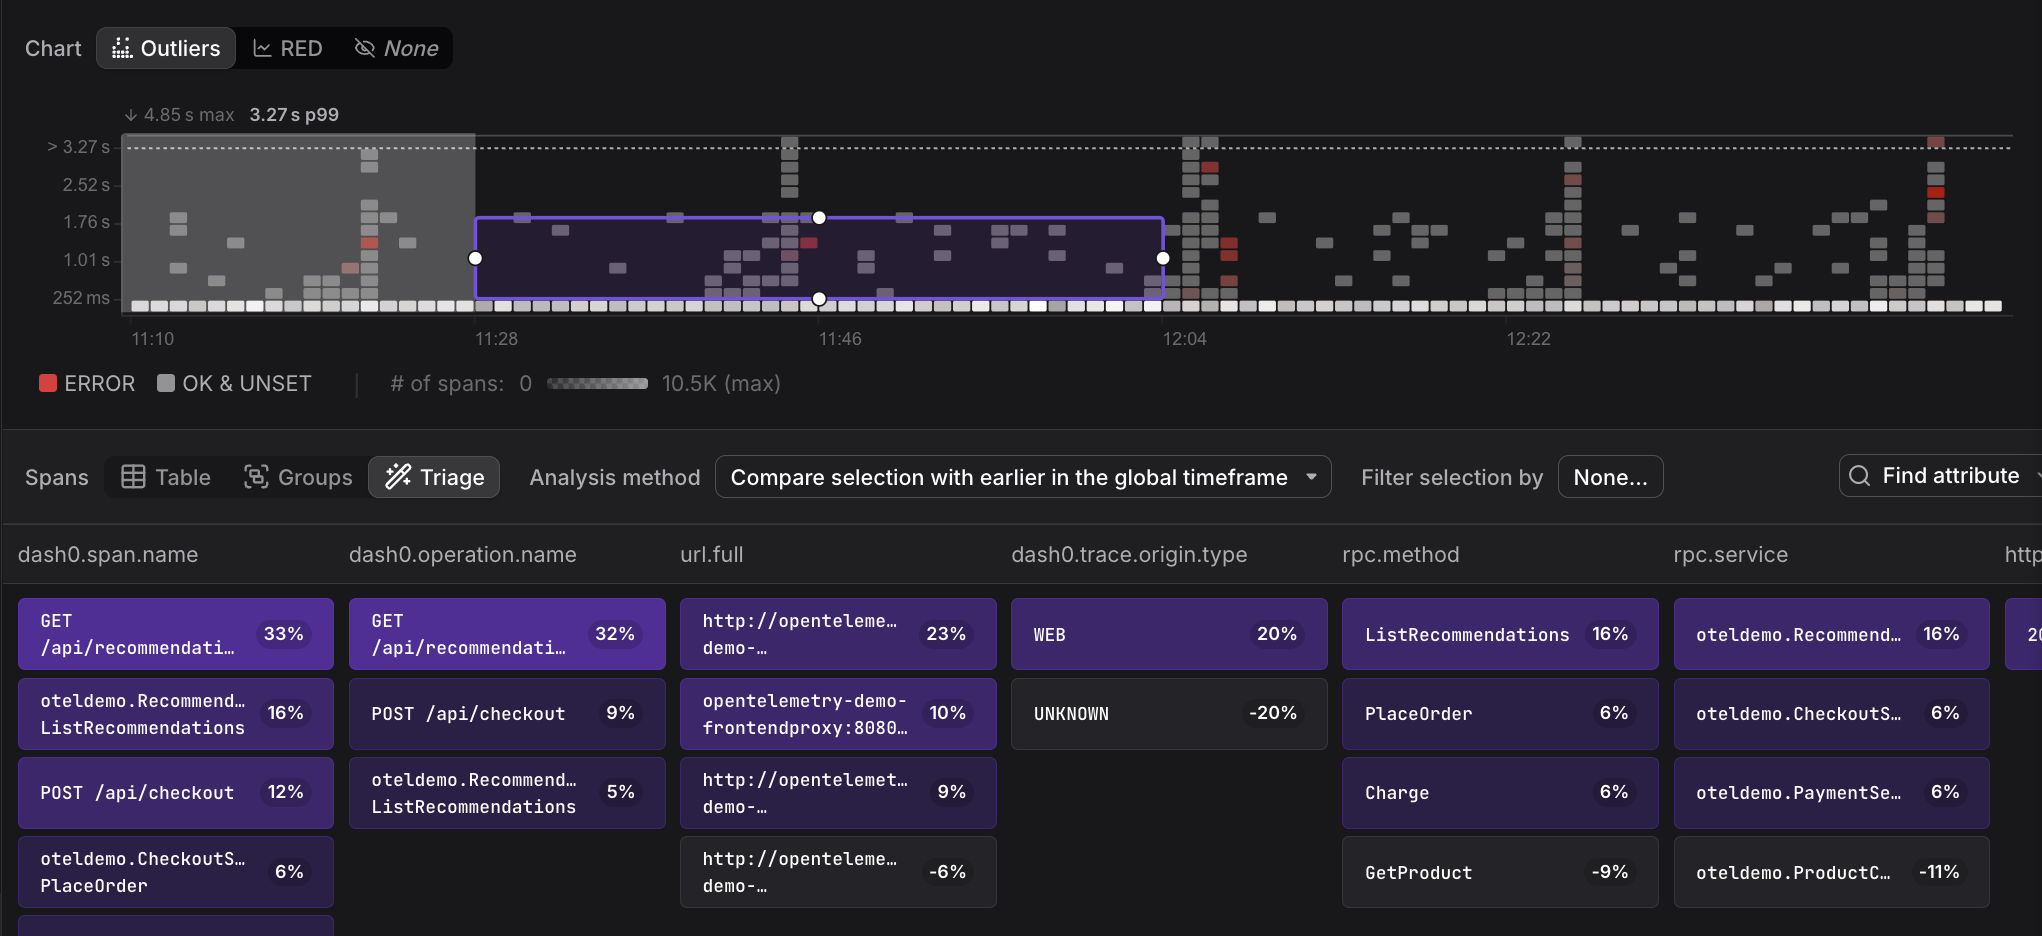
with earlier in the global timeframe: compares spans in the selected region against the time period immediately before it
 Tip
TipUse this to investigate what changed at a specific point in time. For example: select a window where error rate spiked and compare it against the period just before to find attributes that shifted — such as a new
deployment.versionvalue, a change inhttp.routedistribution, or a host that started appearing after a rollout. This is also useful for catching gradual degradation: compare the tail end of a time range against its start to see what drifted. -
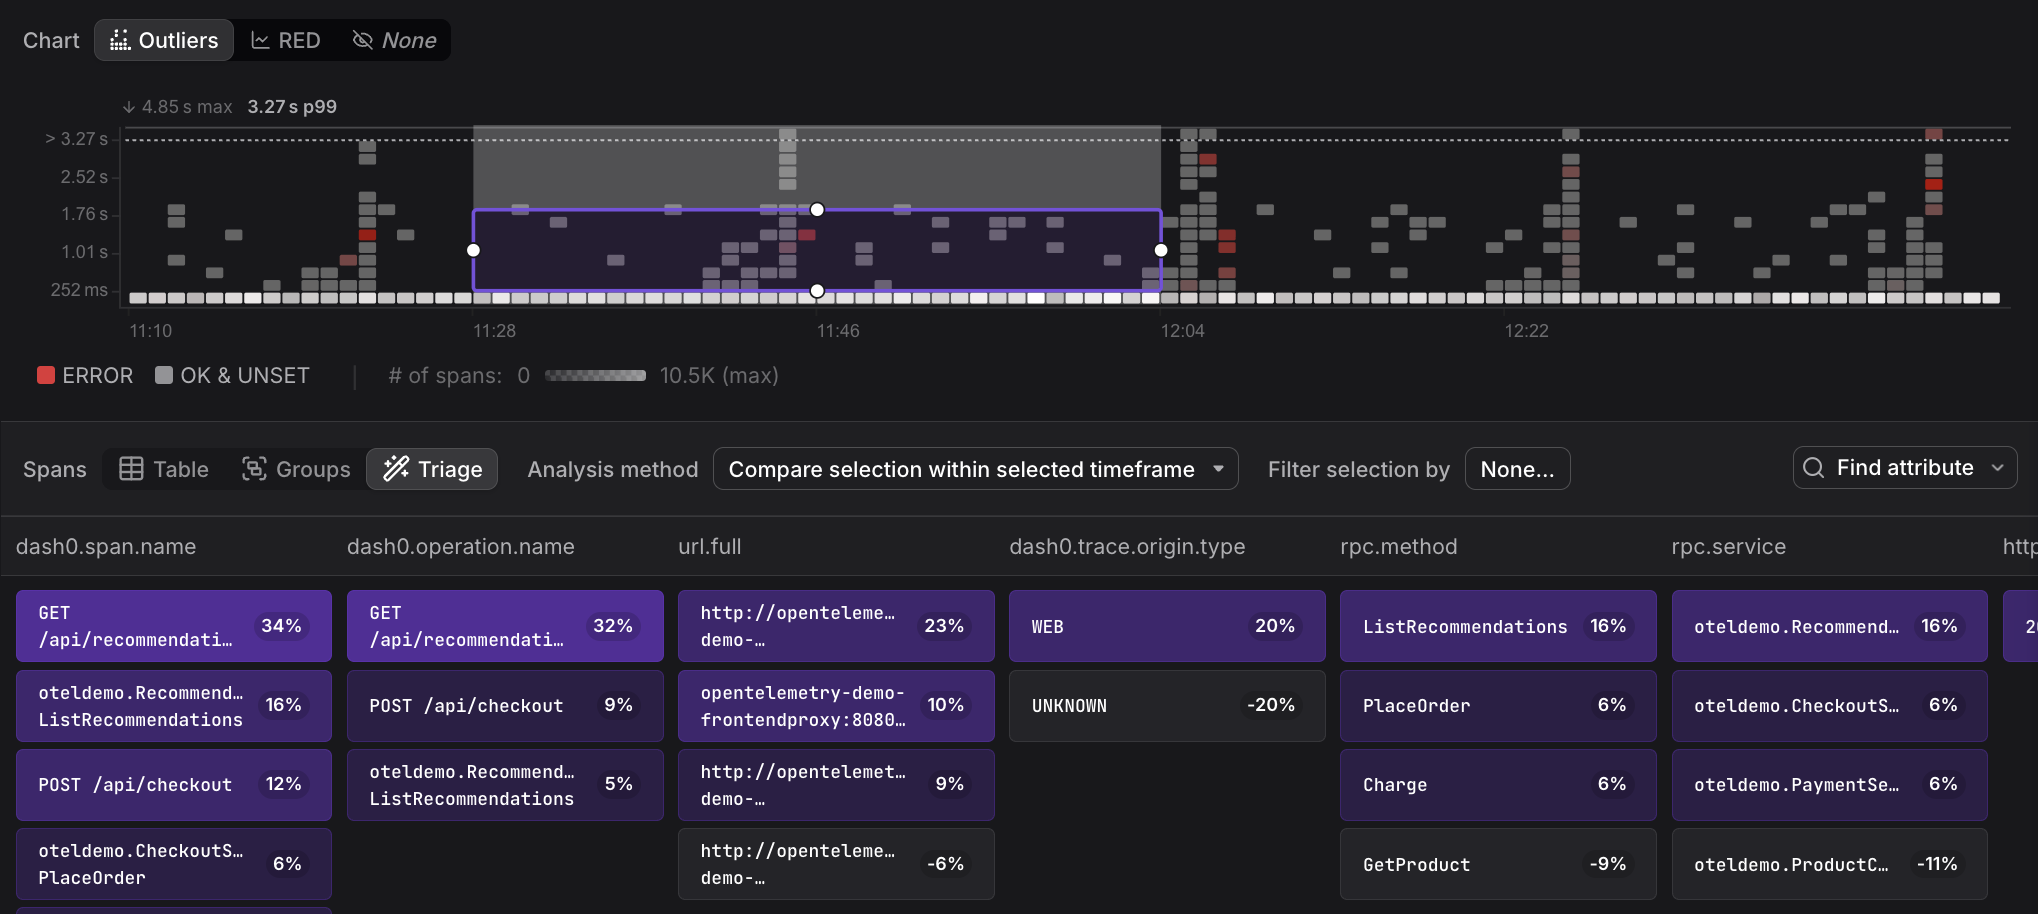
within selected timeframe: compares spans in the selected region against everything above and below it — useful for isolating what makes a specific window of activity different
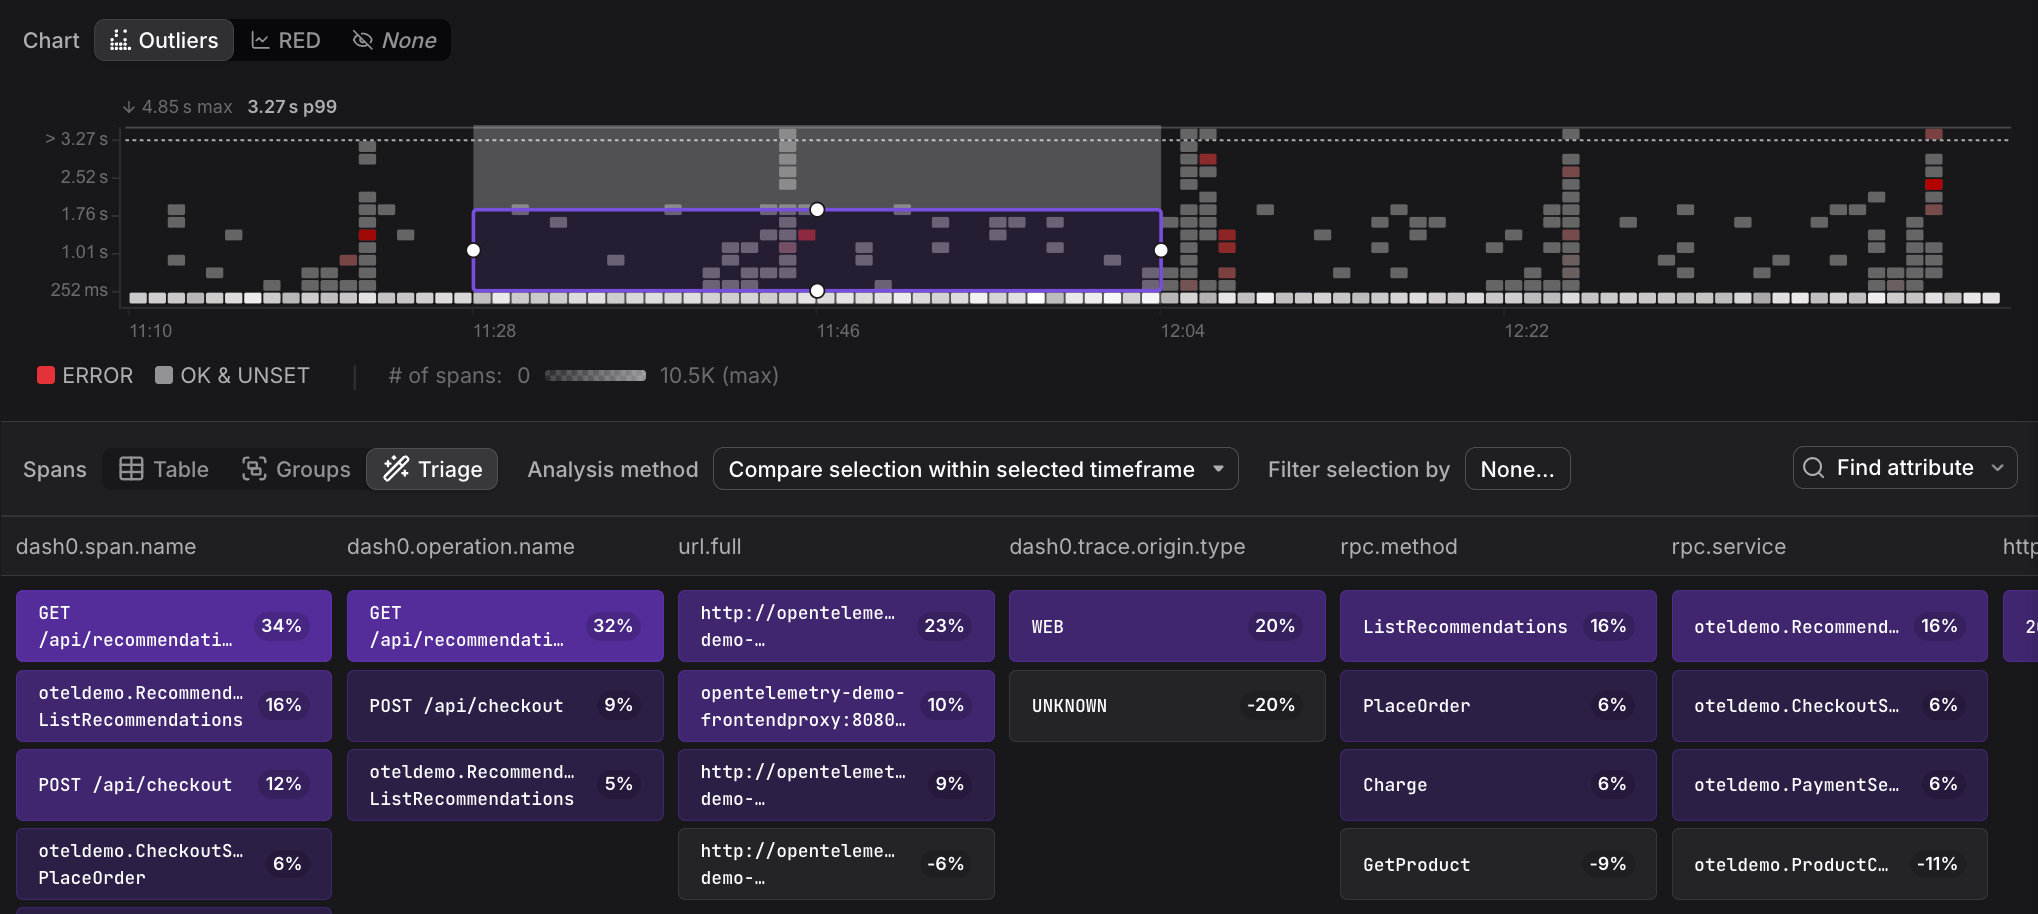 Tip
TipUse this to isolate the characteristics of a specific burst or anomaly within an otherwise continuous trace view. For example: select a narrow window of elevated activity during an otherwise quiet period to find which service, operation, or caller drove the spike. It's also useful for scheduled jobs or batch processes — select the window when the job ran to surface the attributes that distinguish its spans from ambient traffic.
Troubleshooting
Triage requires both an analysis group and a control group. If you navigate to Triage with a filter already applied that scopes all visible spans to errors — for example, by filtering to status = ERROR — there are no remaining spans to serve as a control group, and Triage will show no results.
In this situation, the Remove filter button appears.
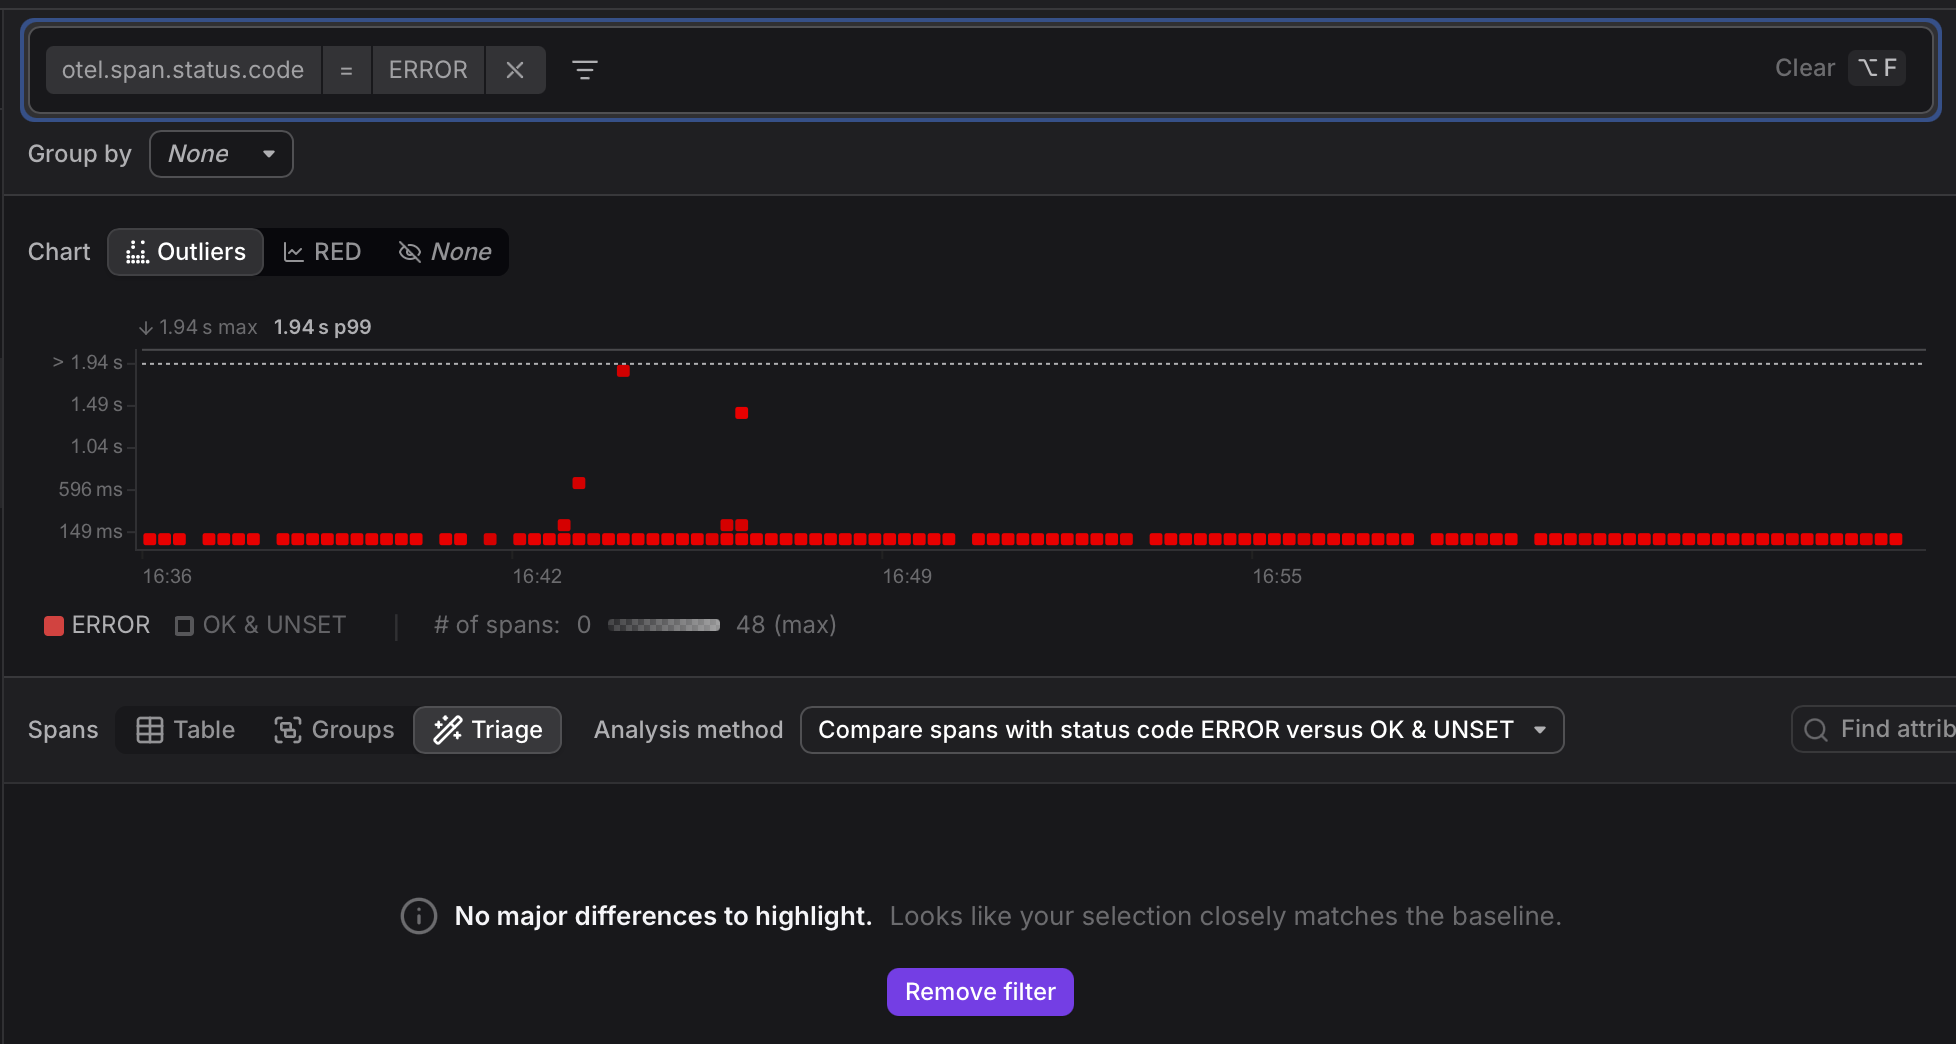
Clicking Remove filter removes the status code filter, restoring a baseline population so that Triage can perform its comparison. The error spans remain the analysis group; the non-error spans become the control group.
When you open Triage from a region selection in the Outliers Map, the error group is automatically set as the analysis group. You do not need to configure this manually.