Last updated: July 24, 2026
Analyze Spans in Groups
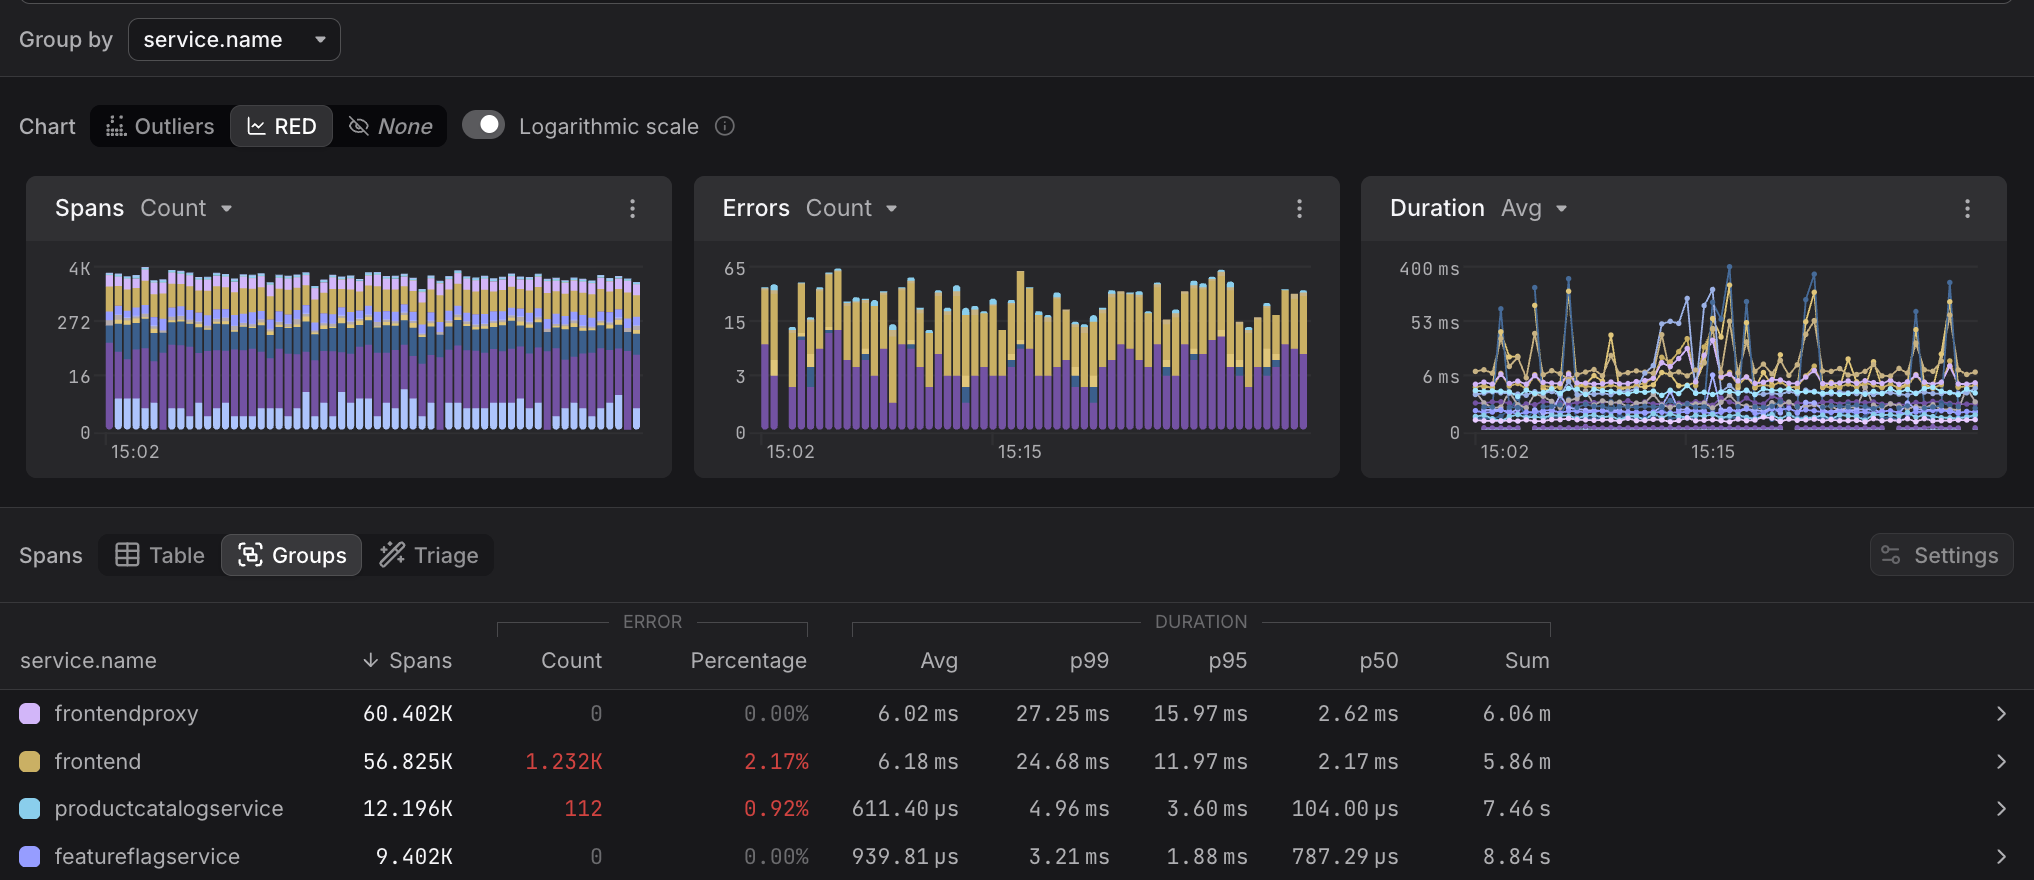
Use the Groups tab to aggregate spans by a selected attribute, so that you can see per-group RED metrics in a sortable table, making it easy to compare throughput, error rates, and latency across services or other dimensions at a glance.
Getting Started
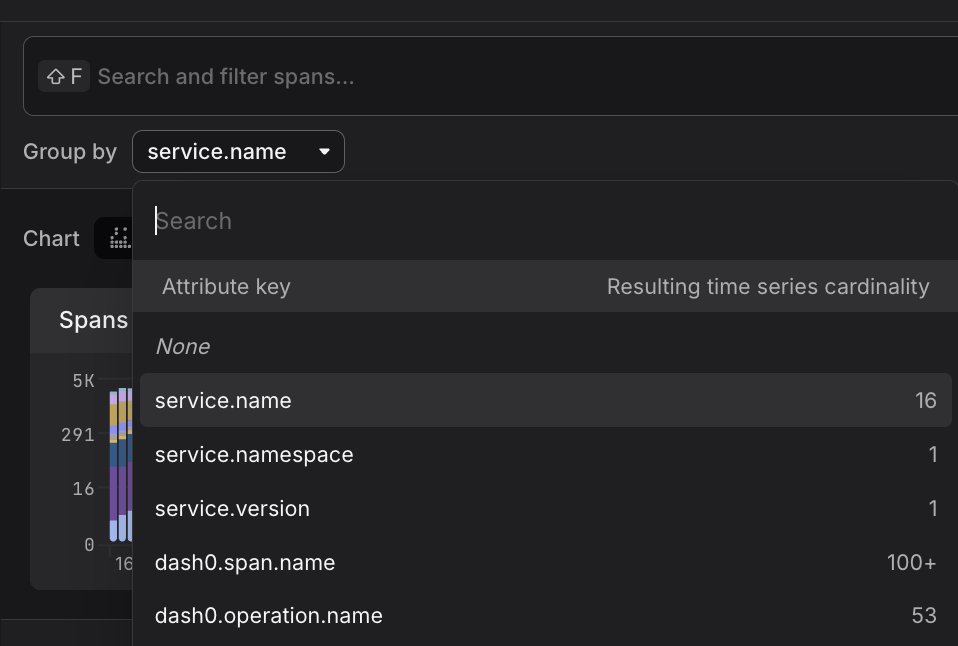
By default, the Groups uses service.name as the grouping attribute.
You can change this via the Group by control at the top of the Trace Explorer to aggregate by any attribute present in your spans — for example, http.request.method, deployment.environment, or a custom attribute.
Reading the Table
Each row represents one value of the grouping attribute.
The following columns are shown:
- Spans — total number of spans in the group within the selected time range; the default sort column
- ERROR
- Count — number of spans with status code
ERROR - Percentage — share of spans in the group that errored, highlighted in red when non-zero
- Count — number of spans with status code
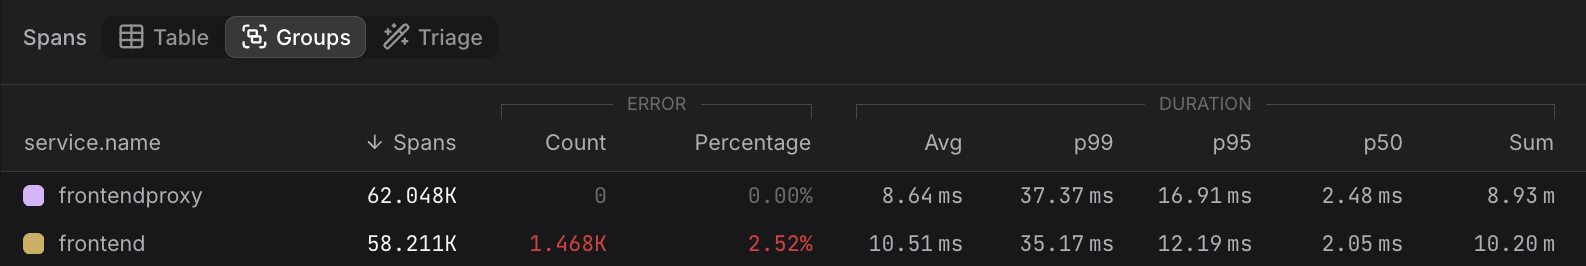
- DURATION
- Avg — mean span duration
- p99, p95, p50 — duration percentiles, useful for understanding tail latency
- Sum — total cumulative duration across all spans in the group
Duration percentiles describe the spread of span latency across the group.
- p50 is the median — half of spans completed faster than this value.
- p95 means 95% of spans completed within this duration.
- p99 captures the slowest 1% of spans, making it the best indicator of tail latency that users may occasionally experience.
A large gap between p50 and p99 suggests high variability — most requests are fast, but a significant outlier population exists.
Drilling Into a Group
Clicking the > arrow at the end of any row navigates into that group within the Span Table, scoping all views — including the RED metrics charts and the span list — to spans matching that attribute value.
Apply Groups to Common Problems
- Which service is generating the most errors? Sort by ERROR / Percentage to immediately rank services by error rate
- Which service has the worst tail latency? Sort by DURATION / p99 to surface outliers that may be degrading end-user experience
- Which service handles the most traffic? Sort by Spans to understand the relative load across services