Last updated: June 22, 2026
View the Full Trace
The full trace view shows the complete backend execution path for a frontend HTTP request, including all downstream service calls, database queries, and performance bottlenecks.
When you click View full trace from the Trace Context section in the event detail sidebar, Dash0 opens the Trace Explorer, focused on the backend trace for that specific request. This provides end-to-end visibility from frontend event to backend execution.
Notice the "← Websites" back button at the top left (or press T). This visual indicator shows you're viewing a trace that originated from the Website Monitoring world, and provides a quick way to return to the originating session context.
This guide shows how to view traces when accessed from website monitoring. For general information about the Trace Explorer and its capabilities, see About Tracing and Visualize the Full Trace.
For details on how frontend requests are linked to backend traces, see Correlate Sessions with Backend Traces.
What the Full Trace View Shows
The Trace Explorer provides multiple visualization modes for analyzing the backend trace:
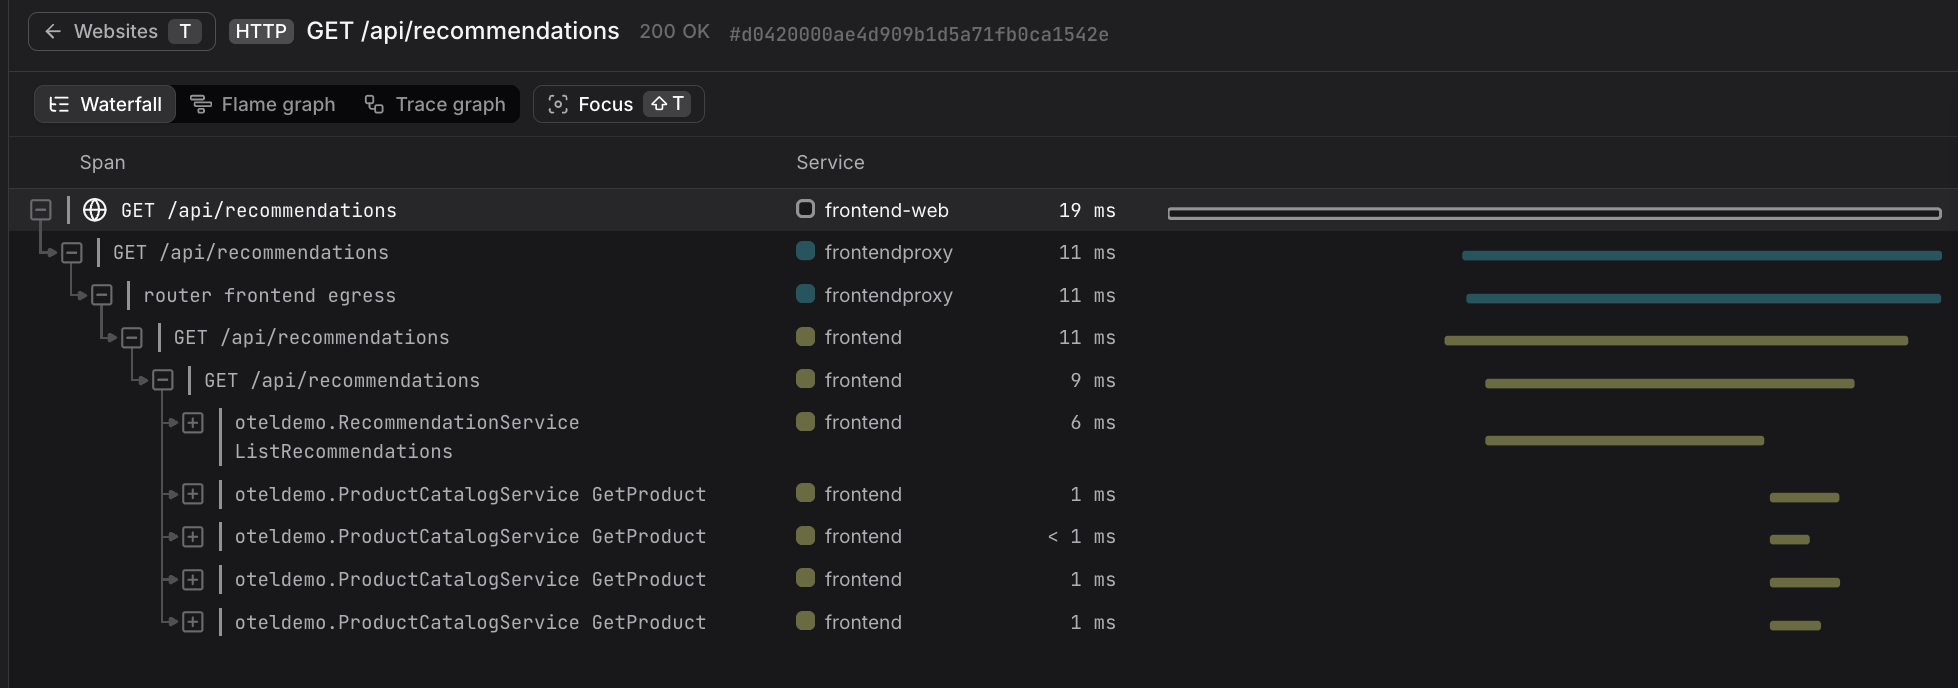
Waterfall View
The default view shows a hierarchical timeline of spans, with each span representing an operation (HTTP request, database query, function call). The waterfall makes it easy to identify which operations took the longest and how they relate to each other.
The left panel shows the span hierarchy with service names and durations. The right panel displays a timeline where span duration is represented by horizontal bars, making it easy to spot performance bottlenecks at a glance.
Flame Graph View
The Flame graph view provides a different perspective on the same trace data, showing the call stack as stacked horizontal bars. This visualization makes it easier to understand the relationship between parent and child spans and identify which code paths consumed the most time.
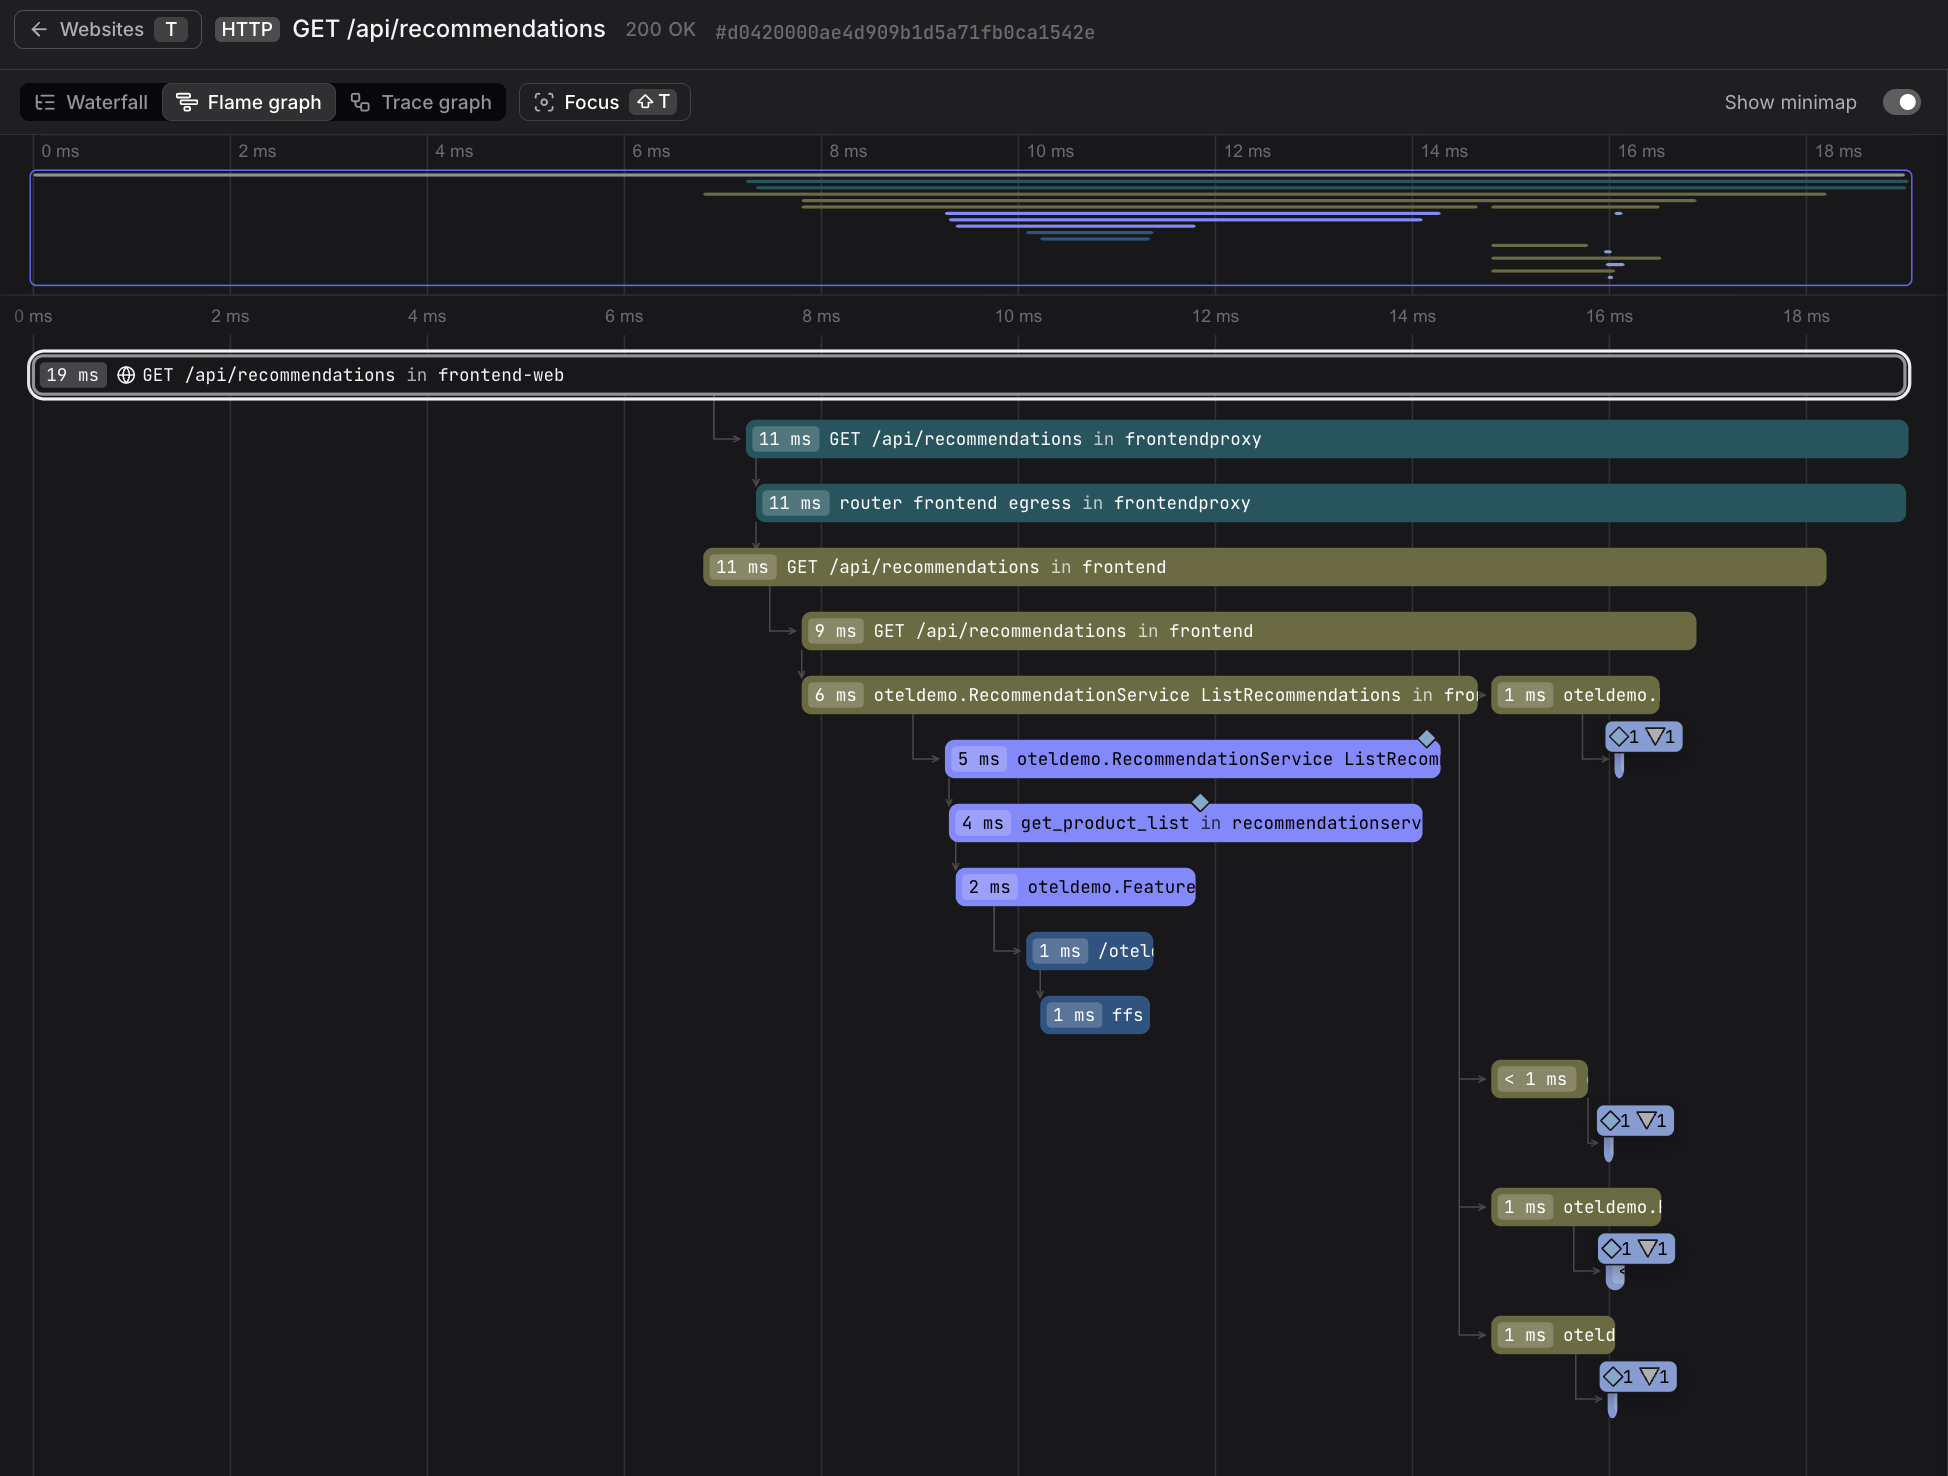
Each bar represents a span, with width proportional to duration. Deeper stacks indicate nested operations, such as a service calling multiple downstream services or executing multiple database queries.
Trace Graph View
The Trace graph view visualizes the trace as a node graph, showing the flow of requests between services. This is particularly useful for understanding distributed system architecture and identifying service dependencies.
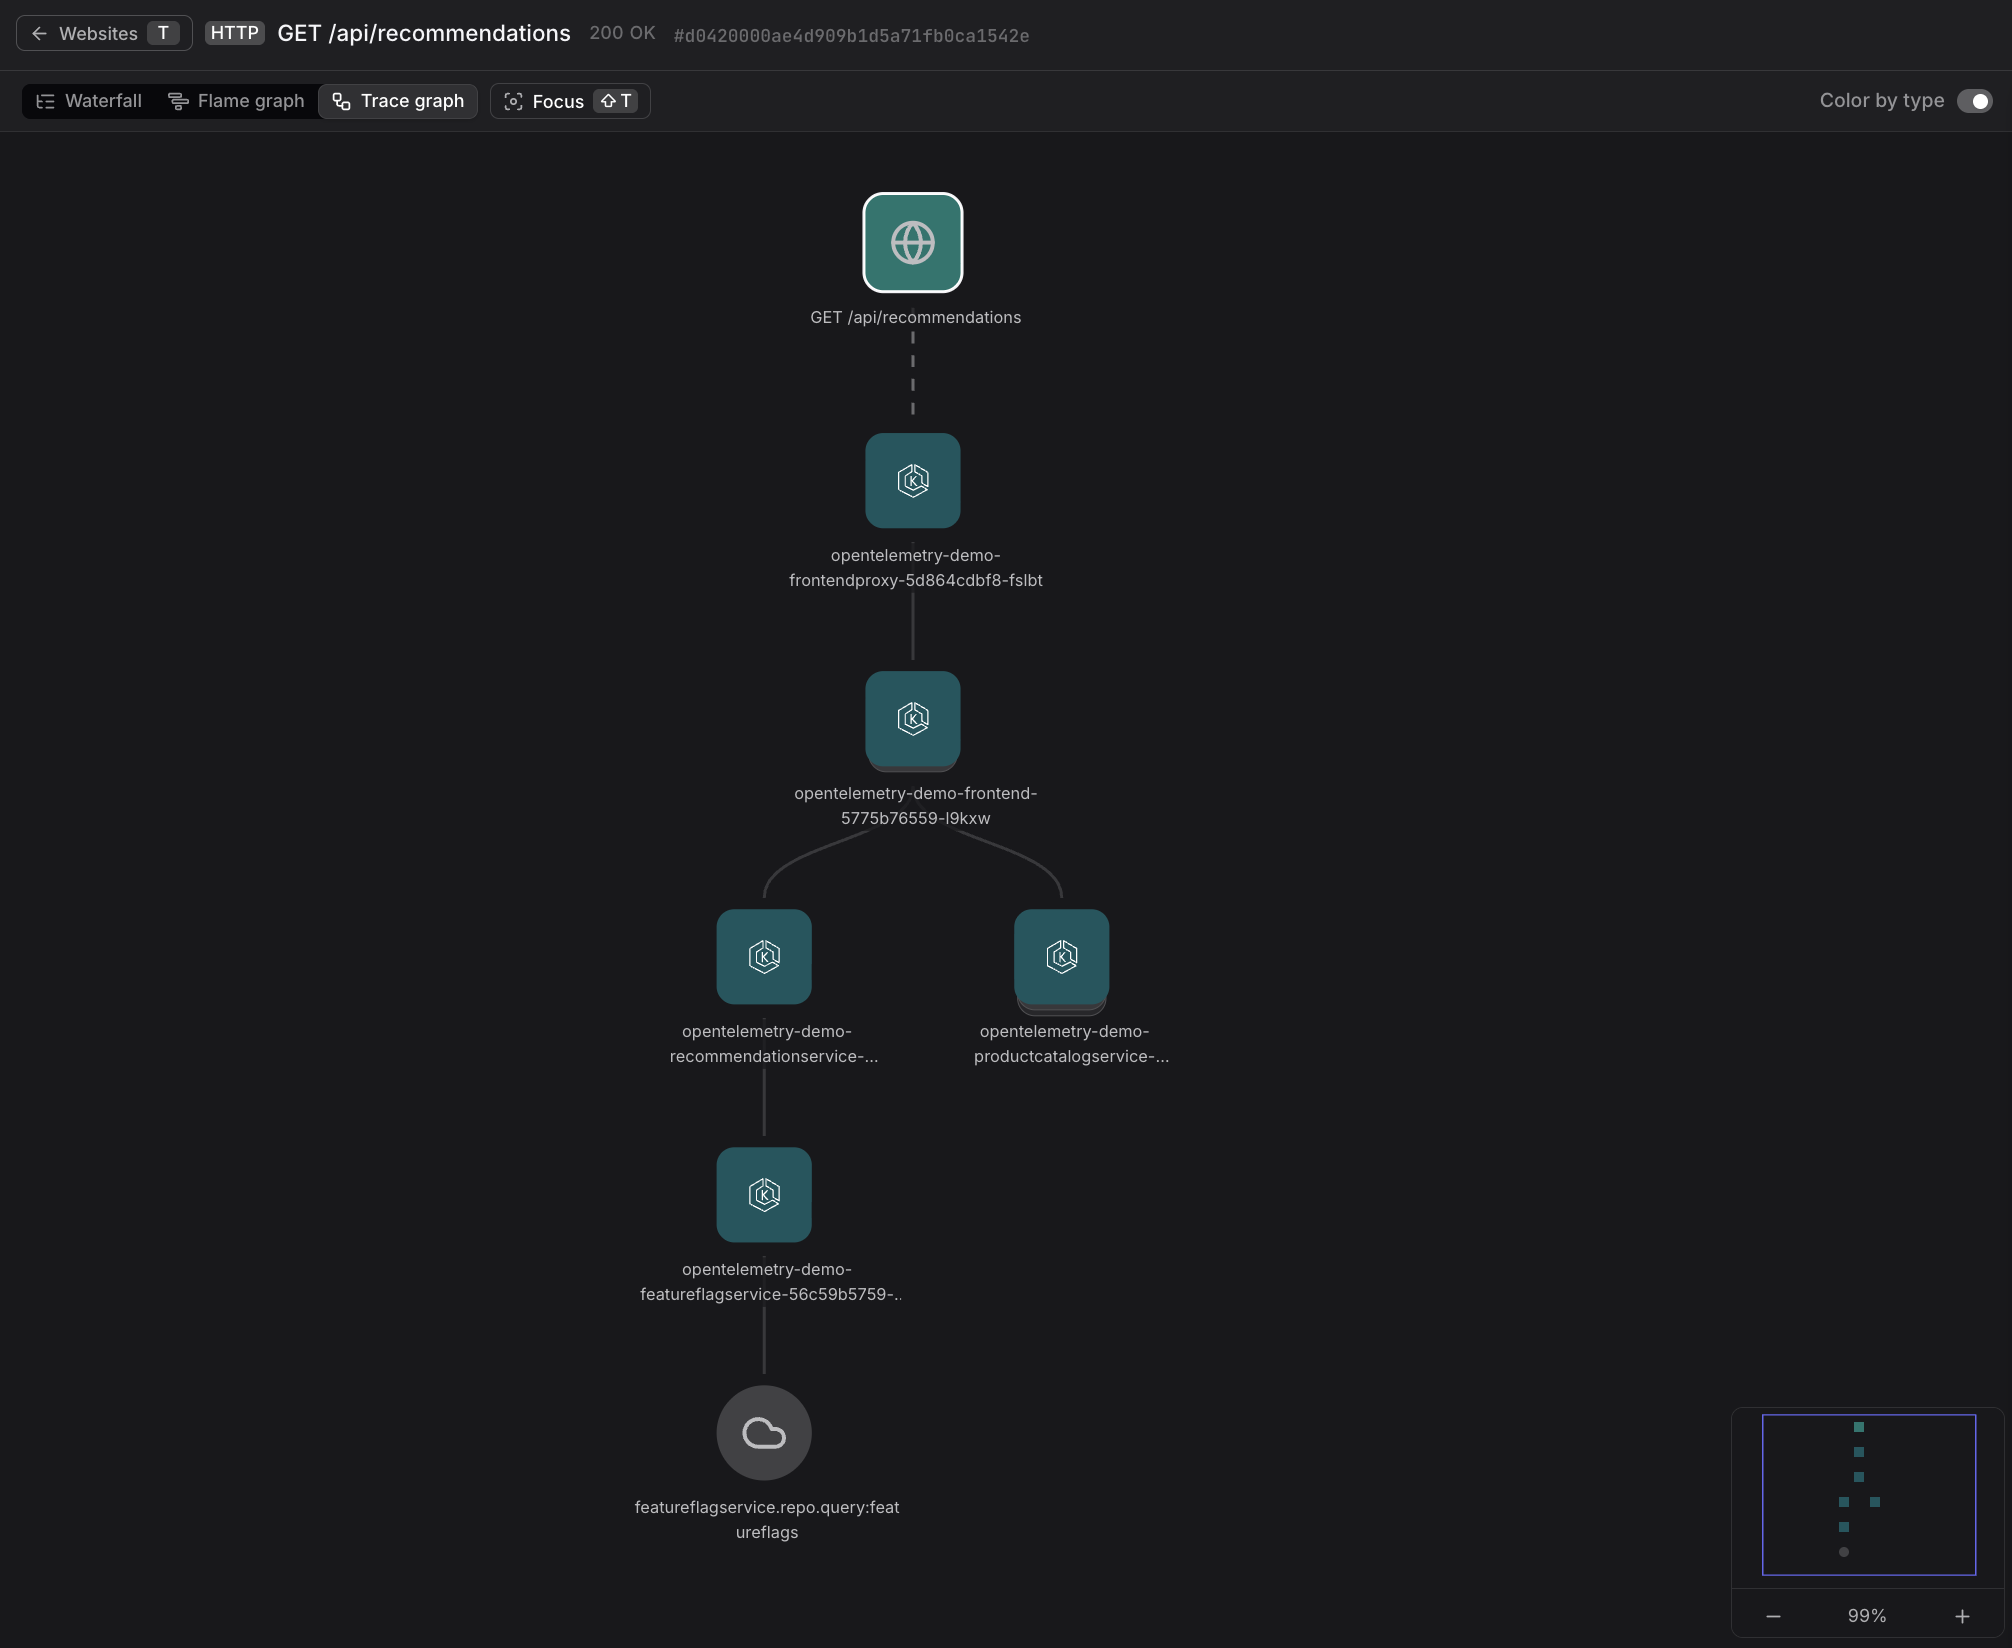
Each node represents a service, and edges show the direction of requests. The top node (with the globe icon) represents the frontend HTTP request that originated from the user's browser.
The globe icon on the top node visually distinguishes the frontend HTTP request from backend service nodes, making it easy to identify where the trace originated in the user's browser.
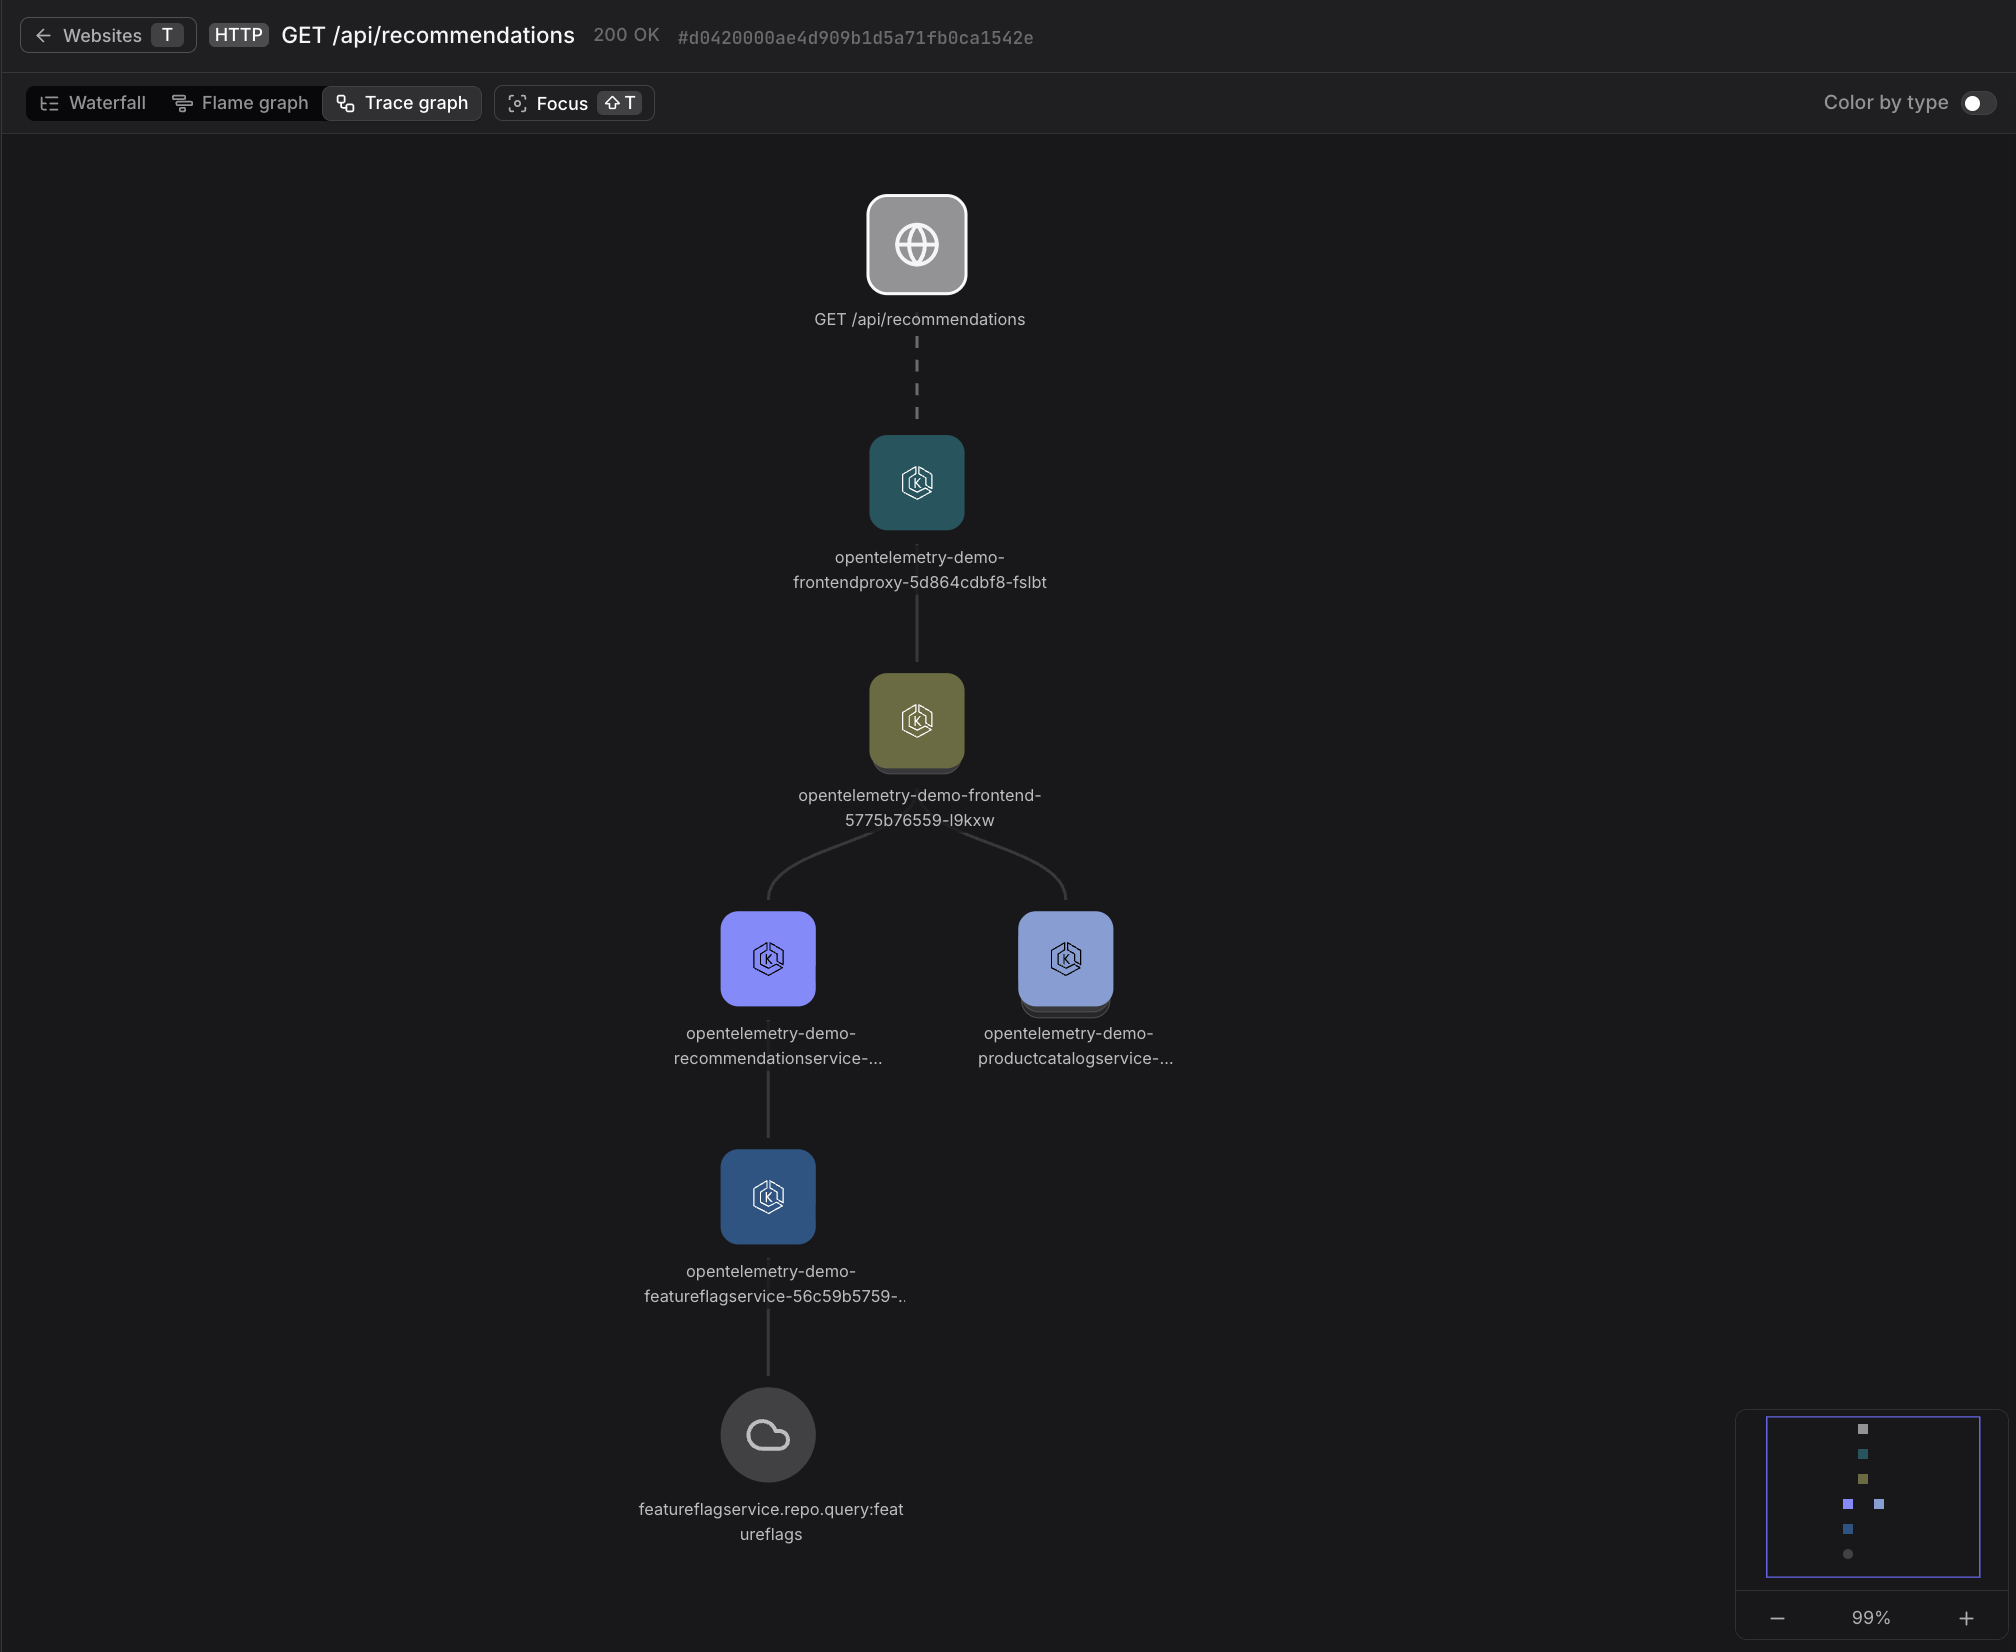
Focus Mode
Focus mode centers on a specific span, making it easier to analyze complex traces with many spans. When you select a span and enable Focus mode, the view filters out unrelated spans and shows only the focused span and its immediate dependencies.
To use Focus mode:
- Click any span in the waterfall, flame graph, or trace graph view to select the span.
- Click the Focus button in the toolbar (or press
Shift+T) to enable Focus mode. - Click Focus again to return to the full trace view.
Focus mode works in all three visualization views.
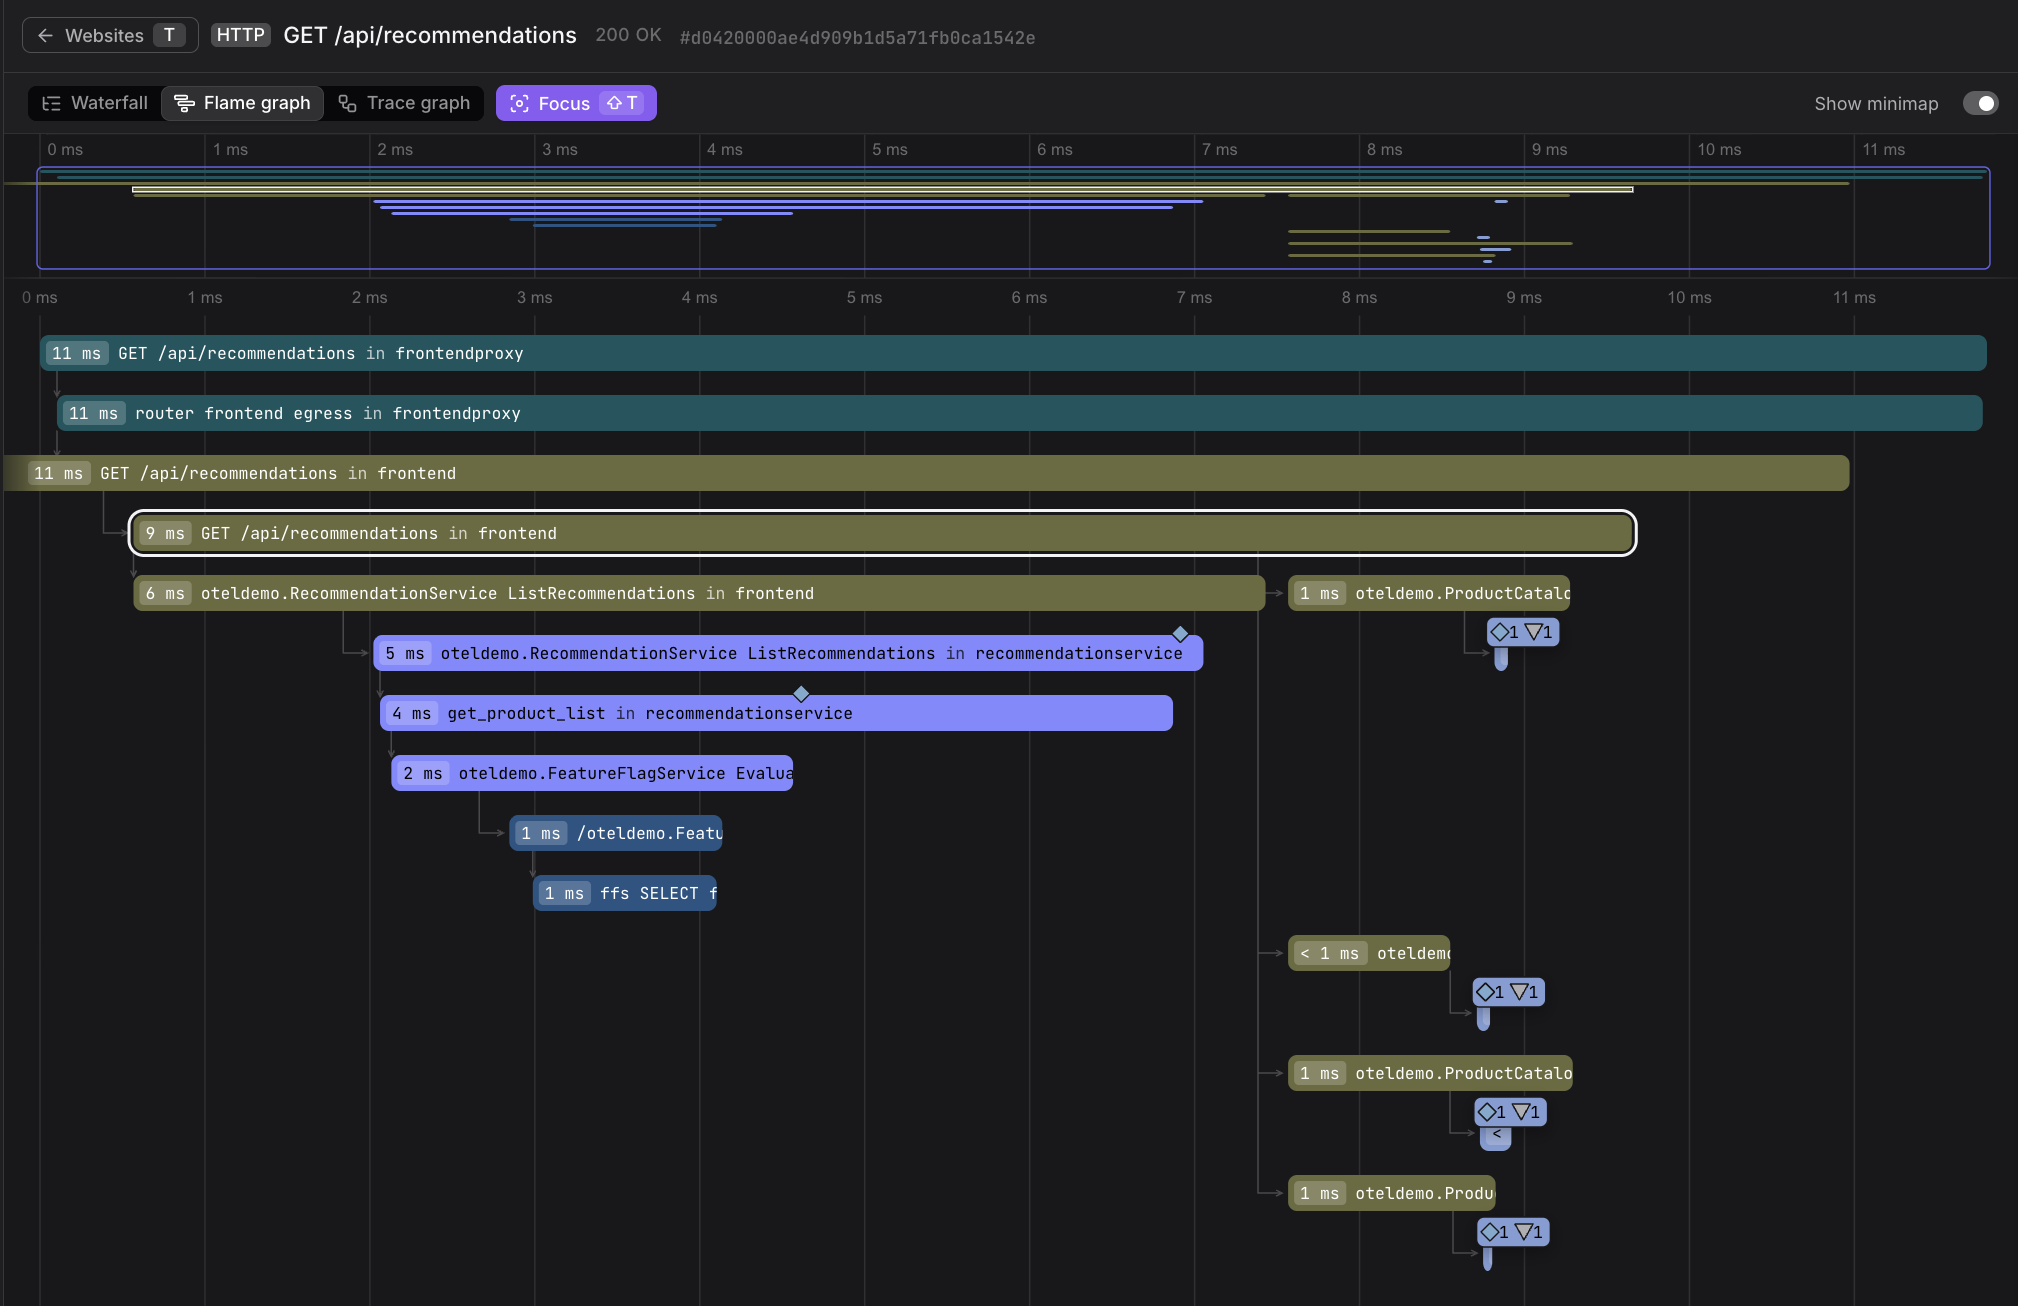
The focused span is highlighted, and only its parent and child spans remain visible, reducing visual clutter:
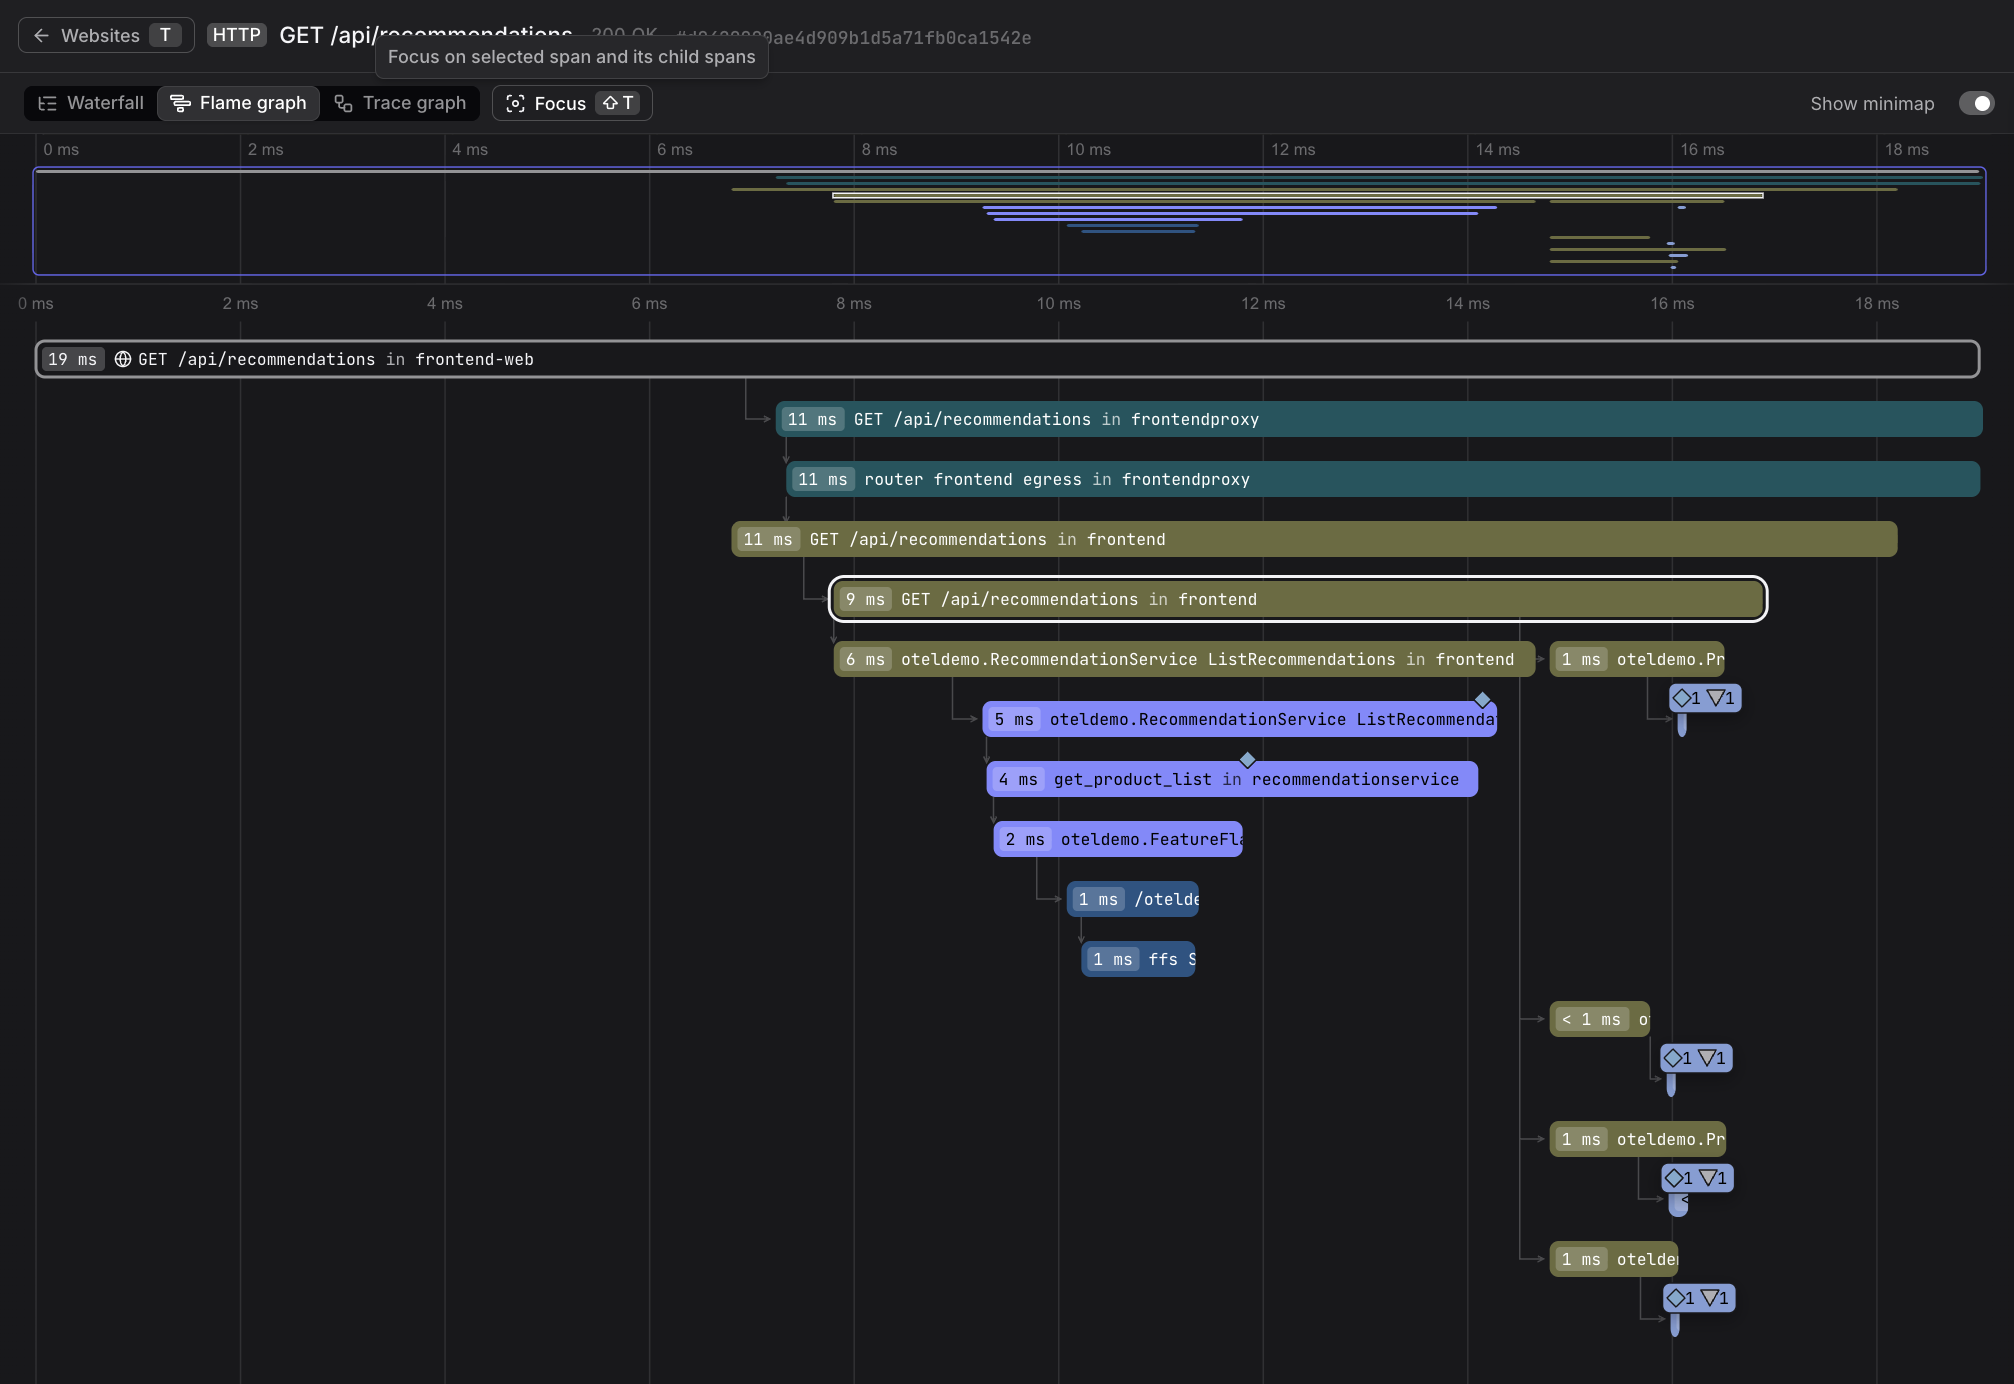
The full trace with all spans is visible, providing complete context.
Navigate Back to the Session
A back button appears at the top left of the trace view. Click the back button (or press T) to return to the session where you initiated the trace investigation.
This bidirectional navigation between frontend sessions and backend traces is essential for full-stack debugging. You can start with a user session, drill down into a slow HTTP request, investigate the backend trace, and return to the session to see the broader user experience context.
For comprehensive information about the Trace Explorer, visualization modes, and span investigation features, see About Tracing and Visualize the Full Trace.
Further Reading
- About Tracing. Distributed tracing concepts and Trace Explorer.
- Correlate Sessions with Backend Traces. Complete end-to-end debugging workflow showing how the full trace view fits into session investigation.
- View Event Details. Event detail sidebar where you click View full trace to open this view.
- Track HTTP Requests. How HTTP requests are instrumented and traced, including cross-origin configuration.