Last updated: June 22, 2026
Correlate with Backend Traces
Dash0 automatically links frontend HTTP requests to backend traces, providing end-to-end visibility from the user's browser through to backend service execution. This makes it possible to diagnose performance issues that span the full stack in a single workflow.
This workflow seamlessly transitions from the Website Monitoring world (sessions, web events, page views) into the Tracing world (spans, traces, waterfalls) within the same investigation flow. Dash0 preserves context across both worlds, allowing you to debug full-stack issues without switching tools or losing the thread.
This guide shows the complete debugging workflow: from identifying a slow page load in a session, to drilling into the specific HTTP request, to investigating the backend trace to find the root cause.
A user reports that checkout is slow. You filter sessions by page.url.path = /checkout, open a session, and see the event table shows a POST /api/orders request took 3.2 seconds. You click the request and see the Request Duration chart shows p75 is only 200ms — this request is an outlier. You click View full trace and the waterfall view reveals a database query span took 2.8 seconds. You've identified the root cause without any guesswork.
Complete Debugging Workflow
Here's the end-to-end workflow for diagnosing a slow page load:
1. Identify the Slow Session
Start in the Sessions tab. Use filters to narrow down to the problematic scenario:
- Filter by
page.url.pathto find sessions that visited the slow page (e.g.,page.url.path = /checkout) - Filter by
deployment.nameordeployment.idto focus on a specific release - Look for sessions with high error counts (red indicator in the Errors count column)
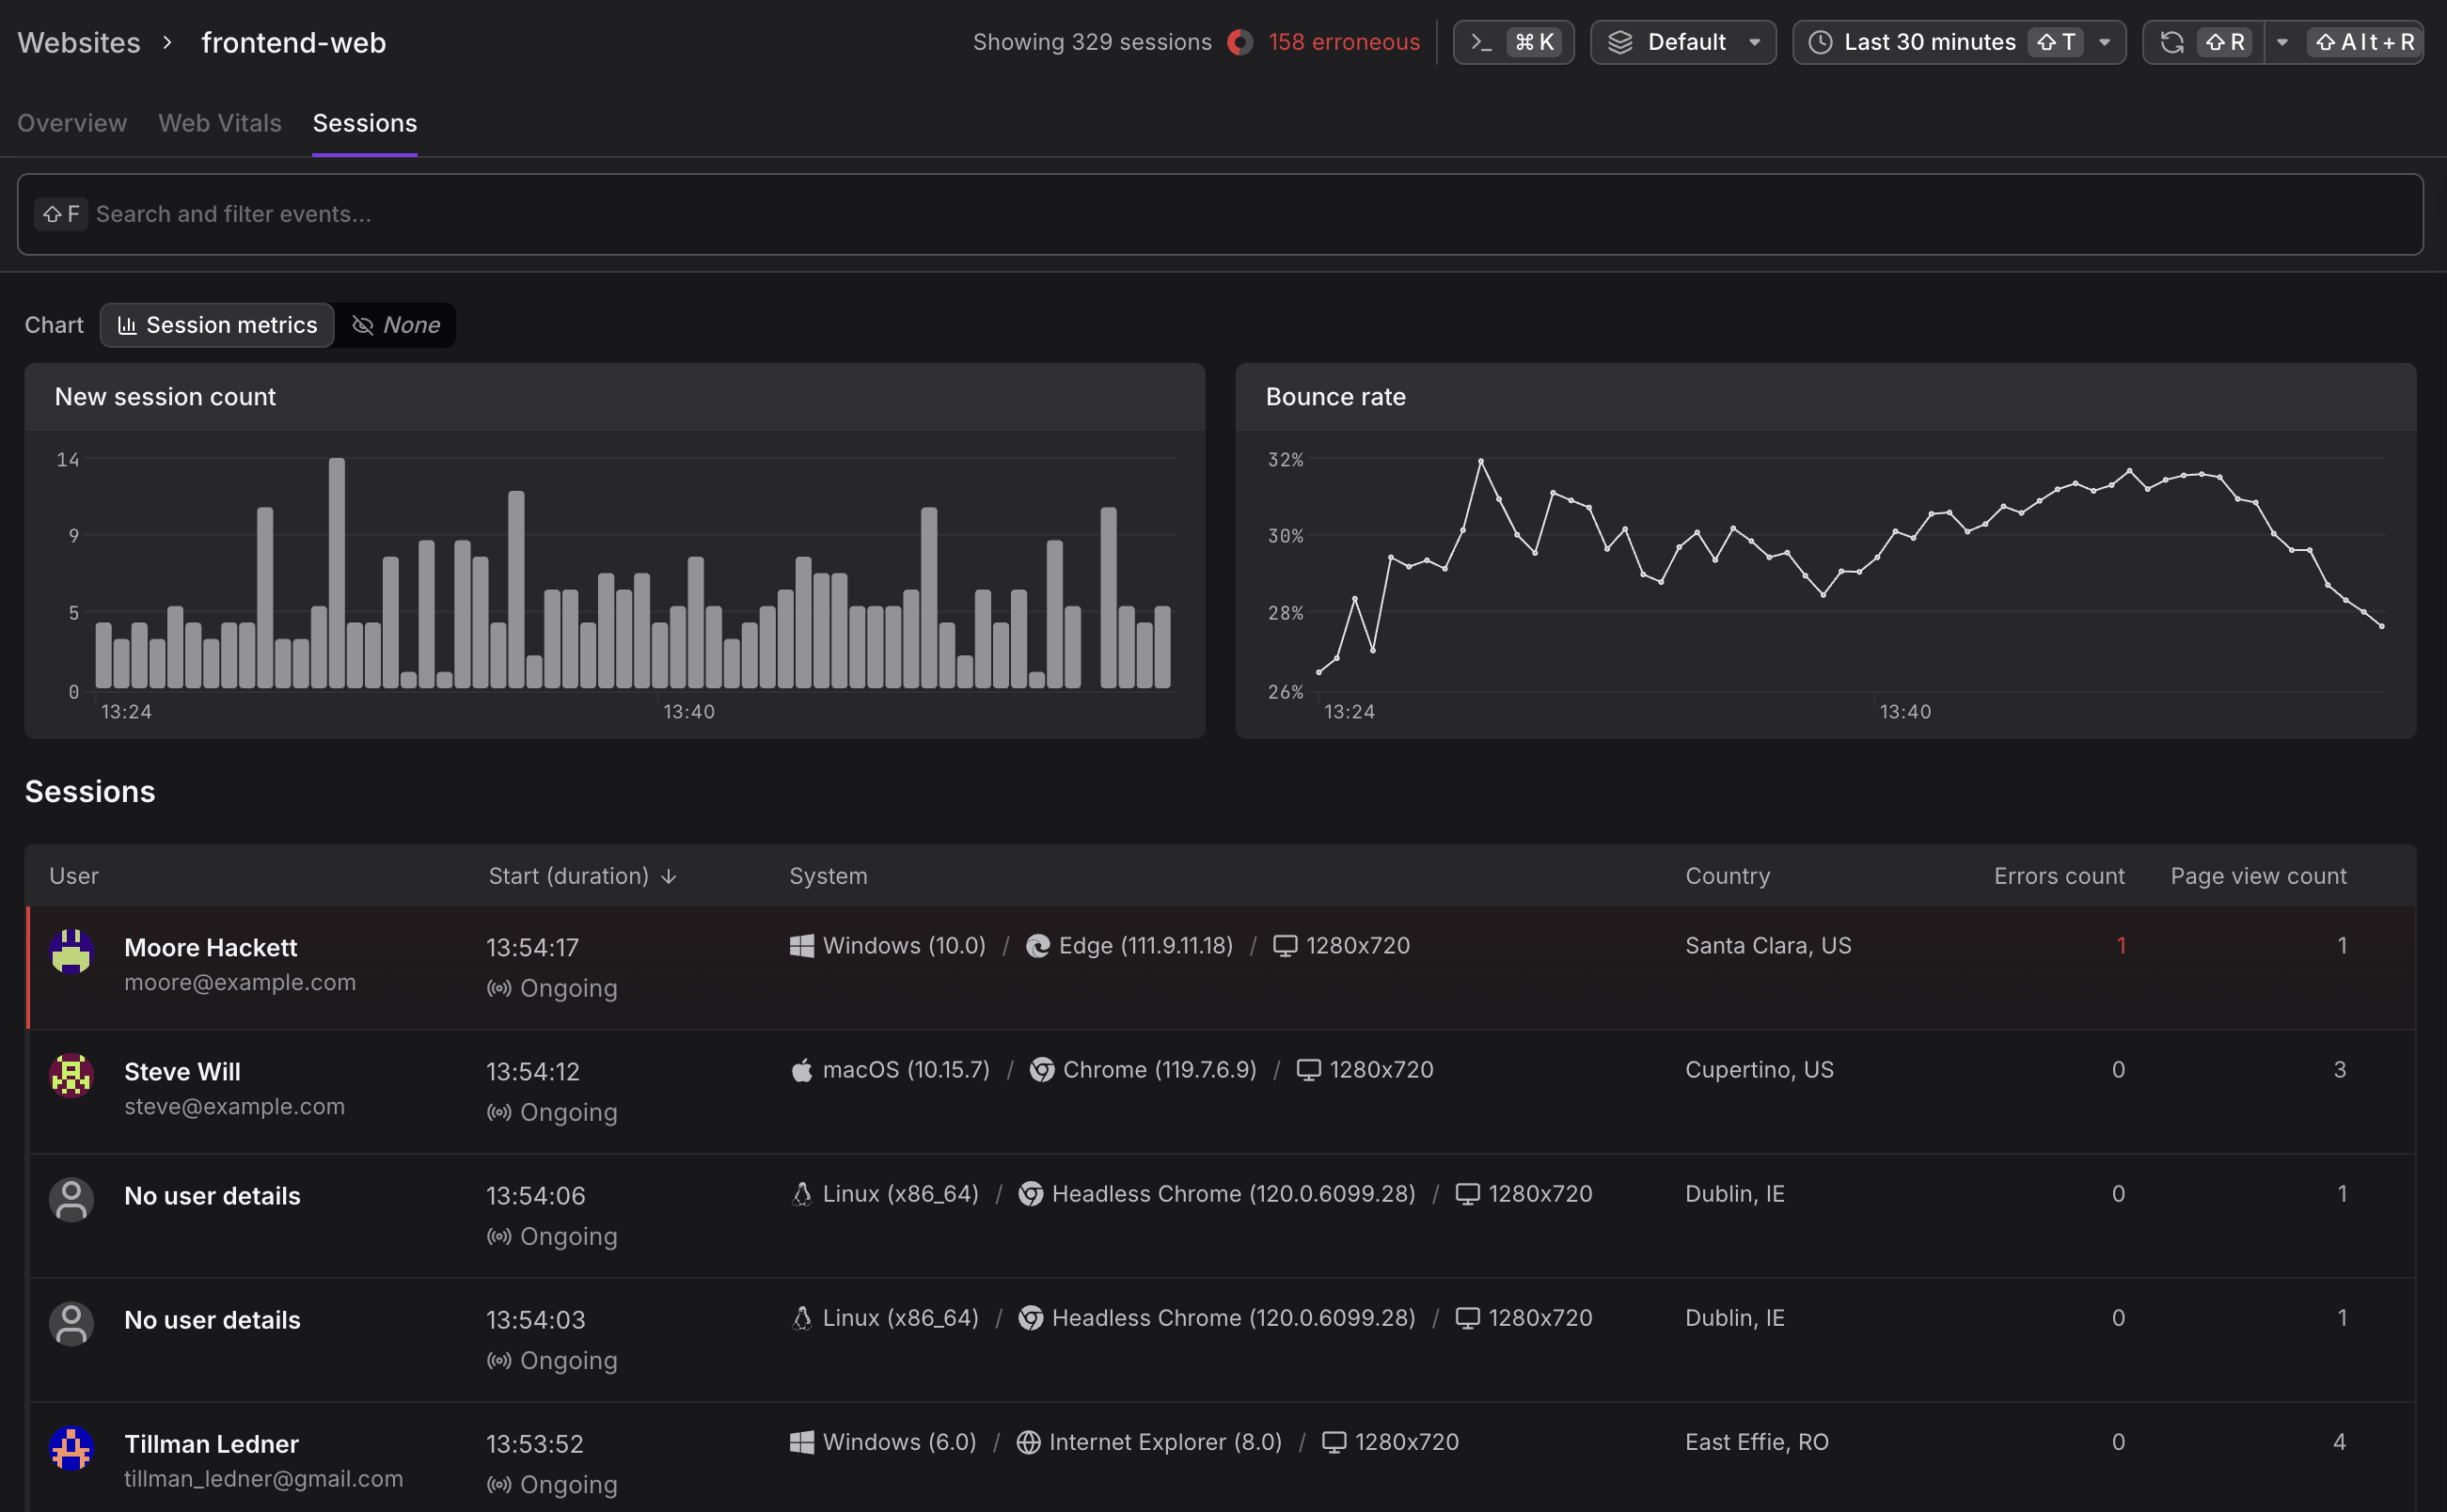
Click the session row to open the session detail panel and verify this is the issue you're investigating.
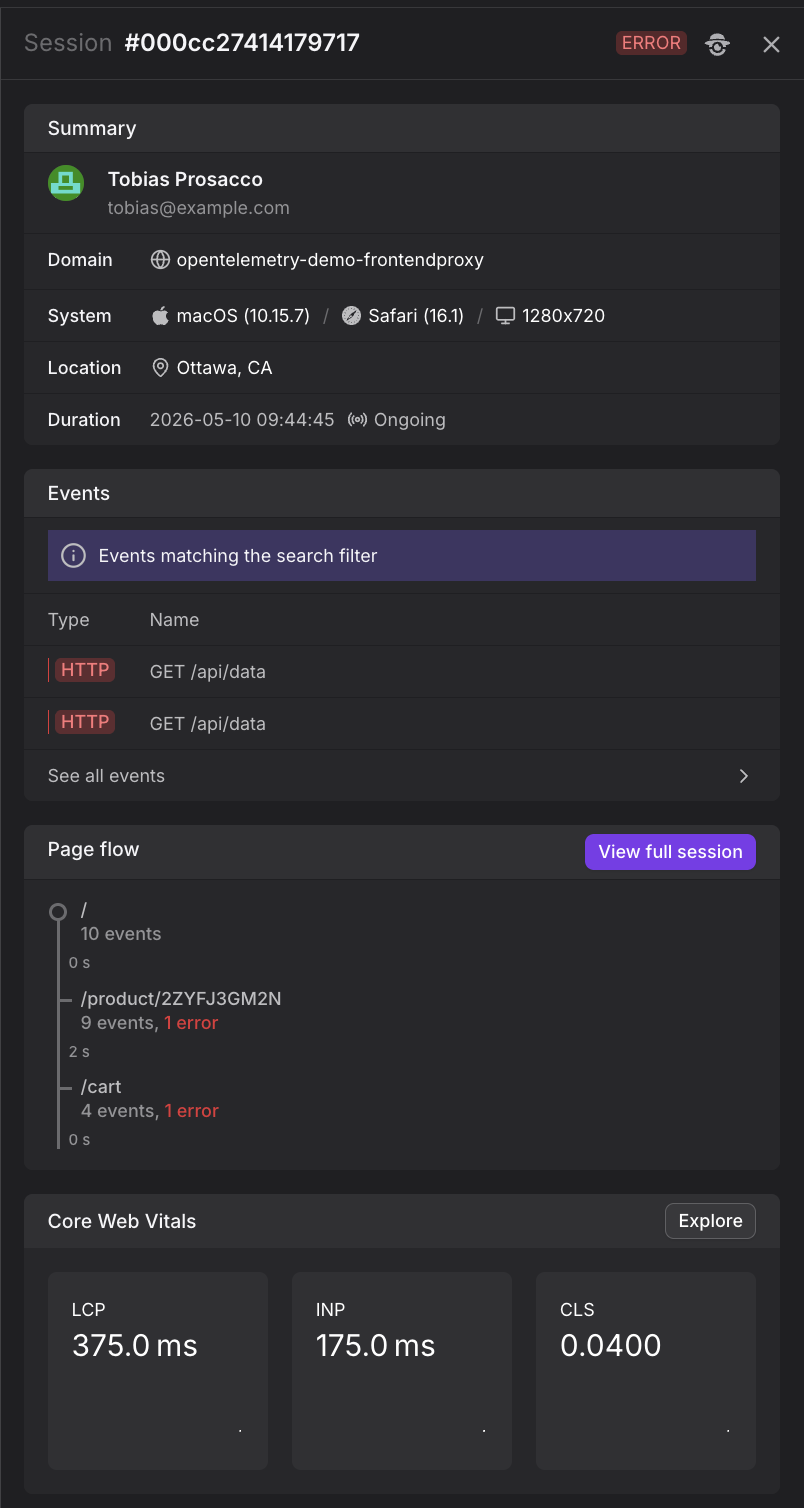
2. Open the Full Session View
Click View full session in the session detail panel. This opens the complete event-by-event timeline. See View the Full Session for details on what this view shows.
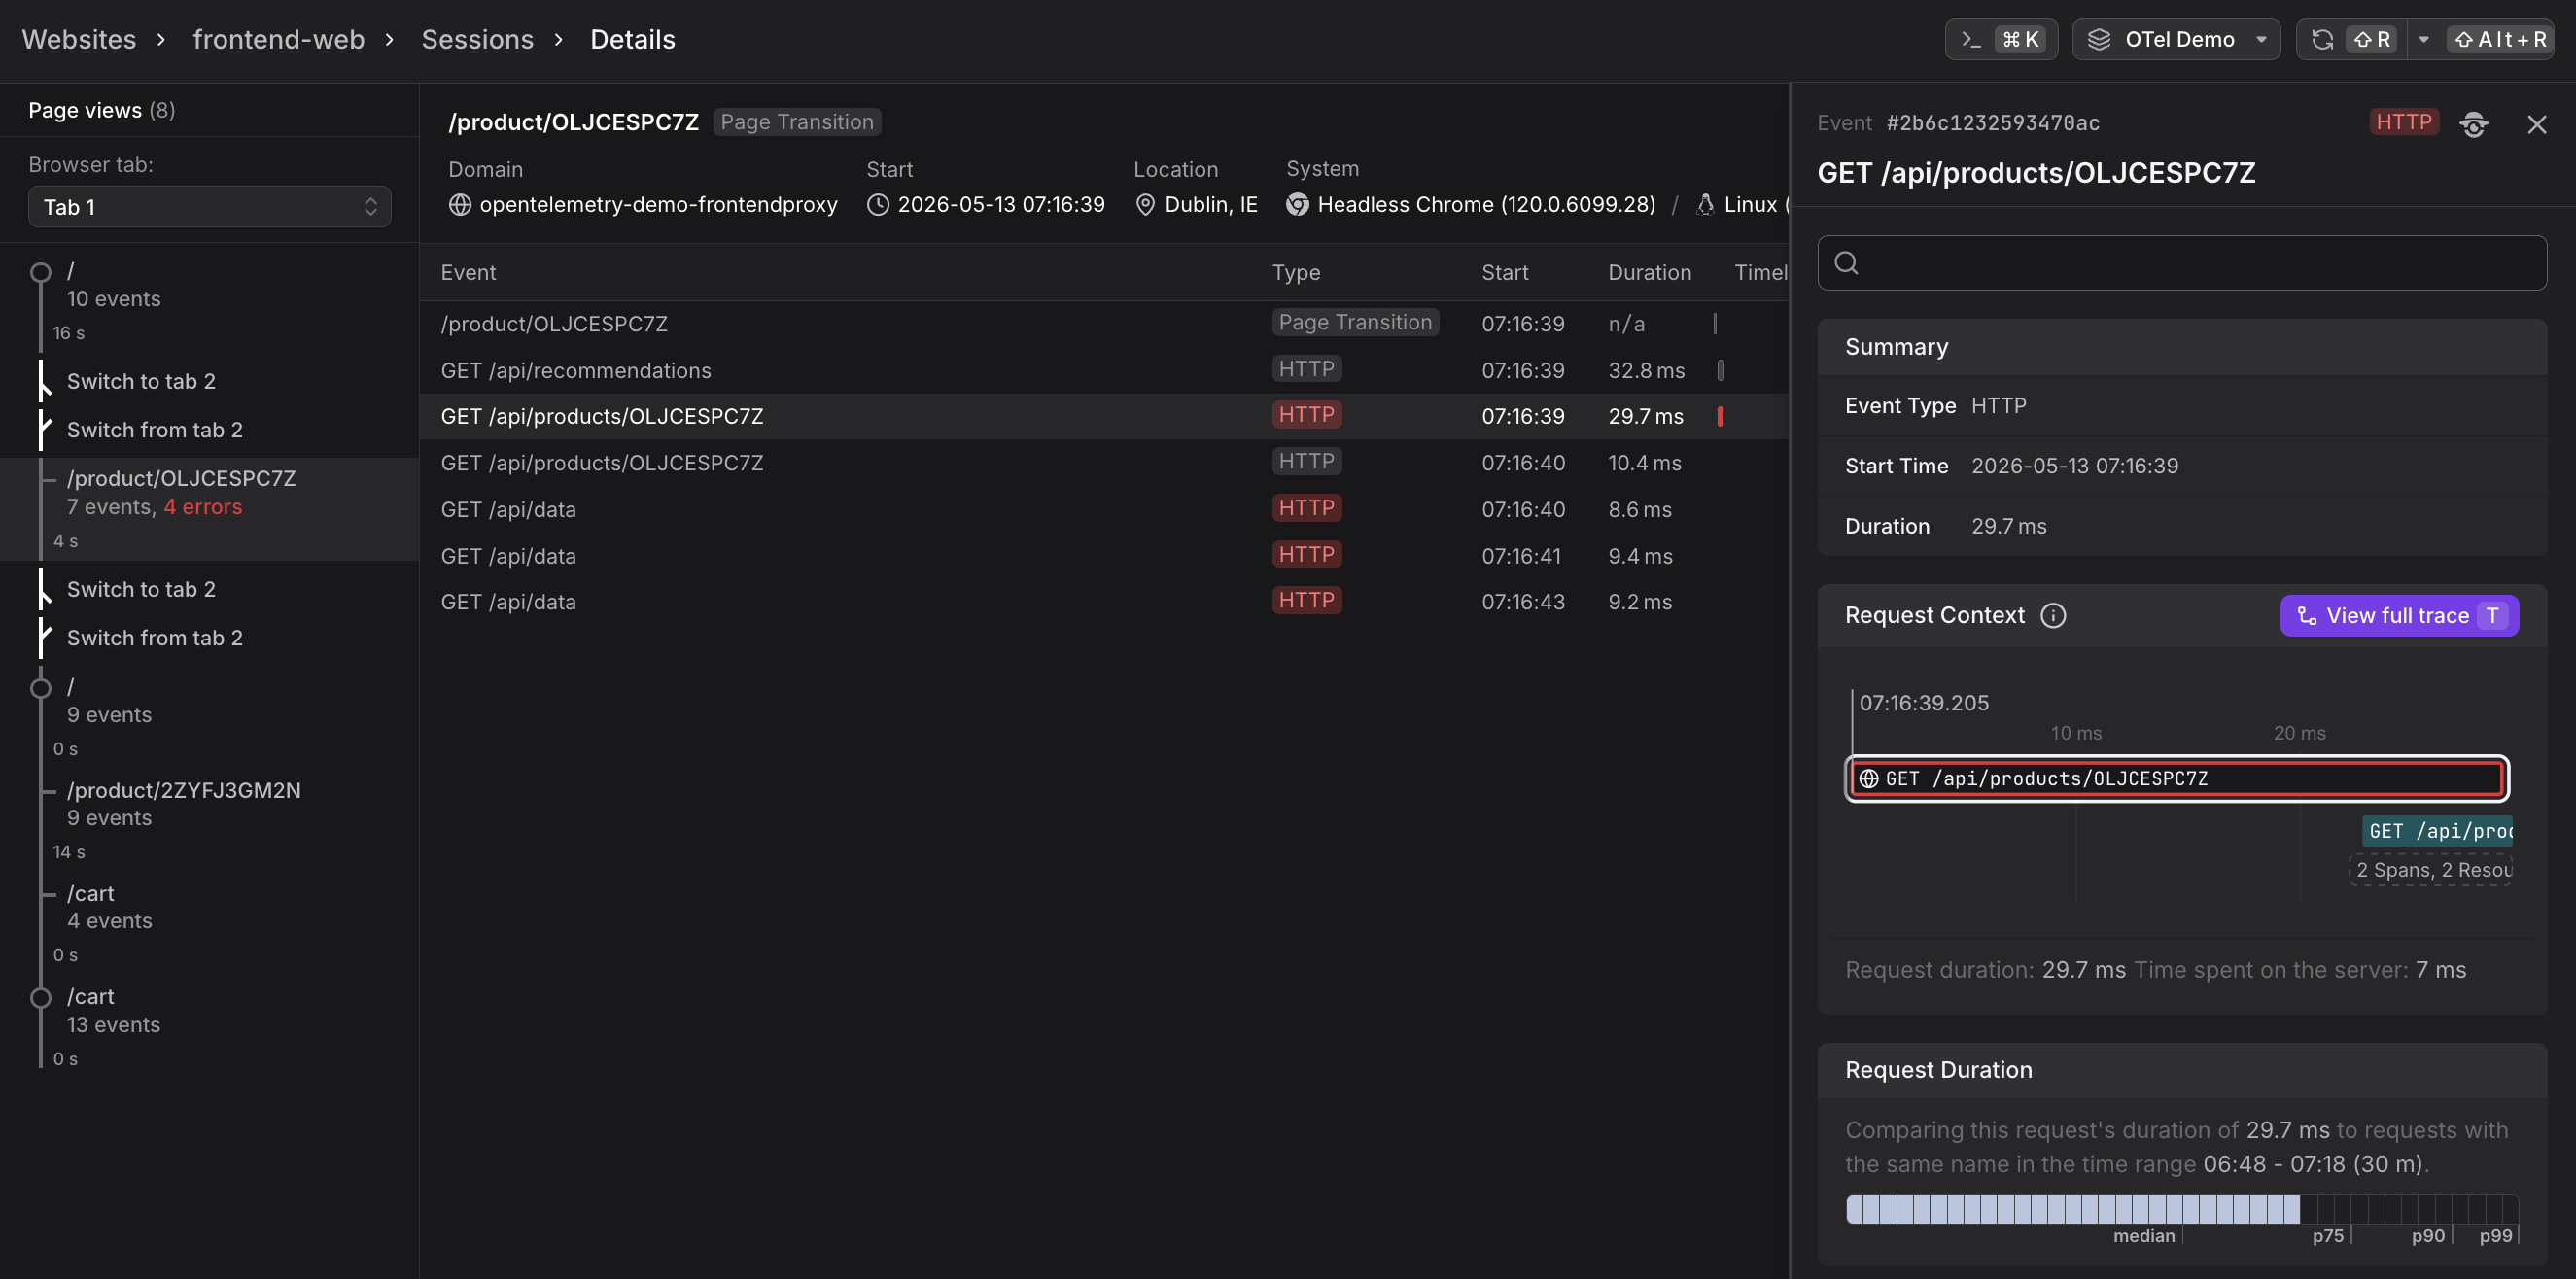
The left sidebar above shows cross-tab tracking in action. Notice the "Switch to tab 2" and "Switch from tab 2" entries — Dash0 automatically tracks when users switch between multiple browser tabs within the same session, preserving the complete user journey across tabs.
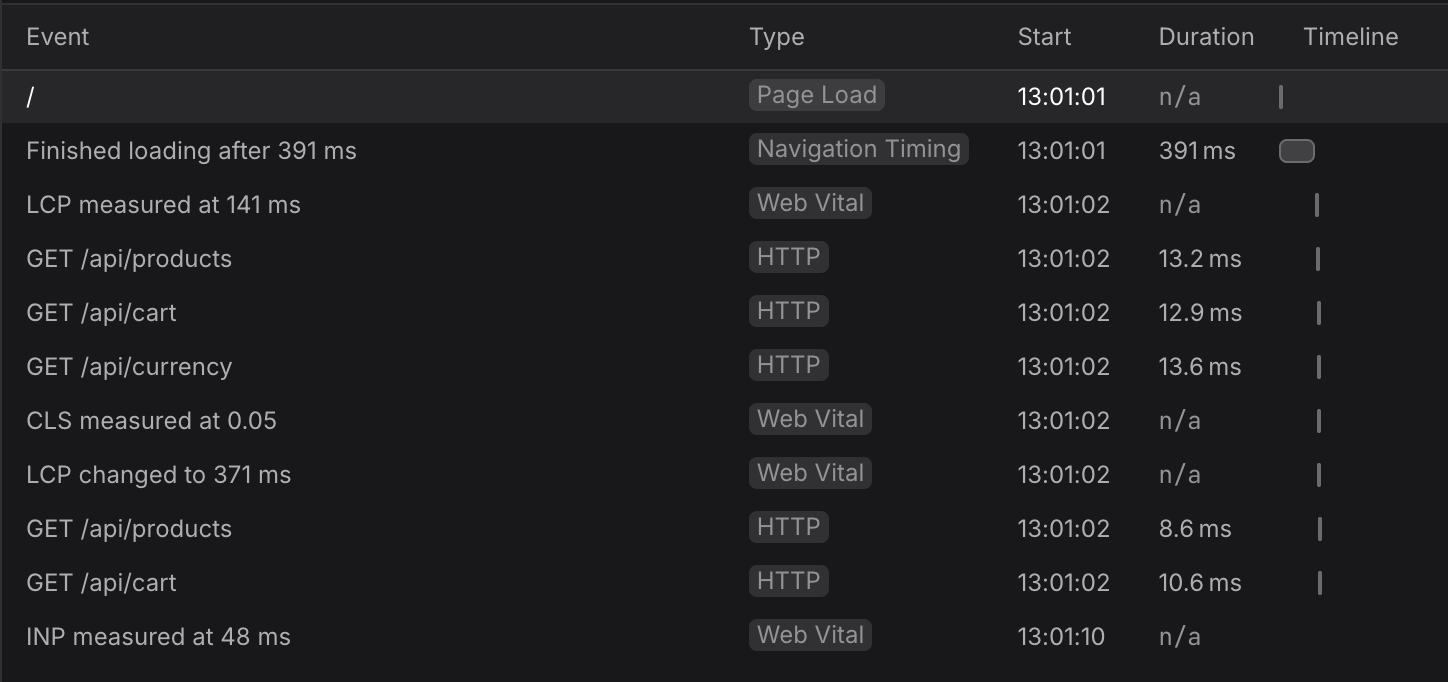
3. Find the Slow HTTP Request
Look at the event table and examine the Duration and Timeline columns. HTTP requests that took significantly longer than others will stand out:
- Check the Timeline column for long horizontal bars
- Sort by Duration to find the slowest requests
- Look for requests that occurred during the page load
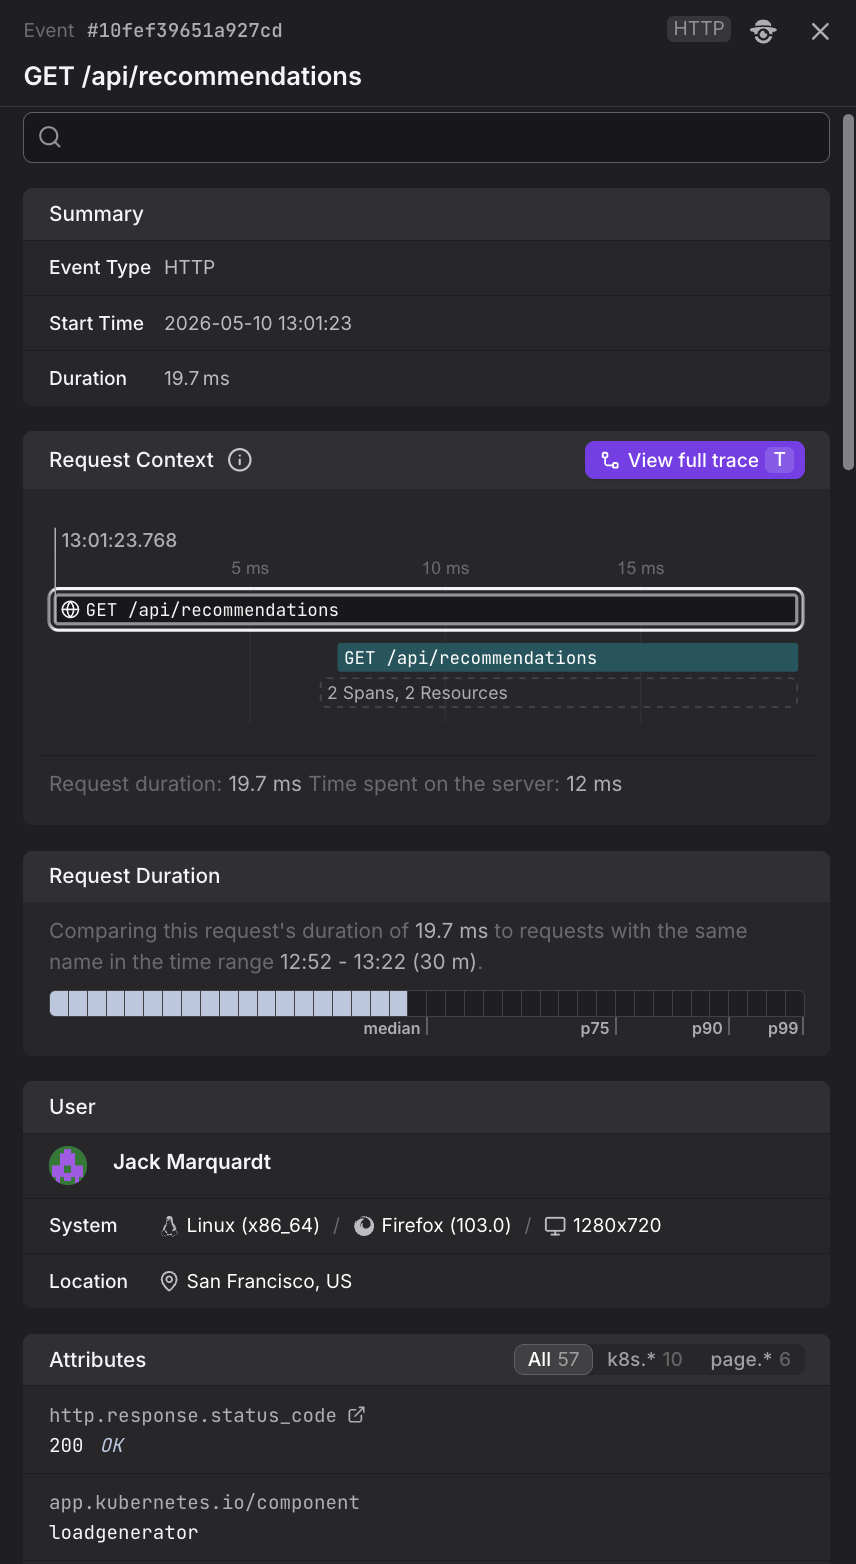
4. View Request Details and Trace Context
Click the slow HTTP request row to open the event detail sidebar. The sidebar shows Request Context (a compact trace tree) and Request Duration (a comparison chart showing percentiles). If this request is significantly slower than the percentiles, it's a good candidate for deeper investigation.
5. Investigate the Backend Trace
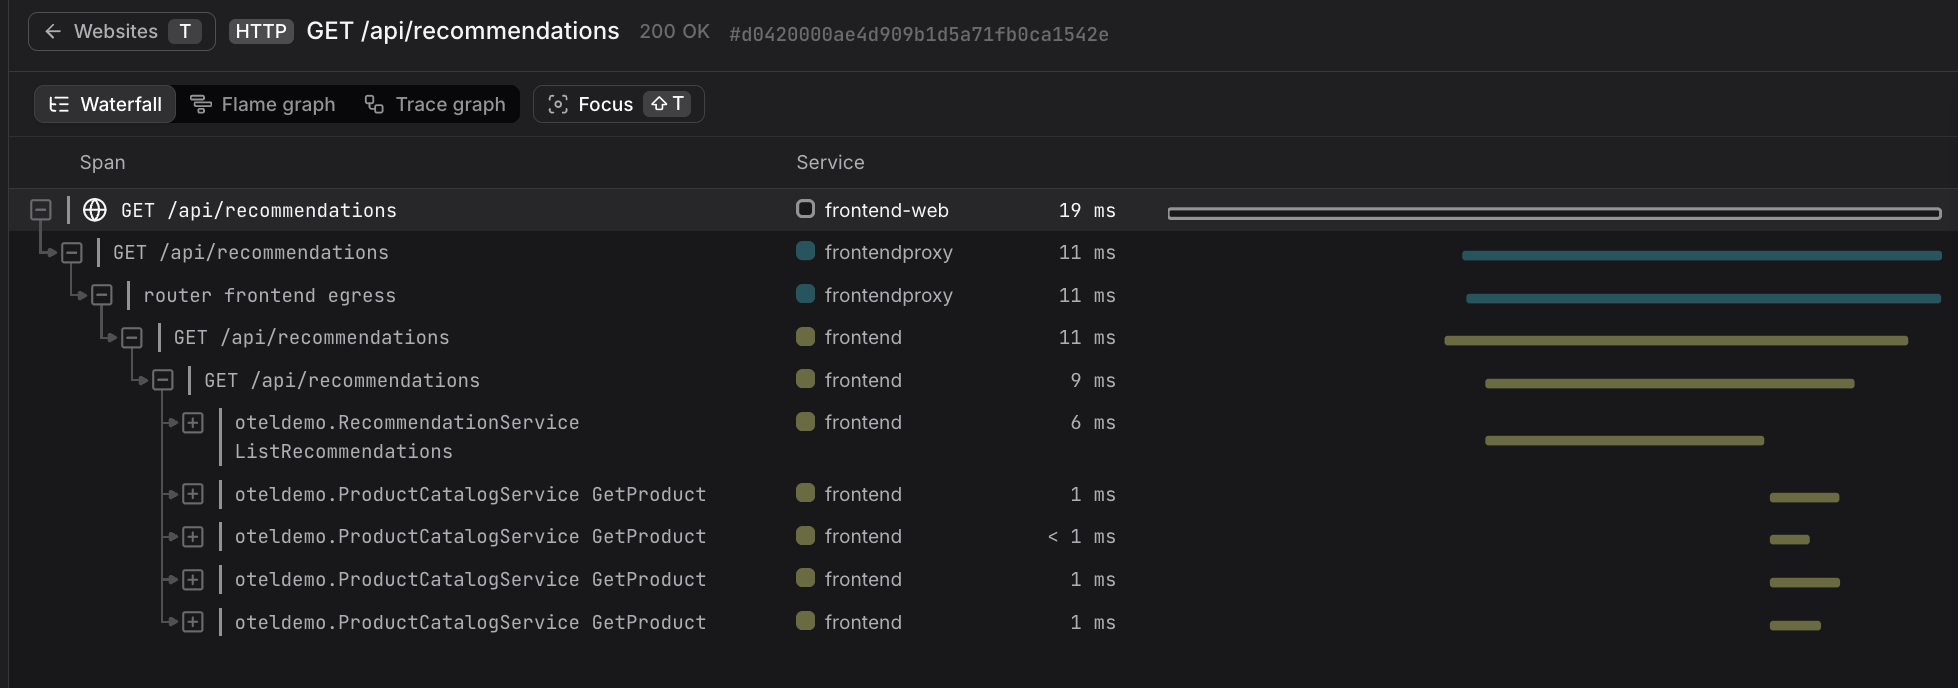
Click View full trace in the sidebar to open the Trace Explorer. Use the waterfall, flame graph, or trace graph views to identify the root cause.
At this point, you're transitioning from the Website Monitoring world into the Tracing world. The Trace Explorer shows backend spans, service-to-service calls, and database queries — the same views you'd use when debugging backend performance issues directly. The trace remains linked to the originating session, so you can navigate back to see the user's context at any time.
Notice the "← Websites" back button at the top left of the trace view (or press T). This visual indicator shows you came from the Website Monitoring world and provides a quick way to return to the originating session context.
See View the Full Trace for details on each visualization mode.
6. Navigate Back
Click the back button (or press T) to return to the session. From there, you can check other HTTP requests or continue investigating the user's journey.
The same correlation works in reverse: from a backend span in the Trace Explorer, you can navigate back to the originating frontend session to see what the user was doing when the request was made.
How Trace Correlation Works
The Web SDK automatically propagates OpenTelemetry trace context with every HTTP request to an instrumented backend by including a traceparent header. This header contains:
- Trace ID — Links the frontend request to the backend trace.
- Parent span ID — Identifies the frontend request span as the parent of backend spans.
- Trace flags — Indicates whether the trace is sampled.
When an instrumented backend service receives a request with the traceparent header, it creates child spans linked to the frontend request span. This creates a complete trace that spans from the browser through all backend services.
For cross-origin requests, you must explicitly configure the Web SDK to propagate trace context to specific origins. By default, trace context is only sent to same-origin requests. See Track HTTP Requests for configuration details.
Further Reading
- Investigate Sessions. Shows how to use the Sessions tab to find and filter sessions (step 1 of the workflow).
- View the Full Session. Complete event-by-event session view where you identify slow HTTP requests (steps 2-3).
- View Event Details. Event detail sidebar with Request Context and Request Duration charts (step 4).
- View the Full Trace. Backend trace visualizations for identifying root causes (step 5).
- Track HTTP Requests. Technical details on trace context propagation and cross-origin configuration.