Last updated: June 19, 2026
About Investigating Sessions
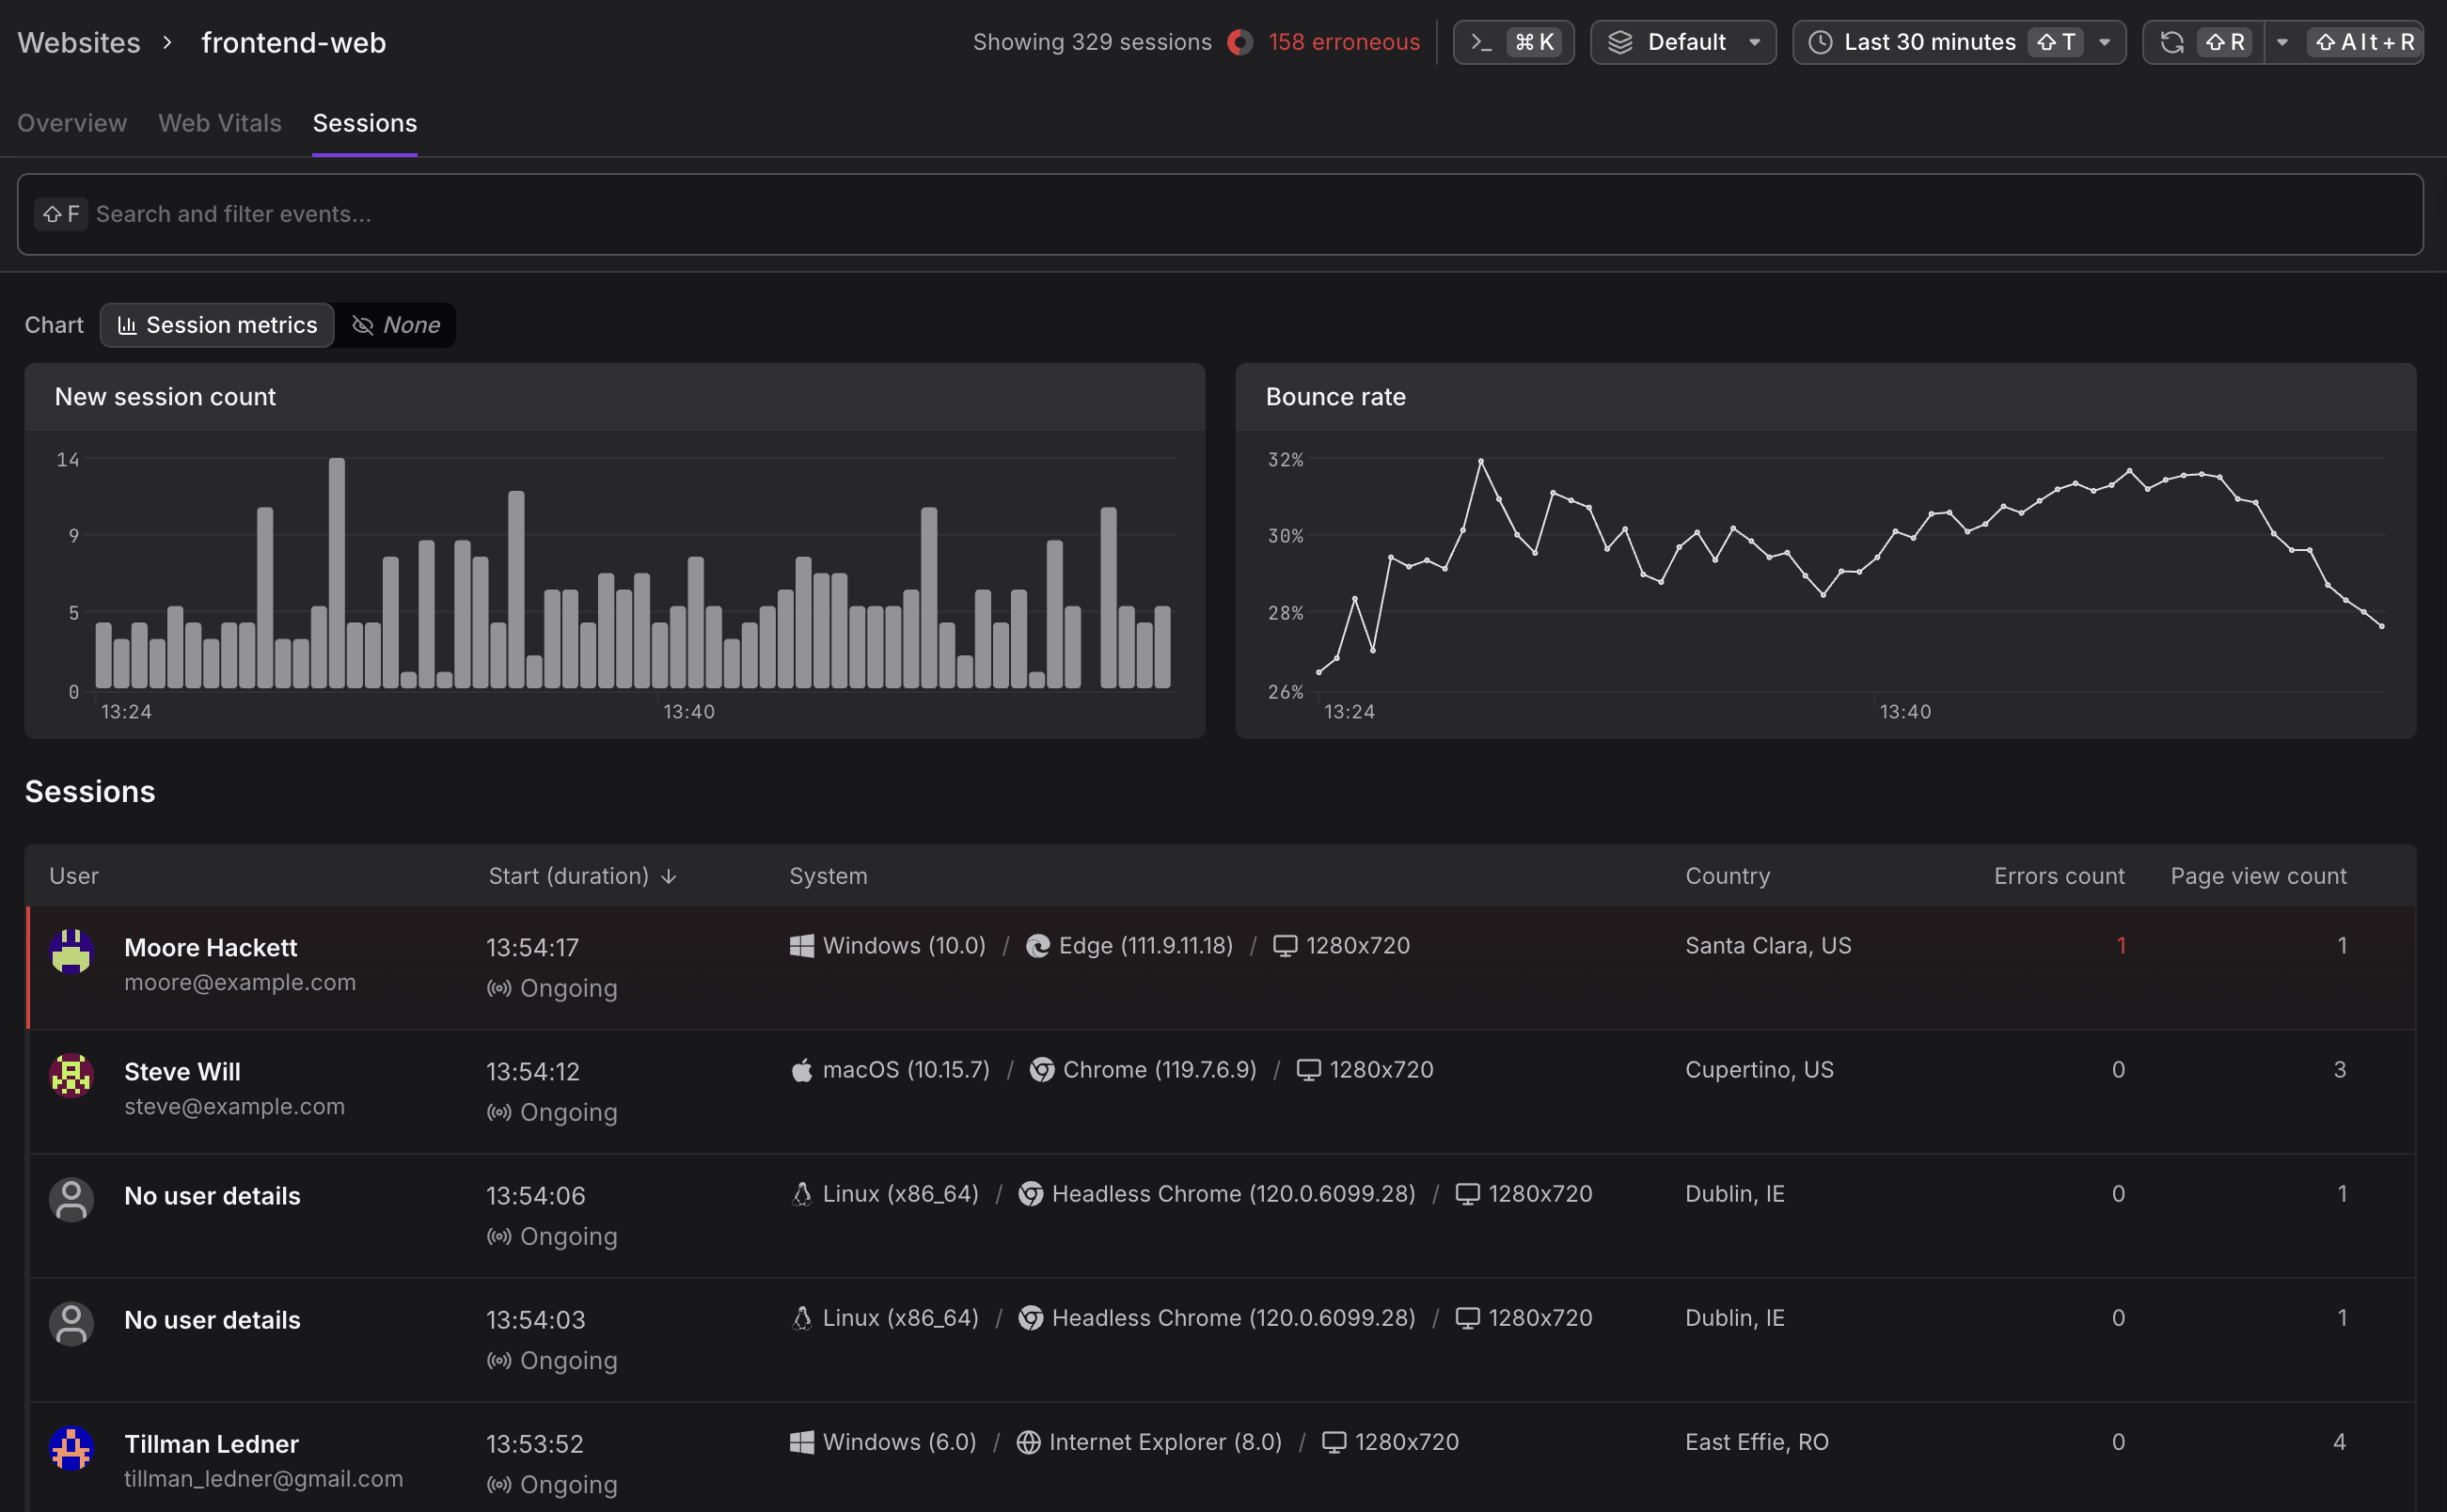
Sessions in the Websites Explorer lists every user session recorded for a website within the selected time window.
Use it to understand session volume trends, identify users who encountered errors, filter sessions to a specific page or deployment, and open the full session detail to follow a user's exact journey through your application.
Use the Session Summary Charts
Above the session list, two charts provide an aggregated view of session behavior over the selected time window.
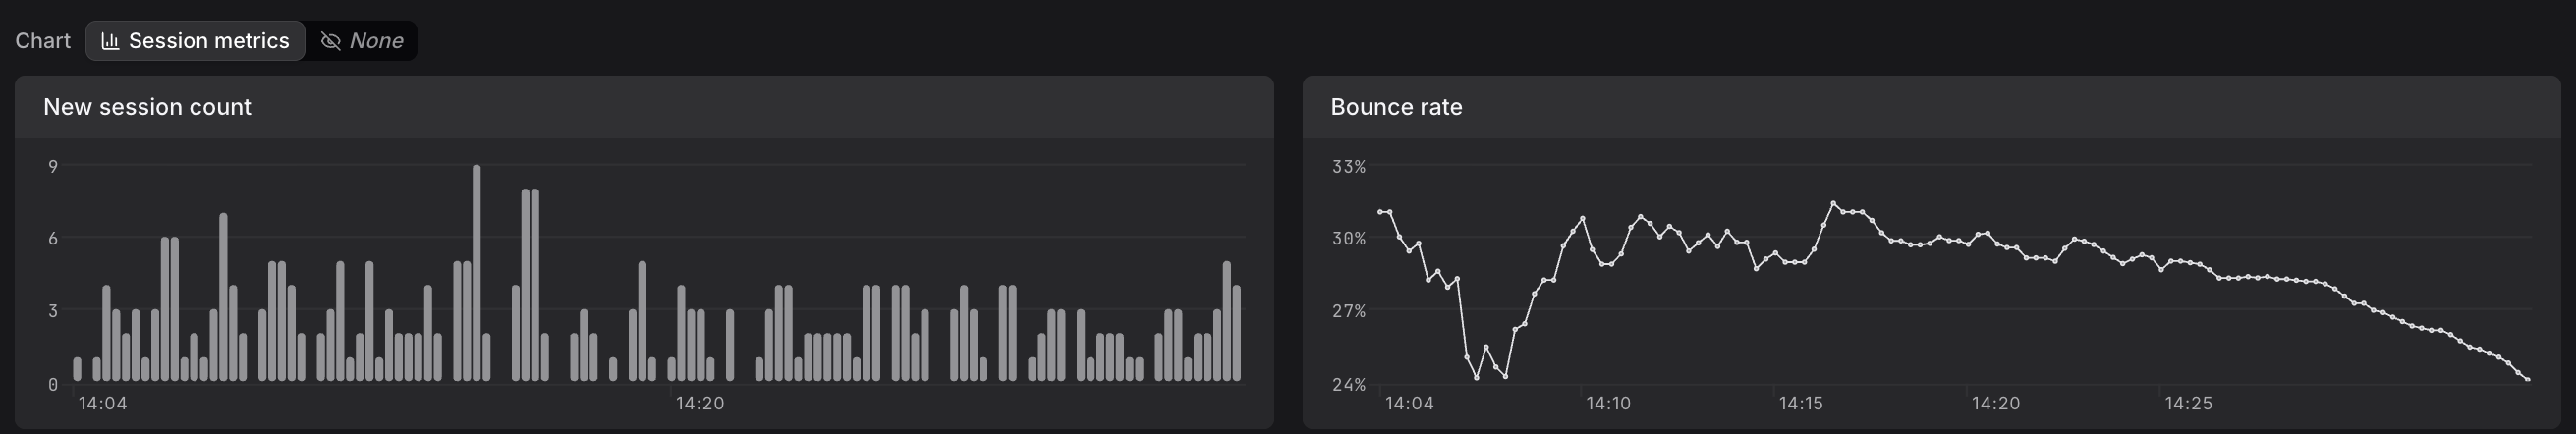
- New session count — a bar chart showing how many new sessions were started in each time bucket. Useful for detecting traffic patterns, deployment-driven spikes, or suspicious bot activity.
- Bounce rate — a line chart showing the percentage of sessions where the user left without a second interaction. A rising bounce rate after a deployment is an early signal that something may have broken on the landing page. Set an alert for this to be notified when it happens.
Switch the chart type using the Session metrics / None toggle to focus on the raw session count chart, the session metrics charts, or hide the charts entirely.
Use the Sessions List
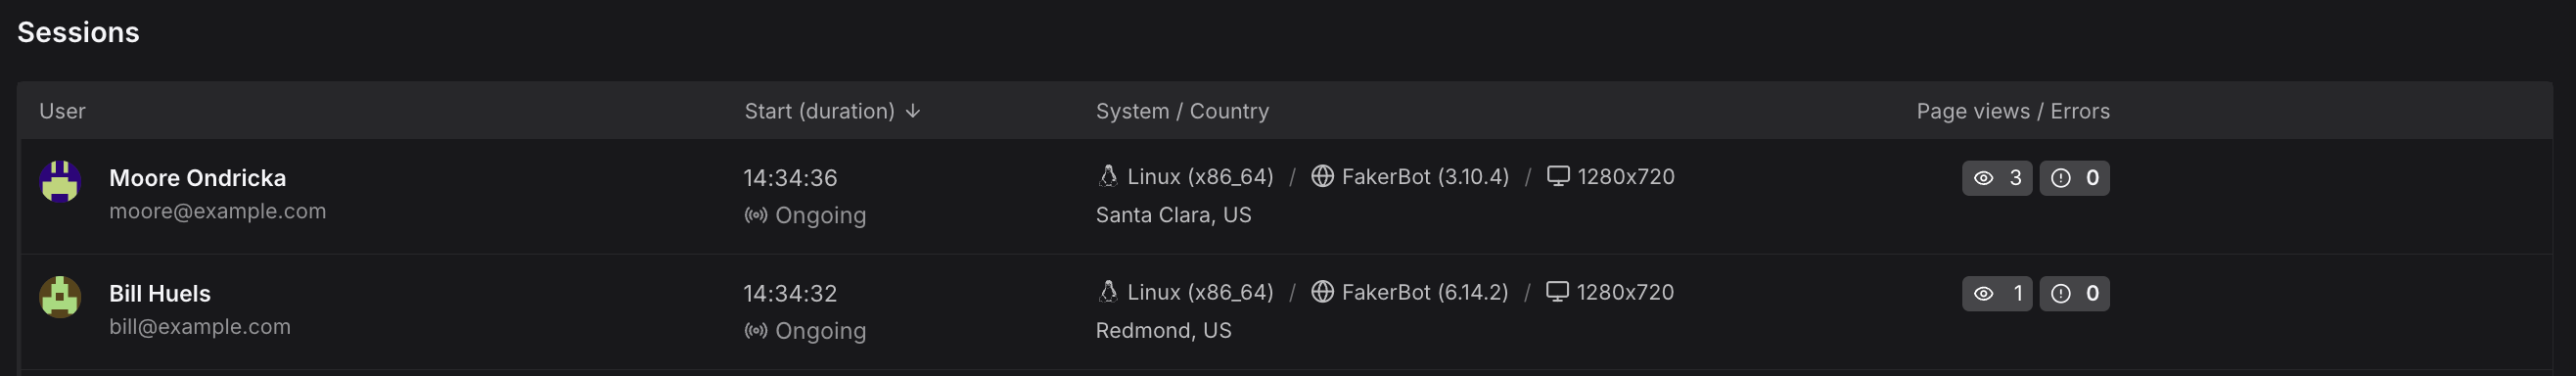
The sessions table lists individual sessions with the following columns.
| Column | Description |
|---|---|
| User | The identified user's name and email, or "No user details" for anonymous sessions |
| Start (duration) | When the session started and whether it is still ongoing or has ended |
| System | Operating system, browser name and version, and screen resolution |
| Country | The user's geographic location |
| Errors count | Number of unhandled JavaScript errors recorded during the session — highlighted in red if non-zero |
| Page view count | Total number of page loads and SPA navigations in the session |
Sessions with at least one error are marked with a red left border, making them immediately visible when scanning for problematic sessions.
Filter Sessions
Use the search bar (⌘F) to filter sessions by any attribute — such as page path, browser, country, deployment, or error state.
- Filters apply to the session list and summary charts, allowing you to narrow down to specific scenarios like sessions that visited a particular page, encountered errors, or came from a specific deployment.
- The session count updates immediately to show how many sessions match your filters (e.g. "Showing 32 of 361 sessions").
For a complete guide to filtering in the Websites Explorer, including available attributes and examples for different use cases, see Filter Sessions and Data.
Use the Session Detail Panel
Click any session row to open the session detail panel on the right. The panel shows the user's identity, a filtered list of events from the session, and a page flow timeline that includes cross-tab navigation tracking.
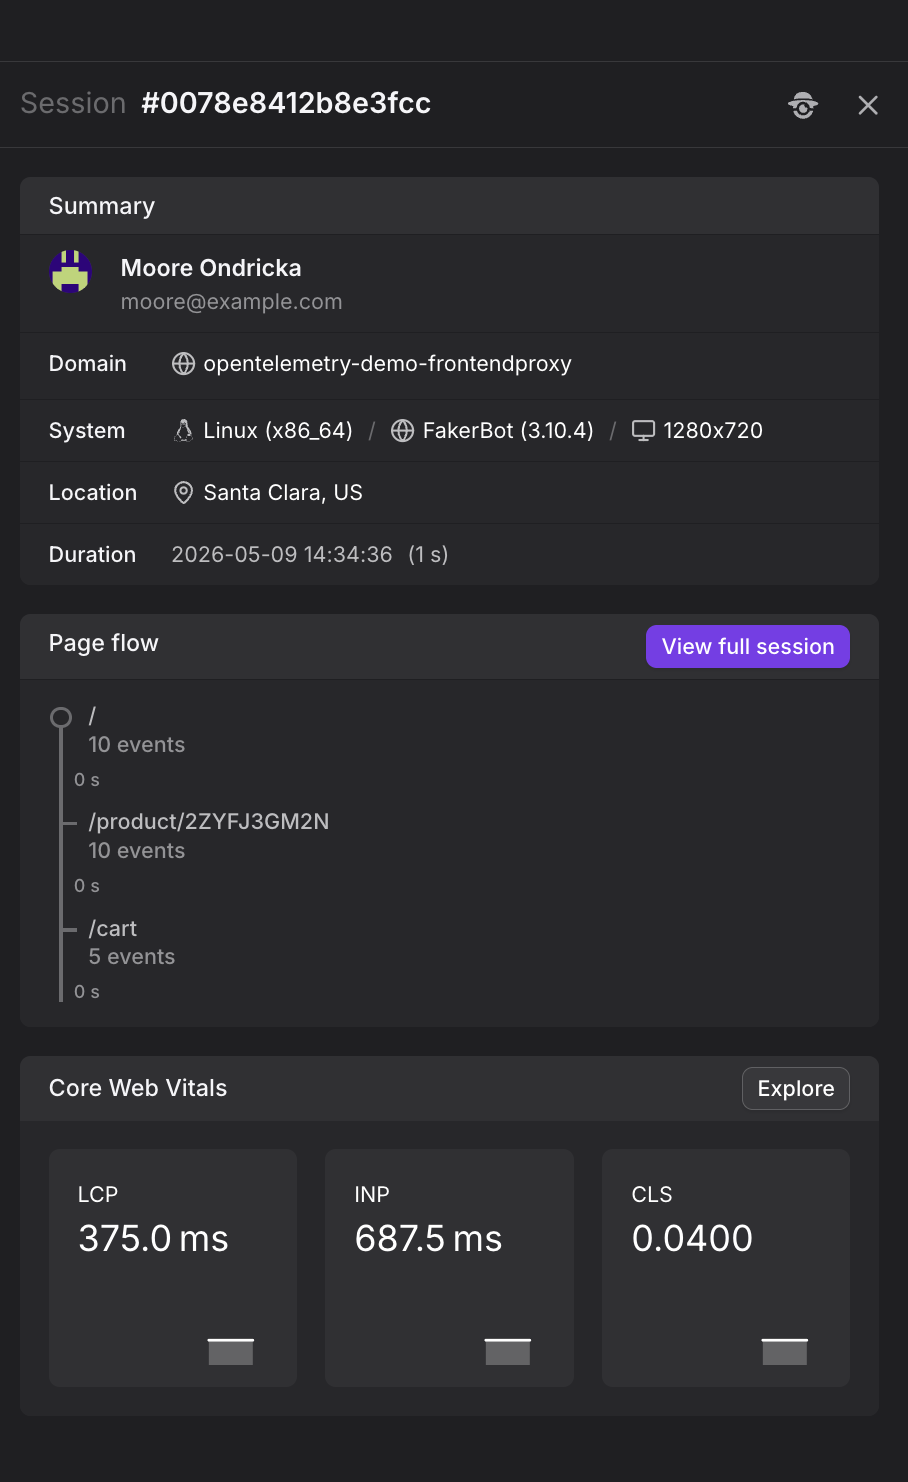
From the session detail panel, you can do the following:
- Click See all events to view the filtered event list in the Web Events explorer.
- Click View full session to see the complete chronological event timeline with frontend-to-backend trace correlation.
For details on what the session detail panel shows and how to use it, see View Session Details.
Further Reading
- Understand Sessions. How sessions are defined, tracked, and expired, including cross-tab tracking.
- Correlate Sessions with Backend Traces. Complete end-to-end debugging workflow from slow page load to backend root cause.
- Filter Sessions and Data. Complete guide to filtering sessions by page, browser, country, deployment, and error state.
- View Session Details. What the session detail panel shows, including summary, events list, and page flow timeline.
- Monitor Website Overview. High-level session metrics and bounce rate charts.