Last updated: June 22, 2026
View Event Details
The event detail sidebar provides complete information about a selected event, including user context, performance metrics, trace correlation, and raw telemetry data.
While the full session view shows the event timeline, the event detail sidebar displays the full payload, OpenTelemetry attributes, and additional context for a single event.
Access the event detail sidebar by clicking any event row in the full session view event table.
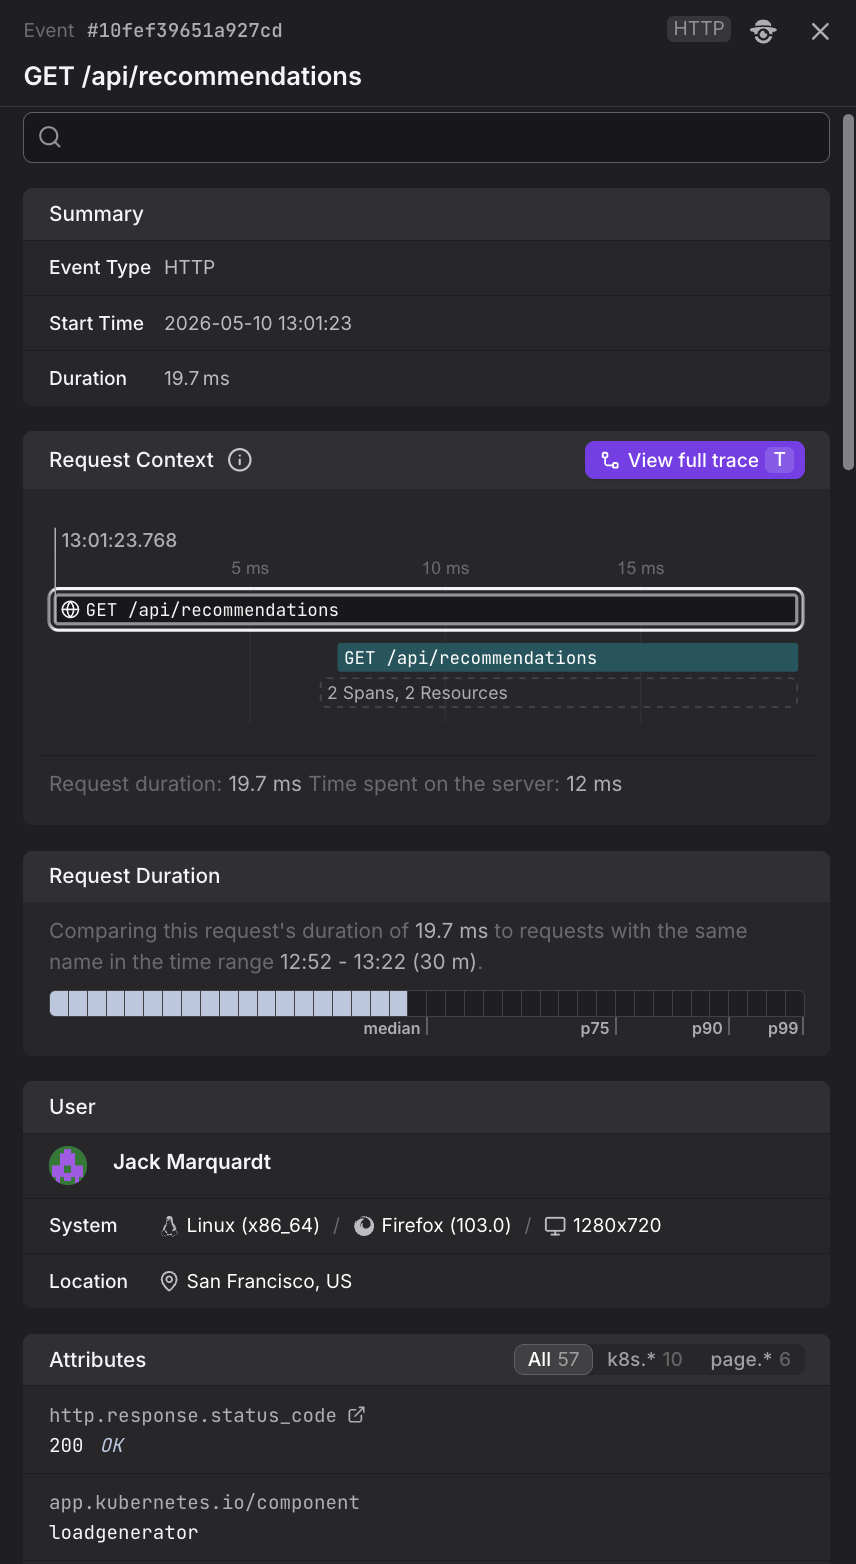
What the Event Detail Sidebar Shows
The event detail sidebar contains several sections:
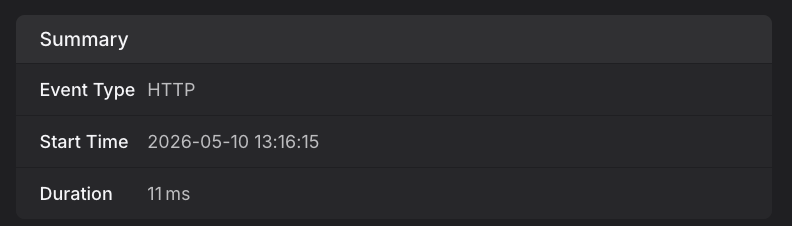
Summary
Shows the event type badge and the exact start time of the event.
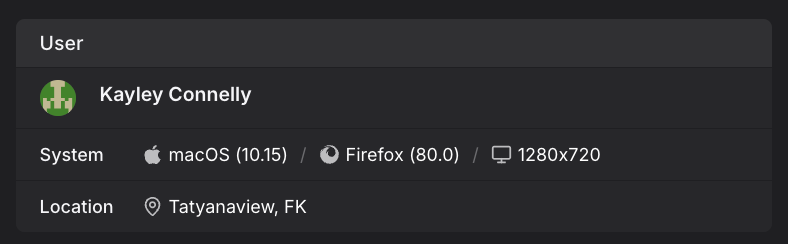
User
Displays information about the user who generated this event:
- Name and email — If the user was identified via the
identify()method. - Location — Geographic location (city, country) based on IP address.
- Browser — Browser name and version.
- Operating system — OS name and version.
- Screen resolution — The user's screen dimensions.
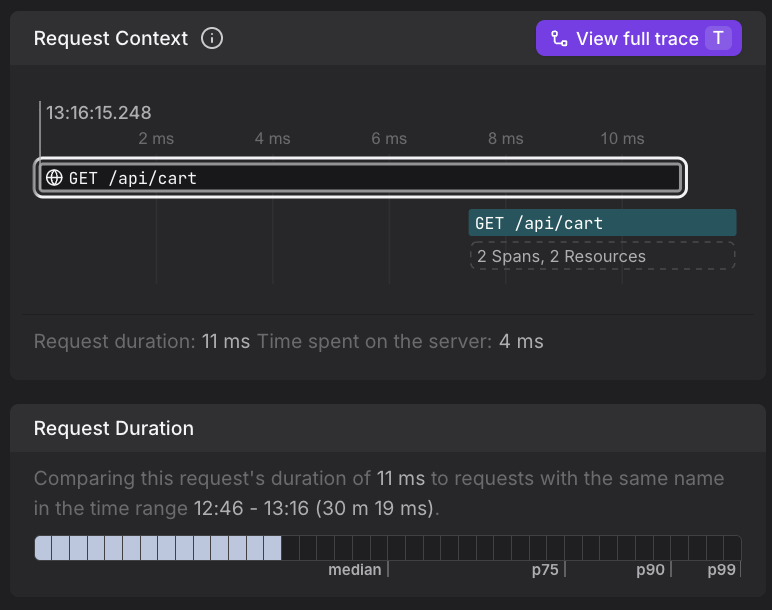
Request Duration
For browser.request events (HTTP requests), this section shows a comparison chart that visualizes how this specific request's duration compares to the p50, p75, p90, and p99 percentiles over the current time window.
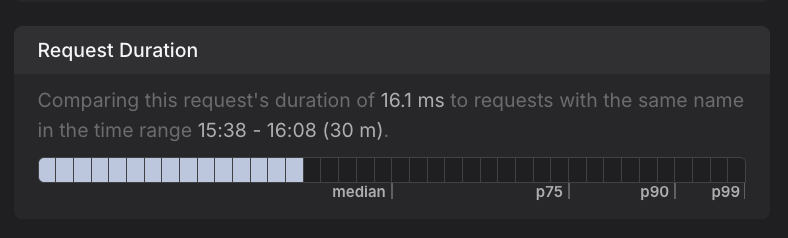
This helps you quickly identify whether a request was unusually slow compared to typical performance.
Trace Context
For browser.request events with trace correlation, this section displays:
- Trace tree — A visualization showing the parent and child spans related to this request.
- View full trace button — Opens the complete backend trace in the Trace Explorer, allowing you to see the full server-side execution path including database queries, downstream service calls, and any errors.
For details on how frontend requests are linked to backend traces, see Correlate Sessions with Backend Traces. To see what the full trace view shows, see View the Full Trace.
Body
Shows the raw event payload. For example, a web vital event displays {delta: 0, name: "CLS", value: 0}, while an HTTP request shows request and response details.
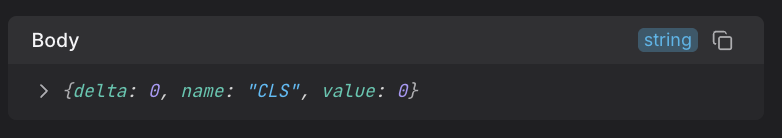
The delta field in web vital events shows the change in the metric value since the last update. For more information about how web vitals update during a session, see Understand Web Vitals.
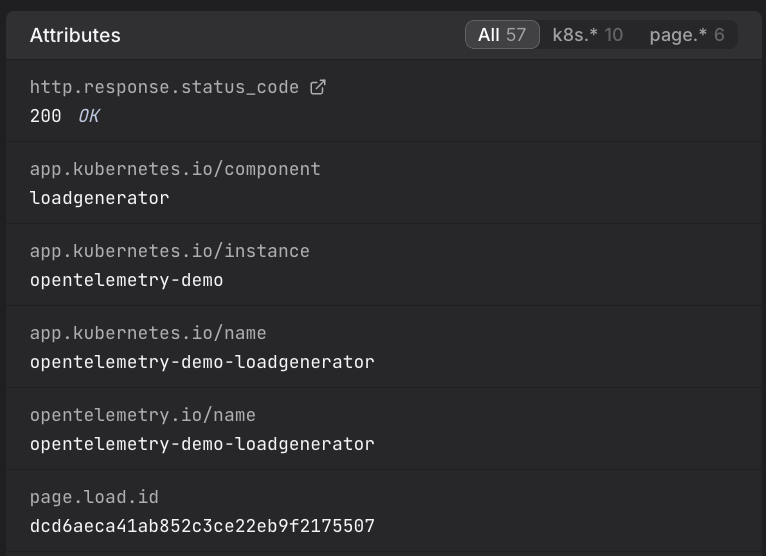
Attributes
Lists all OpenTelemetry attributes attached to the event. You can filter attributes by namespace (e.g., k8s.*, dash0.*, user_agent.*) to focus on specific categories of metadata.
Further Reading
- About Web Events. Underlying event stream and event types.
- Correlate Sessions with Backend Traces. Complete end-to-end debugging workflow using the event detail sidebar to investigate HTTP request performance.
- View the Full Trace. Backend trace visualizations accessible via the View full trace button.
- View the Full Session. Event-by-event session view where you click events to open this sidebar.