Last updated: June 22, 2026
View the Full Session
The full session view in Web Events provides a complete, chronological event-by-event view of a user session.
Unlike the curated session detail panel in the Sessions tab, the full session view shows every event that occurred during the session in raw detail.
Access the full session view by clicking View full session in the session detail panel.
What the Full Session View Shows
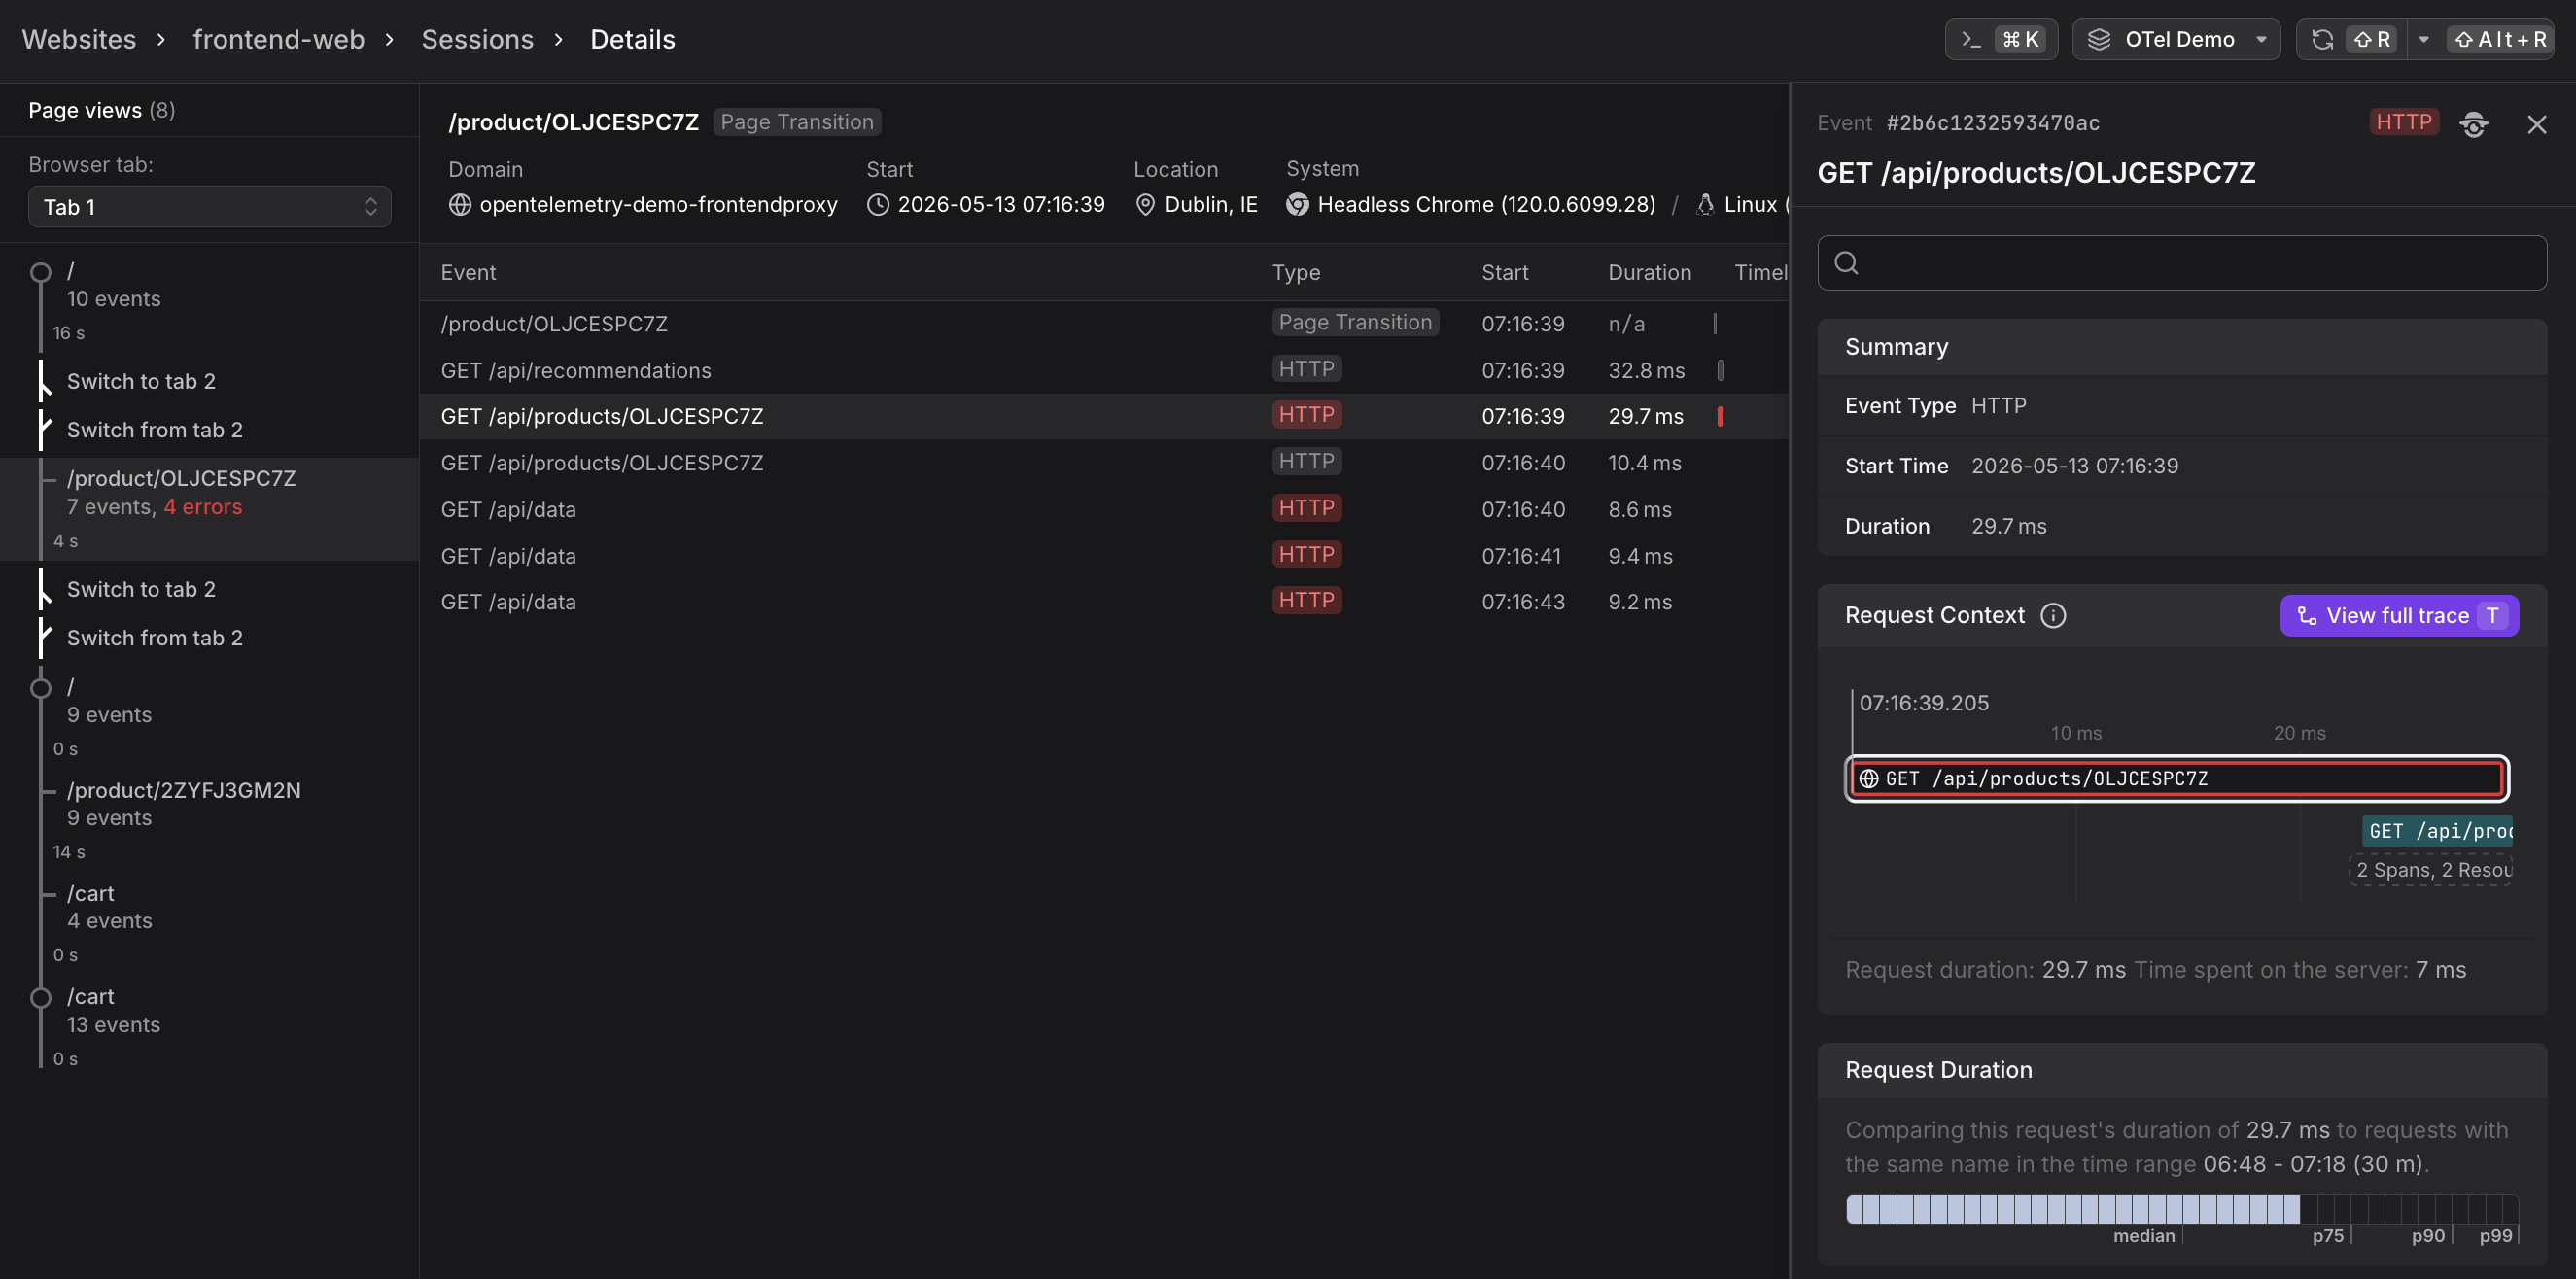
The full session view organizes events by page view, with three main areas:
Left Sidebar
Shows all page views in the session, grouped by browser tab. Each page view displays its URL path and event count. Click any page view to see its event timeline in the main area.
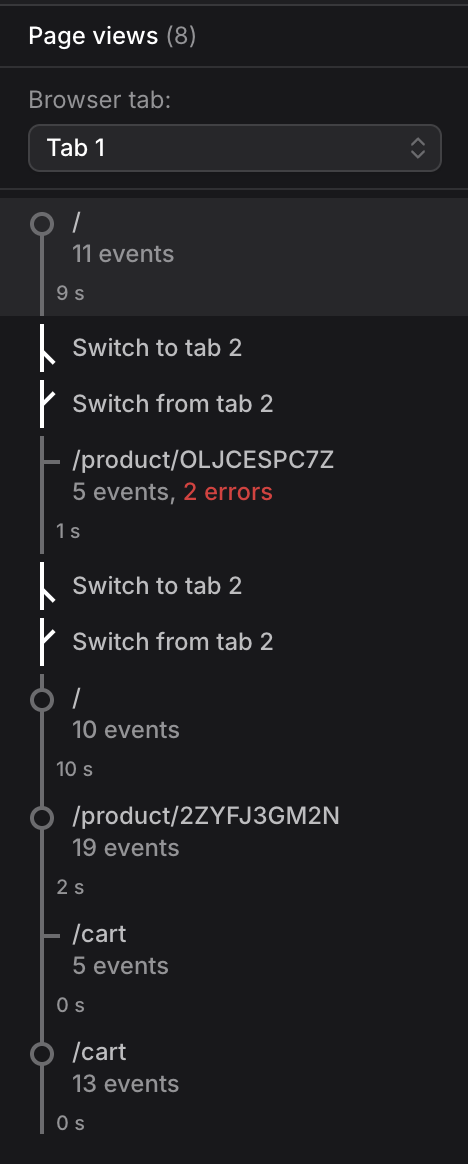
The left sidebar above shows cross-tab tracking in action. Notice the "Switch to tab 2" and "Switch from tab 2" entries — Dash0 automatically tracks when users switch between multiple browser tabs within the same session, preserving the complete user journey across tabs.
Page View Header
At the top of the main area, the header shows summary information for the selected page view.
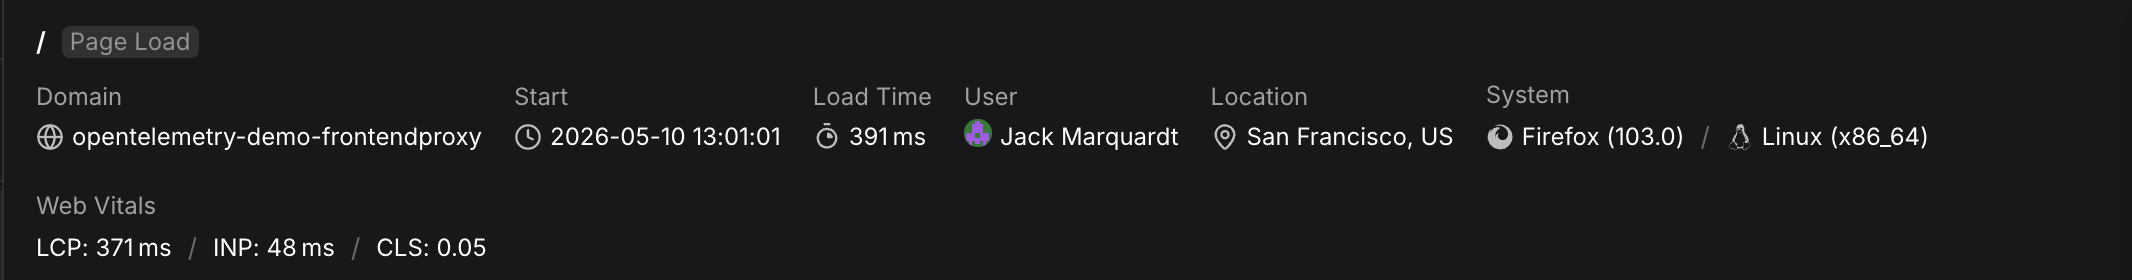
- Domain — The host serving the page.
- Start — When the page view began (date and time).
- Load Time — How long the page took to load.
- User — The user's name and email (if identified via
identify()). - Location — Geographic location (city, country).
- System — Browser name and version, operating system and version.
- Web Vitals — LCP, INP, and CLS scores measured for this page view.
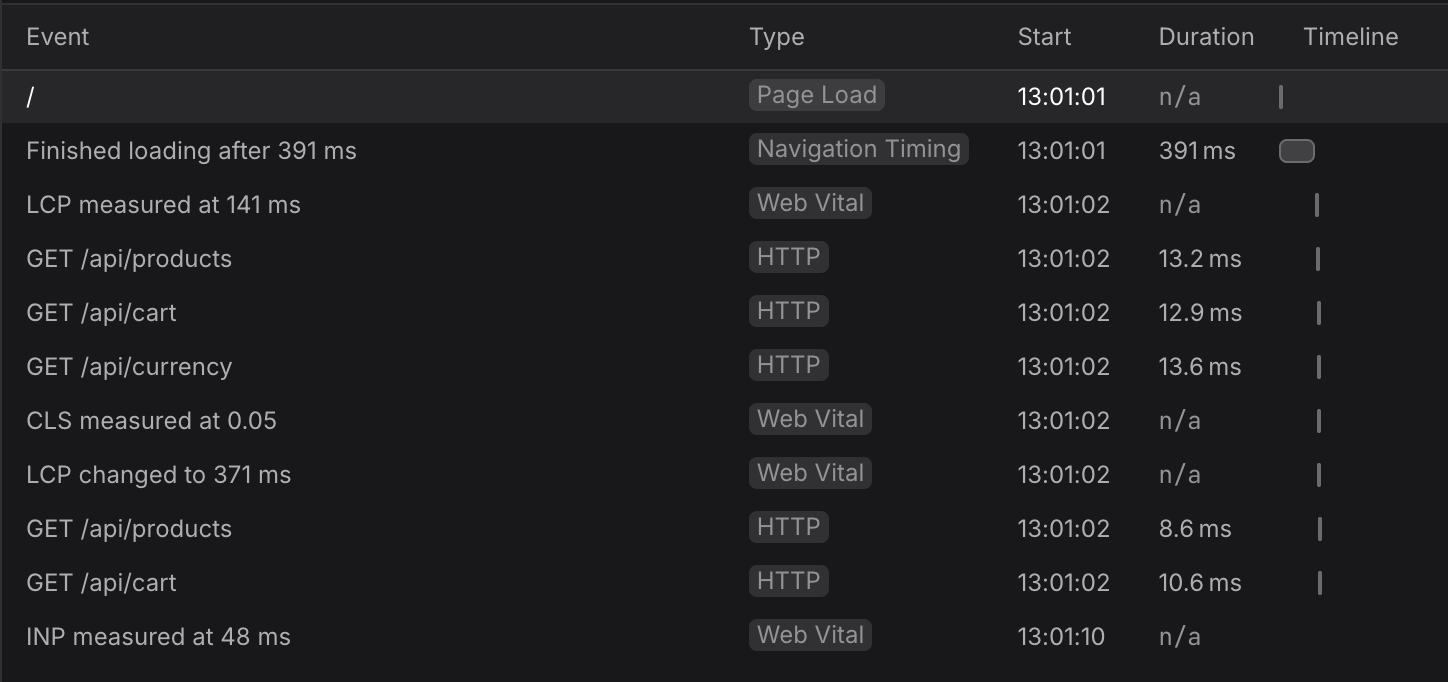
Event Table
Below the header, the event table shows every event that occurred during the page view. The table has five columns.
| Column | Description |
|---|---|
| Event | Human-readable event summary (e.g., "Finished loading after 435 ms", "LCP measured at 367 ms", "GET /api/products") |
| Type | Event type badge (see table below for all event types) |
| Start | Timestamp when the event occurred |
| Duration | How long the event took (n/a for instantaneous events like web vitals) |
| Timeline | Visual timeline bar showing when the event occurred and its duration relative to the page view |
The Type column in the event table above displays one of the following event types:
| Display Name | Event Type | Description |
|---|---|---|
| Page Load | browser.page_view | Initial page load or single-page navigation transition |
| Navigation Timing | browser.navigation_timing | Page load timing breakdown (DNS lookup, connection, server response, DOM processing) |
| HTTP | browser.request | Frontend-to-backend API calls with trace context linking to backend traces |
| Web Vital | browser.web_vital | Core Web Vitals (LCP, INP, CLS) measurements |
| Error | browser.error | JavaScript exceptions and promise rejections with source-mapped stack traces |
| Custom | Custom event types | Application-specific instrumented events with custom type names |
Click any event row to open the event detail sidebar on the right. The sidebar shows complete information about the event, including user context, performance metrics, trace correlation, and raw telemetry data. For details, see View Event Details.
Further Reading
- About Web Events. Underlying event stream that powers the full session view.
- Correlate Sessions with Backend Traces. Complete end-to-end debugging workflow showing how to use the full session view to identify slow HTTP requests.
- View Event Details. Event detail sidebar that appears when you click an event row.
- View Session Details. Session detail panel showing summary, matched events, page flow, and web vitals.
- Understand Sessions. How sessions are defined, tracked, and expired.