Last updated: June 19, 2026
Track HTTP Requests
The HTTP Requests built-in view filters the event stream to browser.request events — every HTTP call the frontend makes to a backend service.
This makes it possible to investigate frontend-perceived latency, catch failing API calls, and correlate slow backend responses with poor user experiences.
The chart shows request frequency over time. A sudden drop in request volume can indicate a deployment that broke navigation flows, while an unexpected spike may indicate a retry loop or an infinite polling bug in the frontend code.
Use the Events Table
Below the chart, the table lists individual web events in reverse chronological order.
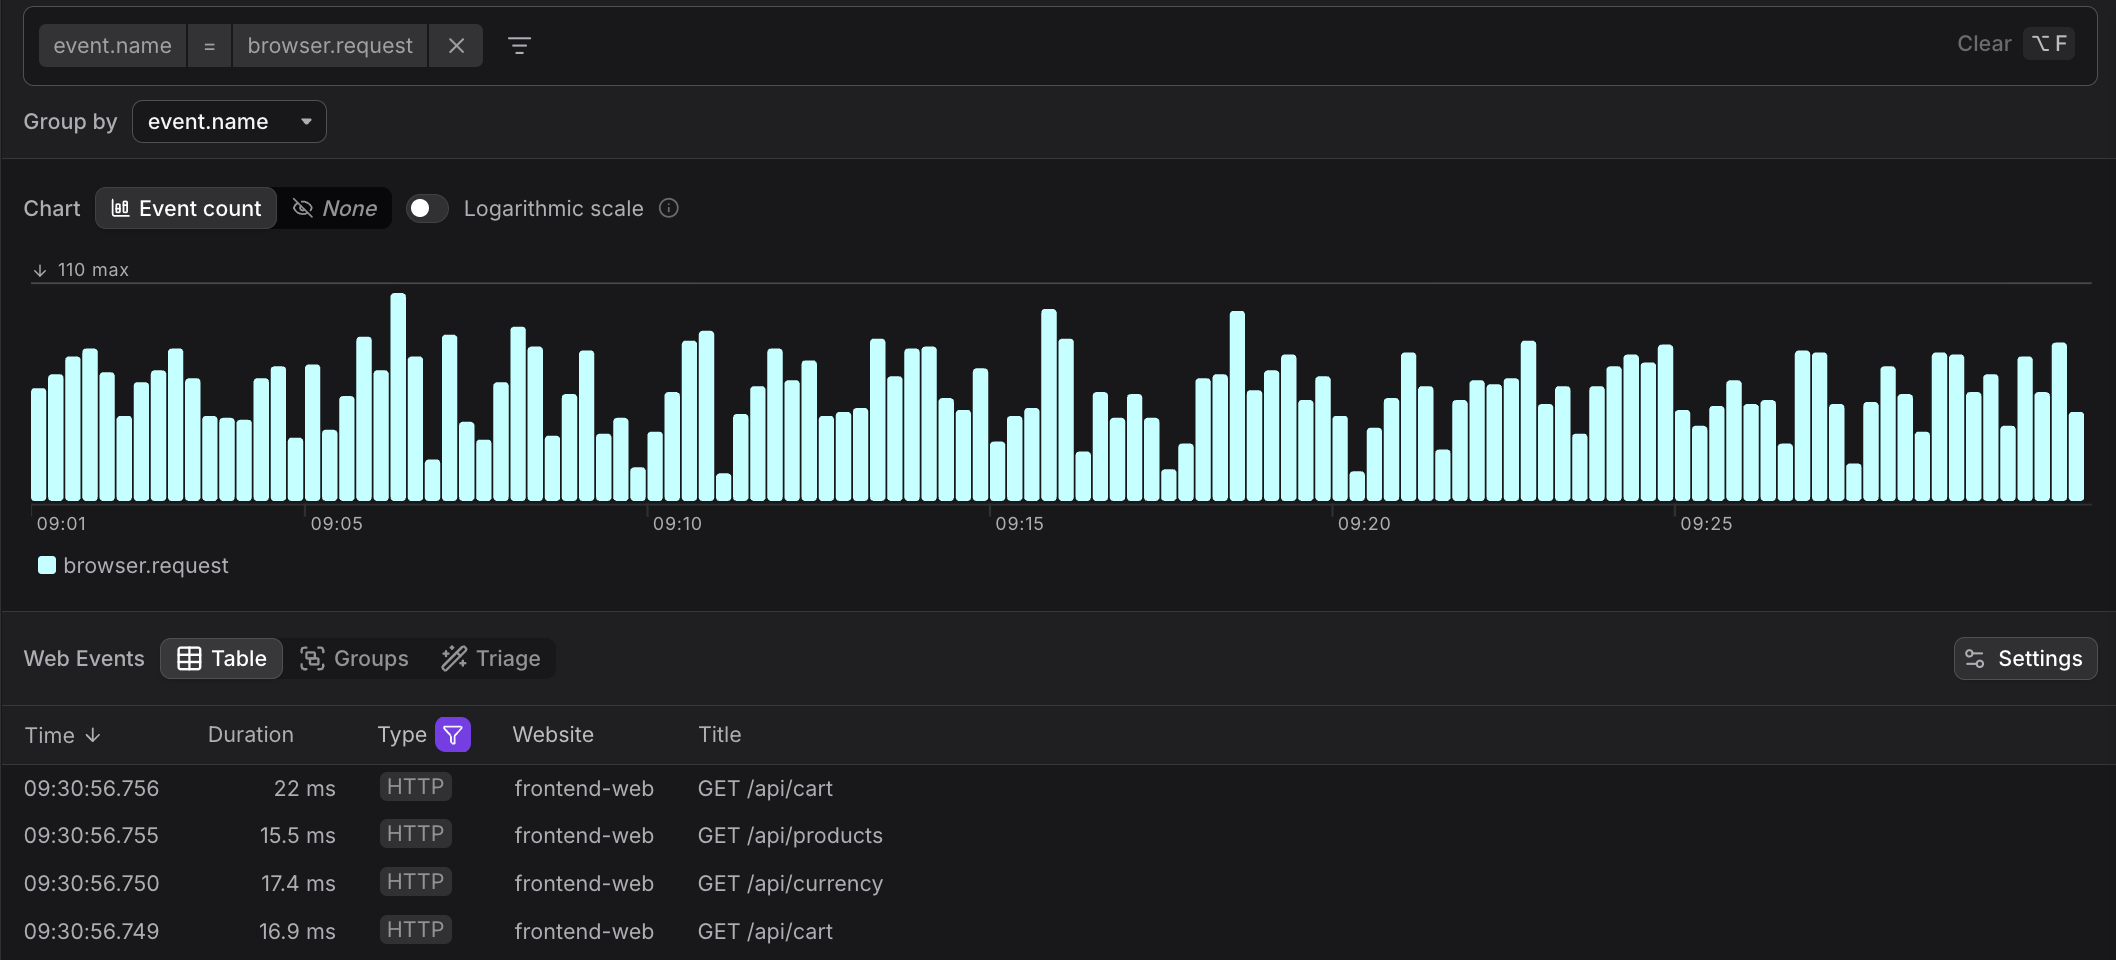
The HTTP Requests table includes columns most useful for diagnosing API issues:
| Column | Description |
|---|---|
| Time | When the request was initiated |
| Duration | Round-trip time as observed by the browser |
| Type | HTTP badge indicator |
| Website | Which instrumented site made the request |
| Title | Summary showing method and URL path (e.g. "GET /api/cart") |
Sort the table by Duration (descending) to surface the slowest frontend-perceived requests. A high duration on a 200 response indicates a slow backend — worth investigating via the linked trace. A low duration on a 4xx or 5xx response suggests a fast failure, often a misconfigured endpoint or a missing resource.
Rows with 4xx or 5xx status codes are highlighted so errors stand out immediately in the list.
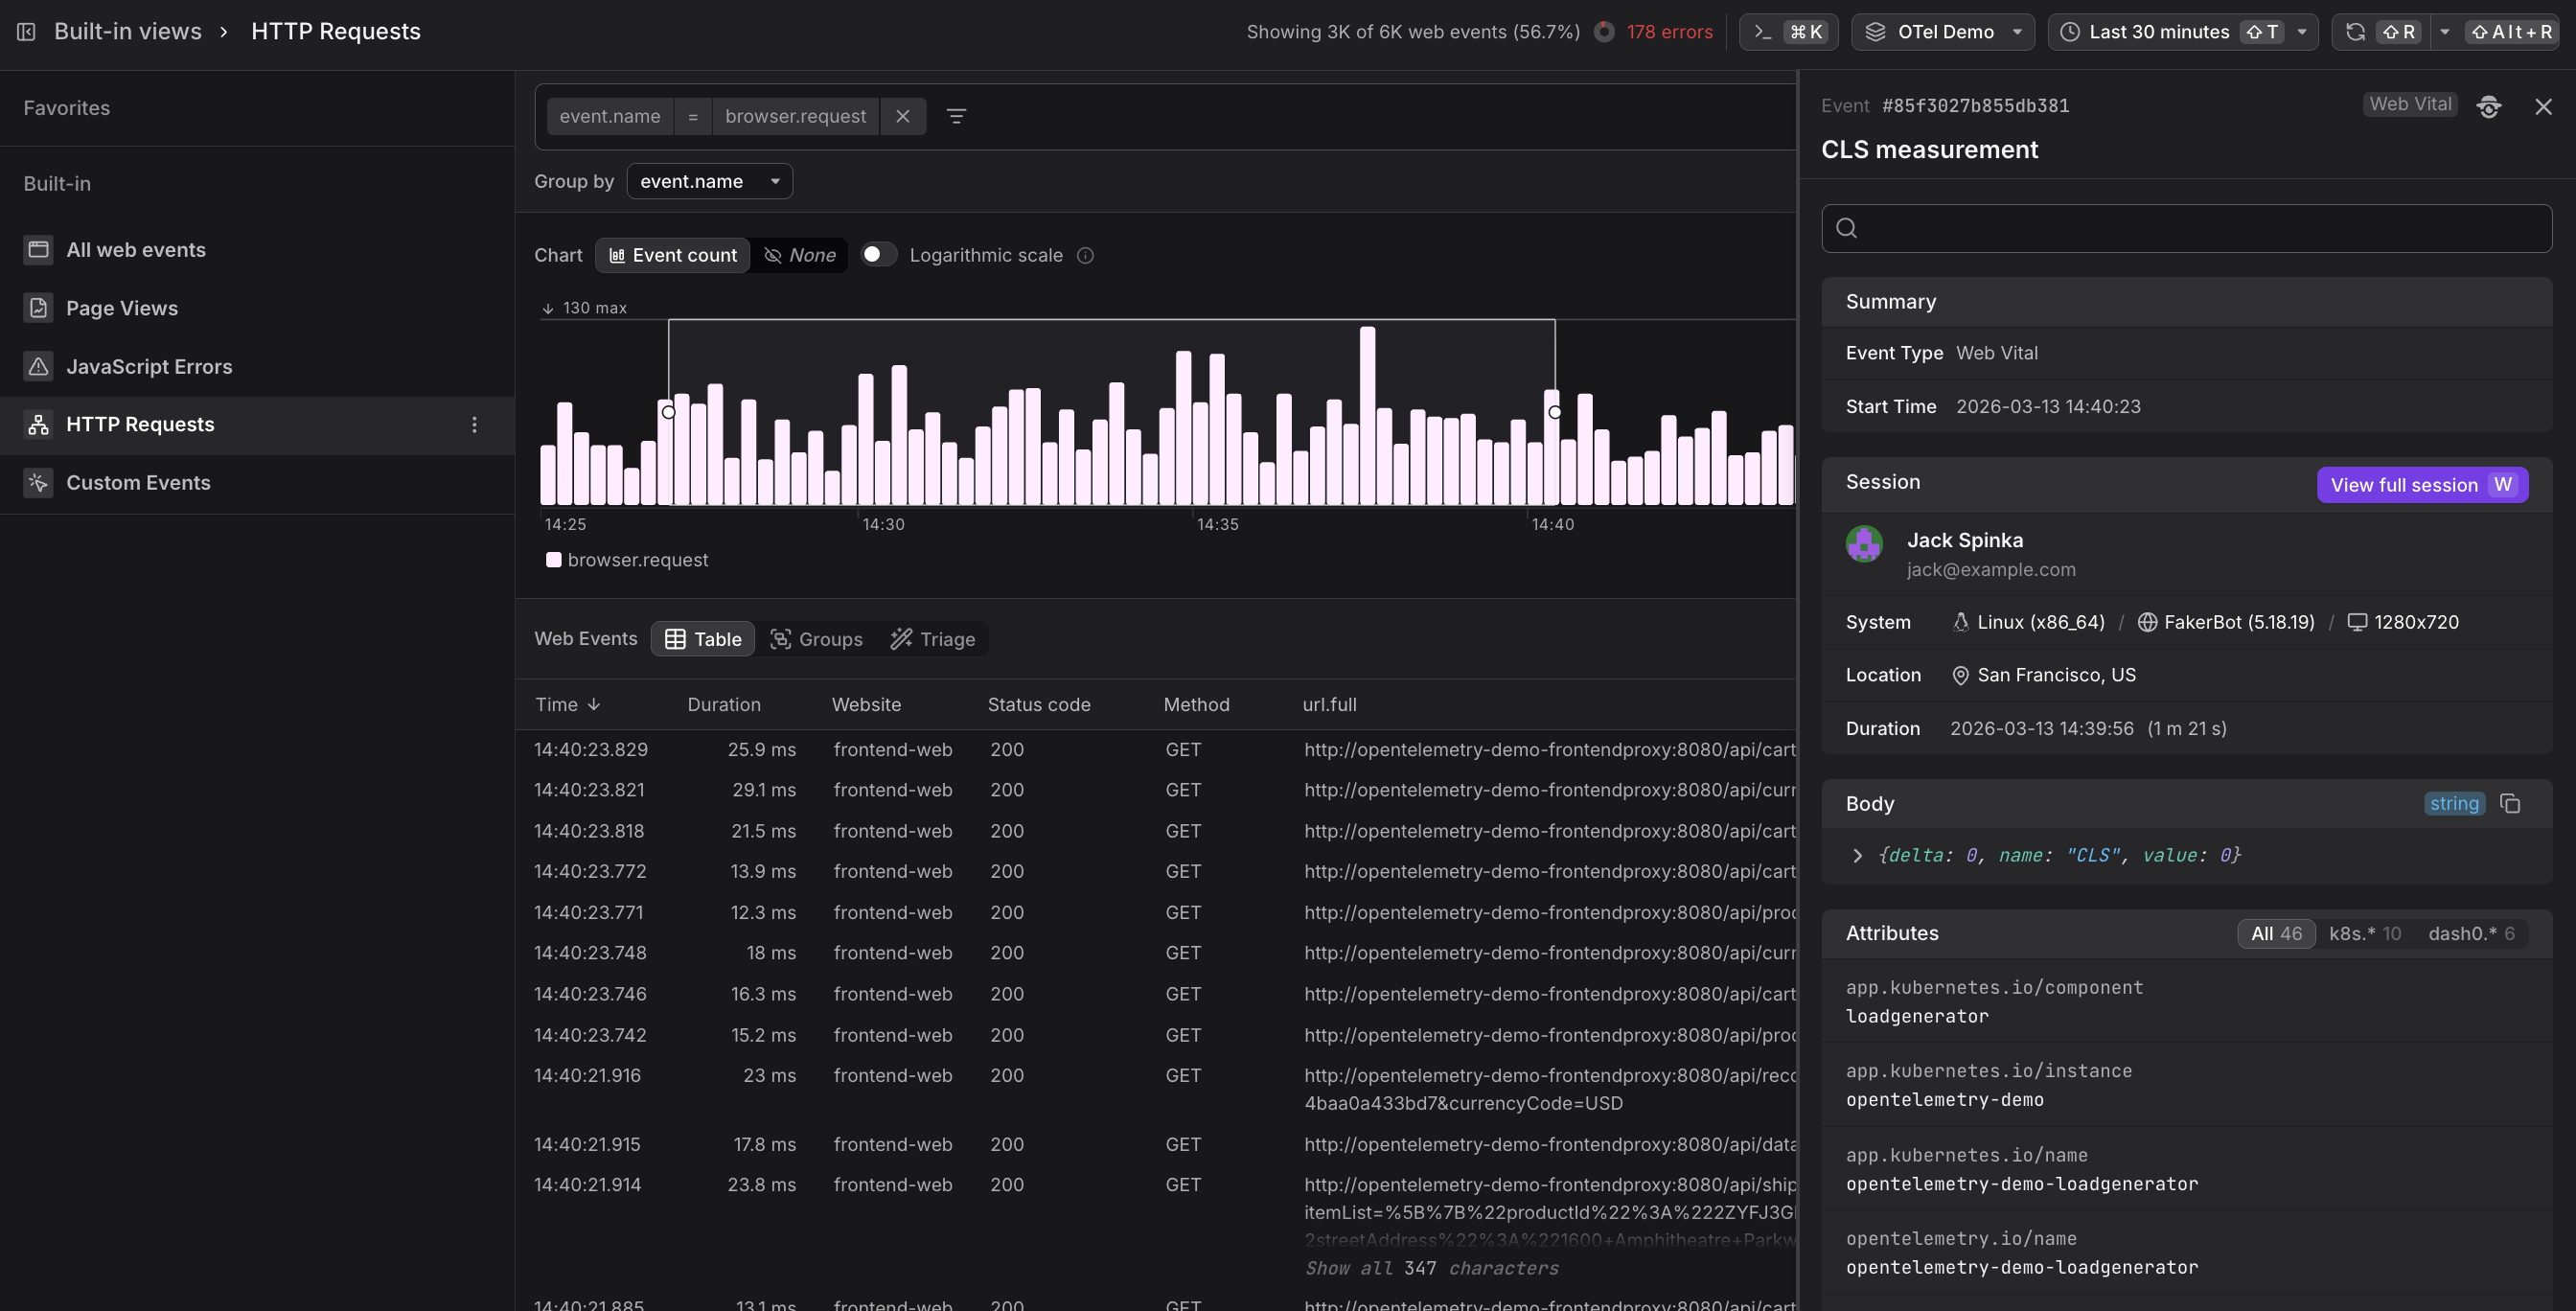
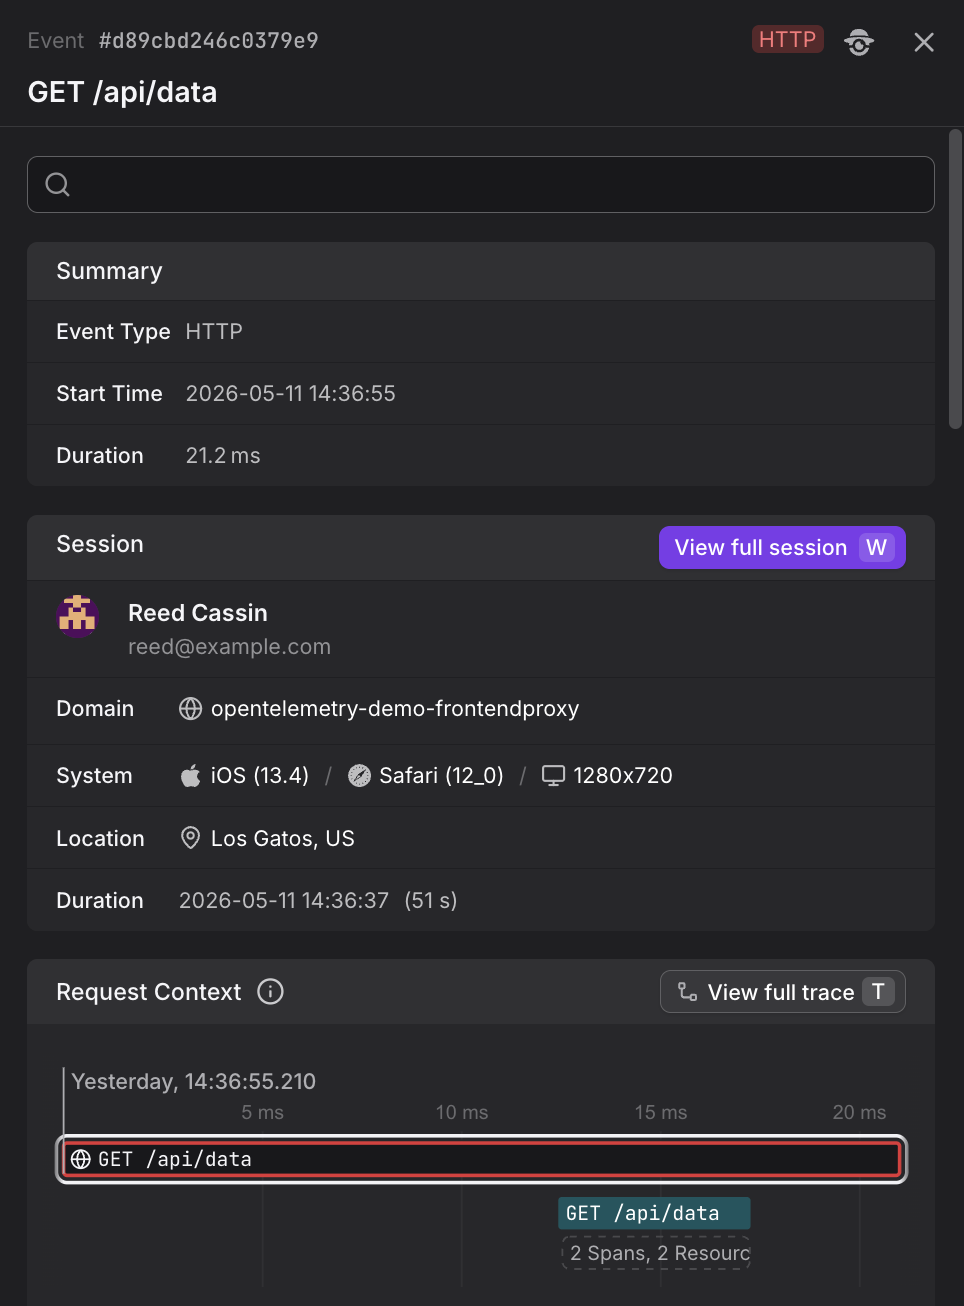
Use the Event Sidebar
Click any row to open the Event Sidebar showing the full request context.
If your backend is instrumented with Dash0 and OpenTelemetry, every browser.request event carries a trace context header that enables full-stack correlation.
In the Event Sidebar, you will find:
- Summary — event type, start time, and duration
- Session — the user's name and email, their operating system and browser, screen resolution, geographic location, and session duration
- Request Context — a waterfall view showing the timing breakdown of the HTTP request, with a View full trace button to jump to the backend trace
- Body — the raw event payload
- Attributes — all attached metadata including HTTP headers and custom attributes
Correlate Frontend Requests with Backend Traces
The trace context (traceparent header) is automatically propagated by the Web SDK whenever the frontend makes an HTTP request to an instrumented backend. This context links the browser.request event to the corresponding backend span, enabling bidirectional navigation:
- Frontend to Backend — from a
browser.requestevent in Web Events, click View full trace to see the full backend execution, including timing, logs, and errors. - Backend to Frontend — from a backend span in the Traces Explorer, follow the trace context back to the originating session, where you can see what the user was doing when the request was made, including page views, web vitals, and any frontend errors.
This correlation is one of the key benefits of using OpenTelemetry across your stack. When a user reports slow page loads, you can trace a single HTTP request from the browser event all the way through your backend services to identify the bottleneck — whether it's a slow database query, a third-party API call, or a frontend rendering issue.
For a complete end-to-end debugging workflow starting from a slow session, see Correlate Sessions with Backend Traces. That guide shows the full journey from identifying a problematic session, to opening the event detail sidebar, to using View full trace to investigate the backend root cause.
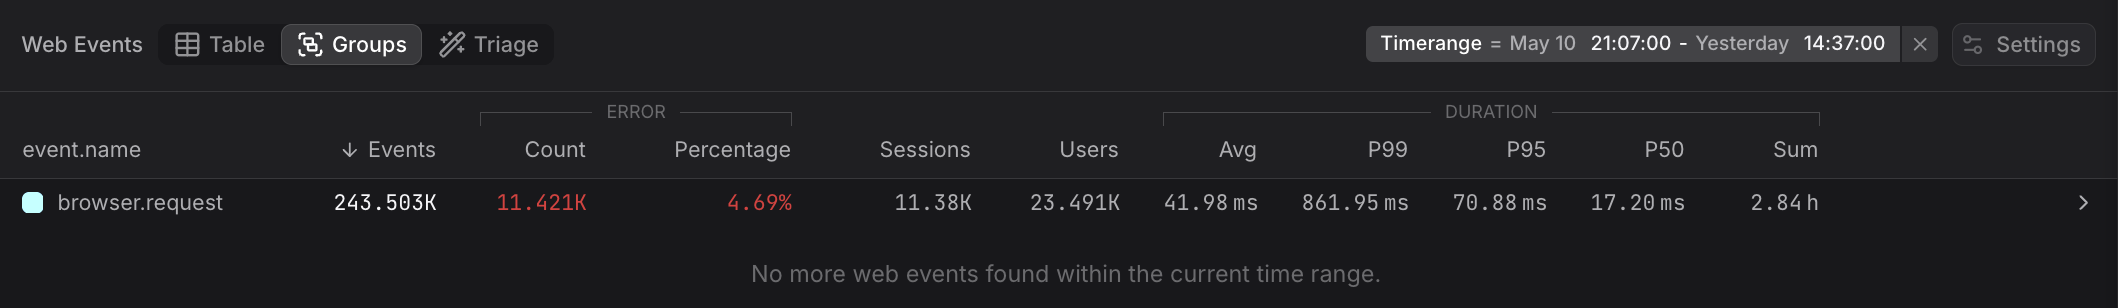
Use the Groups Tab
Switch to the Groups tab to aggregate HTTP requests by any attribute. Common groupings include url.path to identify the most frequently called endpoints, http.response.status_code to see the distribution of successful and failed requests, or http.request.method to compare GET versus POST traffic patterns.
The Groups view shows aggregate statistics including event count, error count, error percentage, sessions, users, and duration percentiles (average, P99, P95, P50).
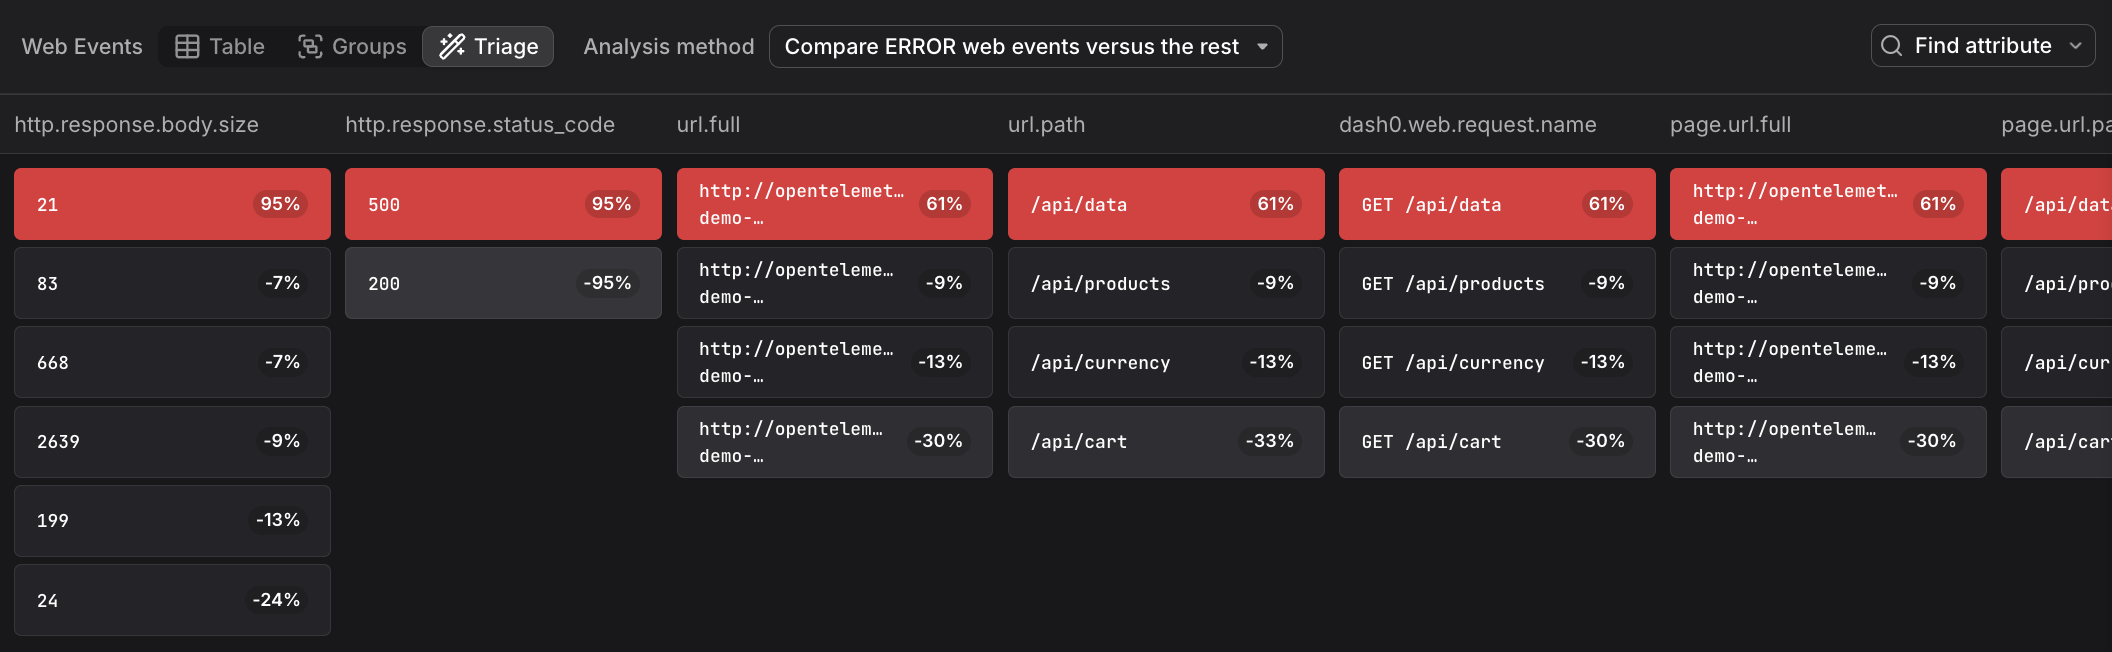
Use the Triage Tab
The Triage tab reveals which attributes correlate most strongly with errors or slow requests. This helps identify patterns such as which API endpoints, response status codes, or URL paths are associated with problematic requests.
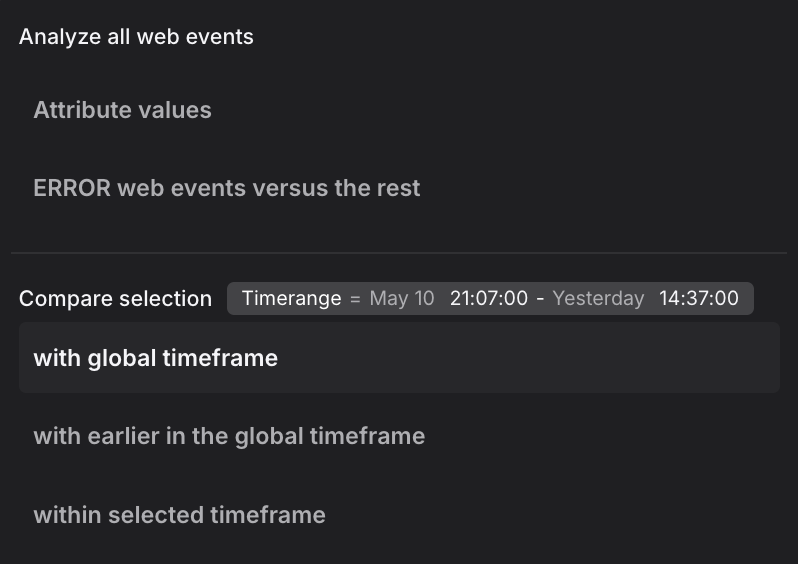
The triage view supports multiple analysis methods. The dropdown shows two analysis modes at the top, followed by comparison methods:
Analysis modes:
-
Attribute values: Displays the raw distribution of attribute values across all HTTP requests without correlation analysis. This mode shows how attributes are distributed in your request data, useful as a starting point before applying comparisons.
-
ERROR web events versus the rest: Compares failed requests (4xx and 5xx status codes) against successful requests (2xx status codes) within the selected time range. This mode helps identify which attributes are specifically associated with errors rather than successful operations, revealing which endpoints, user contexts, or network conditions correlate with API failures.
Comparison methods:
When you have a focused selection (a time range brushed in the chart), these methods compare your selection against different baselines:
-
with global timeframe: Compares the selected requests against all requests in the entire global time window. This baseline reveals which attributes are overrepresented in your selection relative to normal behavior across the full timeframe. Use this when investigating a latency spike or error cluster to understand what makes those requests different from typical traffic.
-
with earlier in the global timeframe: Compares the selected time range against the immediately preceding period of equal duration. The baseline is the time window that comes right before your selection, extending back to the start of the global timeframe. This mode is useful for identifying what changed between deployments or time periods, such as which endpoints, response codes, or user contexts shifted after a release.
-
within selected timeframe: Compares slower requests against faster ones within the selected time range. The selection includes requests above a duration threshold, and the baseline includes faster requests below that threshold, all within the same time window. This mode isolates performance bottlenecks, helping you identify which API endpoints, request methods, or backend services correlate with slow versus fast response times.
Further Reading
- About Web Events. Overview of the Web Events Explorer and how the HTTP Requests built-in view fits into the broader web events experience.
- Investigate Sessions. Shows how HTTP requests appear in the session detail panel with network timing breakdown and the View full trace button for backend correlation.
- Understand Web Event Types. Details on the structure of
browser.requestevents including HTTP status codes, duration, and trace correlation context. - Explore All Web Events. Shows how to browse all event types including HTTP requests, and how request volume appears in the event count chart.
- Filter and Group Web Events. Covers filtering techniques for narrowing requests by status code, URL path, or HTTP method.