Last updated: June 19, 2026
About Web Events
Web events are telemetry signals emitted from a web application's frontend that capture user interactions, page lifecycle activity, performance metrics, and runtime behavior occurring in the browser. They are collected by the Dash0 Web SDK, which is Dash0's OpenTelemetry-compatible instrumentation library running in the browser.
The Web Events Explorer lets you browse, filter, and investigate each web event emitted by the Dash0 Web SDK across all your instrumented websites — and is the raw data layer underlying the higher-level experience in Website Monitoring.
In Dash0, the Web Events Explorer and the Websites Explorer relate to each other the same way that the Tracing section and the Services section do. The Websites section provides an opinionated, curated experience built on top of Web Events data — with session timelines, web vital summaries, and top-page breakdowns. The Web Events section gives you direct access to the underlying event stream so you can build custom analysis, investigate anomalies, and correlate across the full stack.
It is organized into the following areas:
Global Controls
- Filter — narrows the event stream shown across all views. More here...
- Command Menu — provides quick access to common actions and navigation. More here...
- Time Picker — sets the time range for all views. More here...
Event Visualizations
- Event Count Chart — a time-series bar chart showing event volume over the selected window, color-coded by event type (e.g.
browser.error,browser.web_vital,product_added_to_cart). Makes it easy to spot spikes in errors or drops in traffic at a glance.
Built-in Views
- All web events — the complete, unfiltered event stream across all websites and event types. More here...
- Page Views — filtered to
browser.page_viewevents, distinguishing full page loads from single-page transitions. More here... - JavaScript Errors — filtered to
browser.errorevents, surfacing unhandled exceptions and promise rejections. More here... - HTTP Requests — filtered to
browser.requestevents, showing every frontend-to-backend HTTP call with status codes and durations. More here... - Custom Events — filtered to non-
browser.*events, showing application-specific actions you have instrumented manually. More here...
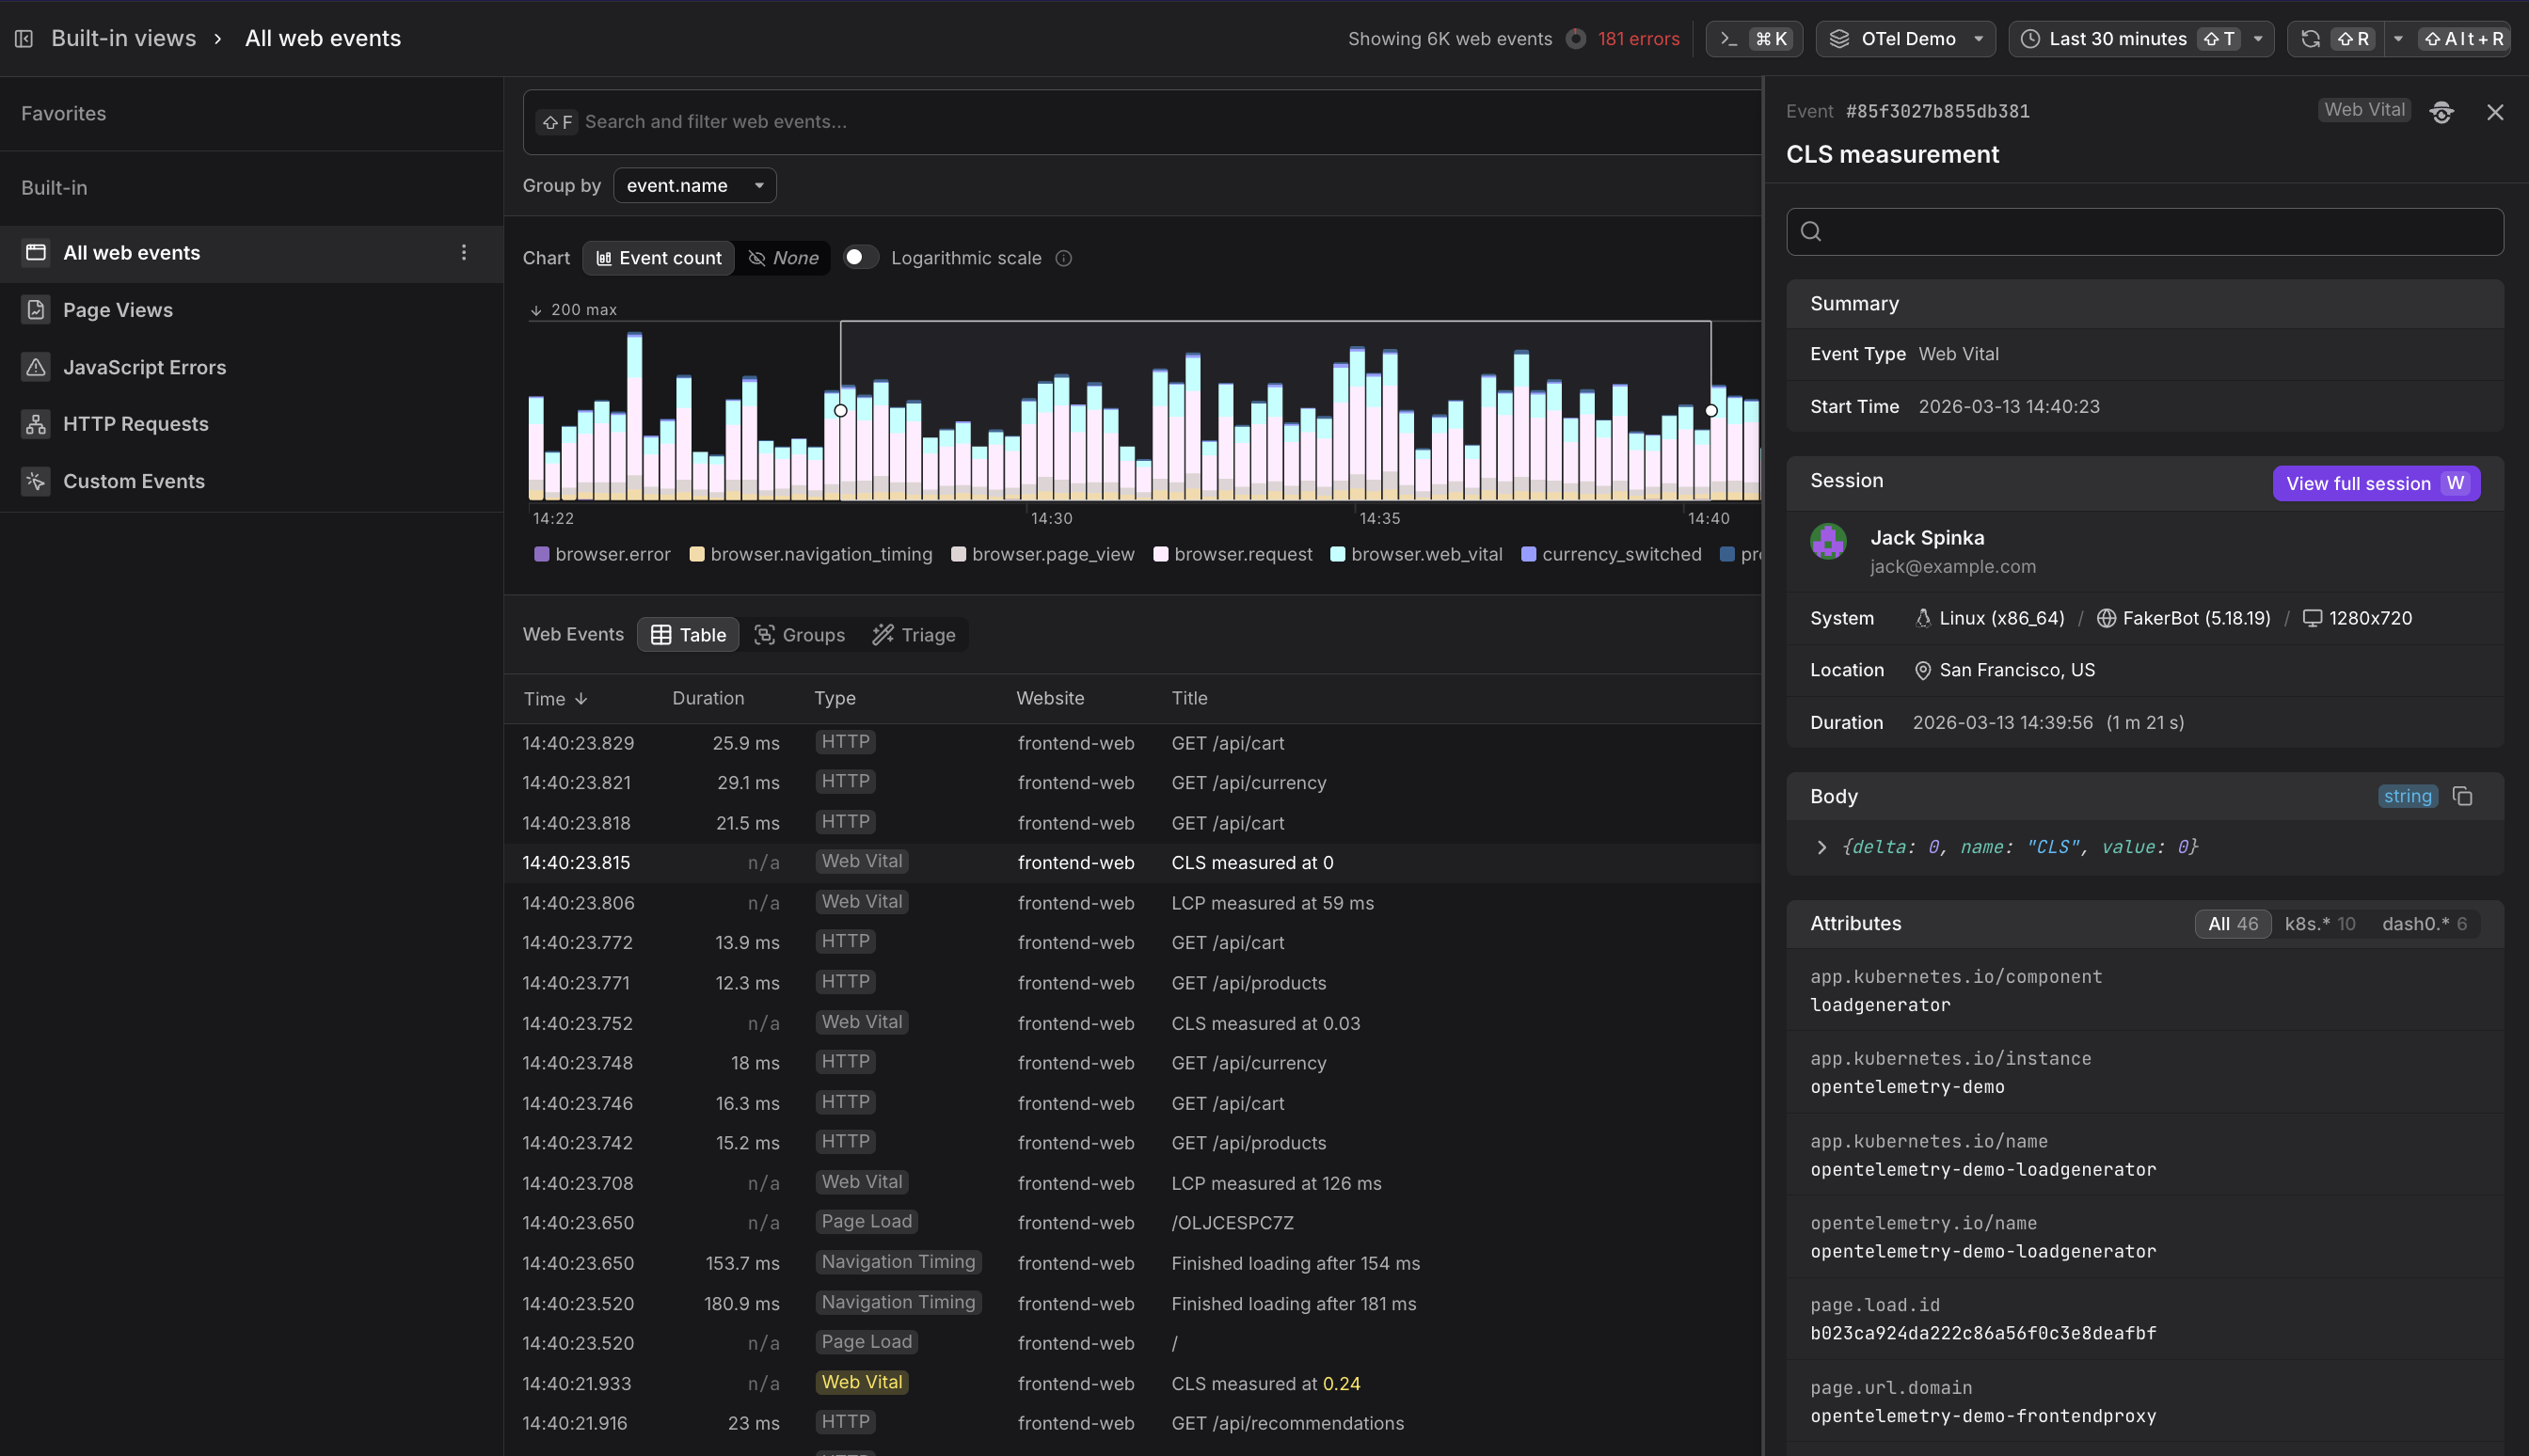
Event Detail Panel
- Event Sidebar — a context-sensitive detail panel that opens when an event row is selected, surfacing the event type, exact timestamp, raw body payload, all attributes, and the session context of the user who triggered the event — including a direct link to the full session replay in Websites.
From Events to Dashboards, Check Rules, and Agent0
Once you have the view you want, use the buttons at the top of the Web Events Explorer, for the following.
![]()
- Click Add to dashboard to add the current query as a panel to a new or existing dashboard.
- Click Create check rule to open the check rule editor with this query pre-filled as the rule expression.
- Click Analyze with Agent0 to analyze the events, within the selected time range, with Agent0.
Control Costs with Spam Filters
Web Events can generate significant telemetry volume, especially for high-traffic websites. Use spam filters to drop low-value events at ingestion time and reduce storage costs.
For full context on cost control including monthly budgets, cost forecasting, and quotas, see About Billing & Cost Control.
Common use cases for spam filtering web events include:
- Bot traffic — filter out events from known bots or scrapers that don't represent real user behavior.
- Health check requests — drop
browser.requestevents for monitoring endpoints that generate high volume but provide little diagnostic value. - Development environments — exclude events from non-production websites to focus your observability budget on production traffic.
- Low-value paths — filter out page views or requests for specific URL patterns that don't require monitoring, such as static asset requests or internal admin pages.
To create a spam filter for web events:
- Navigate to the Web Events Explorer and define filter criteria that match the events you want to exclude (e.g.,
url.path = /healthoruser_agent.name = GoogleBot). - Click the Spam button in the toolbar.
- Review the filter definition and click Flag as spam to activate it.
Once active, matching events will be dropped at ingestion and will not count toward your storage costs or dataset quotas.
Data dropped by spam filters cannot be recovered. Test your filter criteria carefully before activating a spam filter, especially in production datasets.
Further Reading
-
Explore All Web Events. Explains how to read the event count chart, browse the event table, open the event detail panel, and navigate from a raw event into the full session replay.
-
Use Custom Events. Describes how to instrument custom events in your application code, what use cases they unlock (feature adoption tracking, funnel analysis, alerting on business metrics), and how to combine them with technical telemetry.
-
Understand Web Event Types. Covers the full schema for each built-in event type — including body payload format, key attributes, and how
browser.web_vitalvalues evolve over the course of a session. -
Filter and Group Web Events. Covers the filter syntax, Group by controls, table view modes (Table, Groups, Triage), and how to save custom views as Favorites.
-
About Website Monitoring. Overview of the Websites Explorer that provides a curated, high-level view built on top of web events data.