Last updated: June 19, 2026
Understand Web Vitals
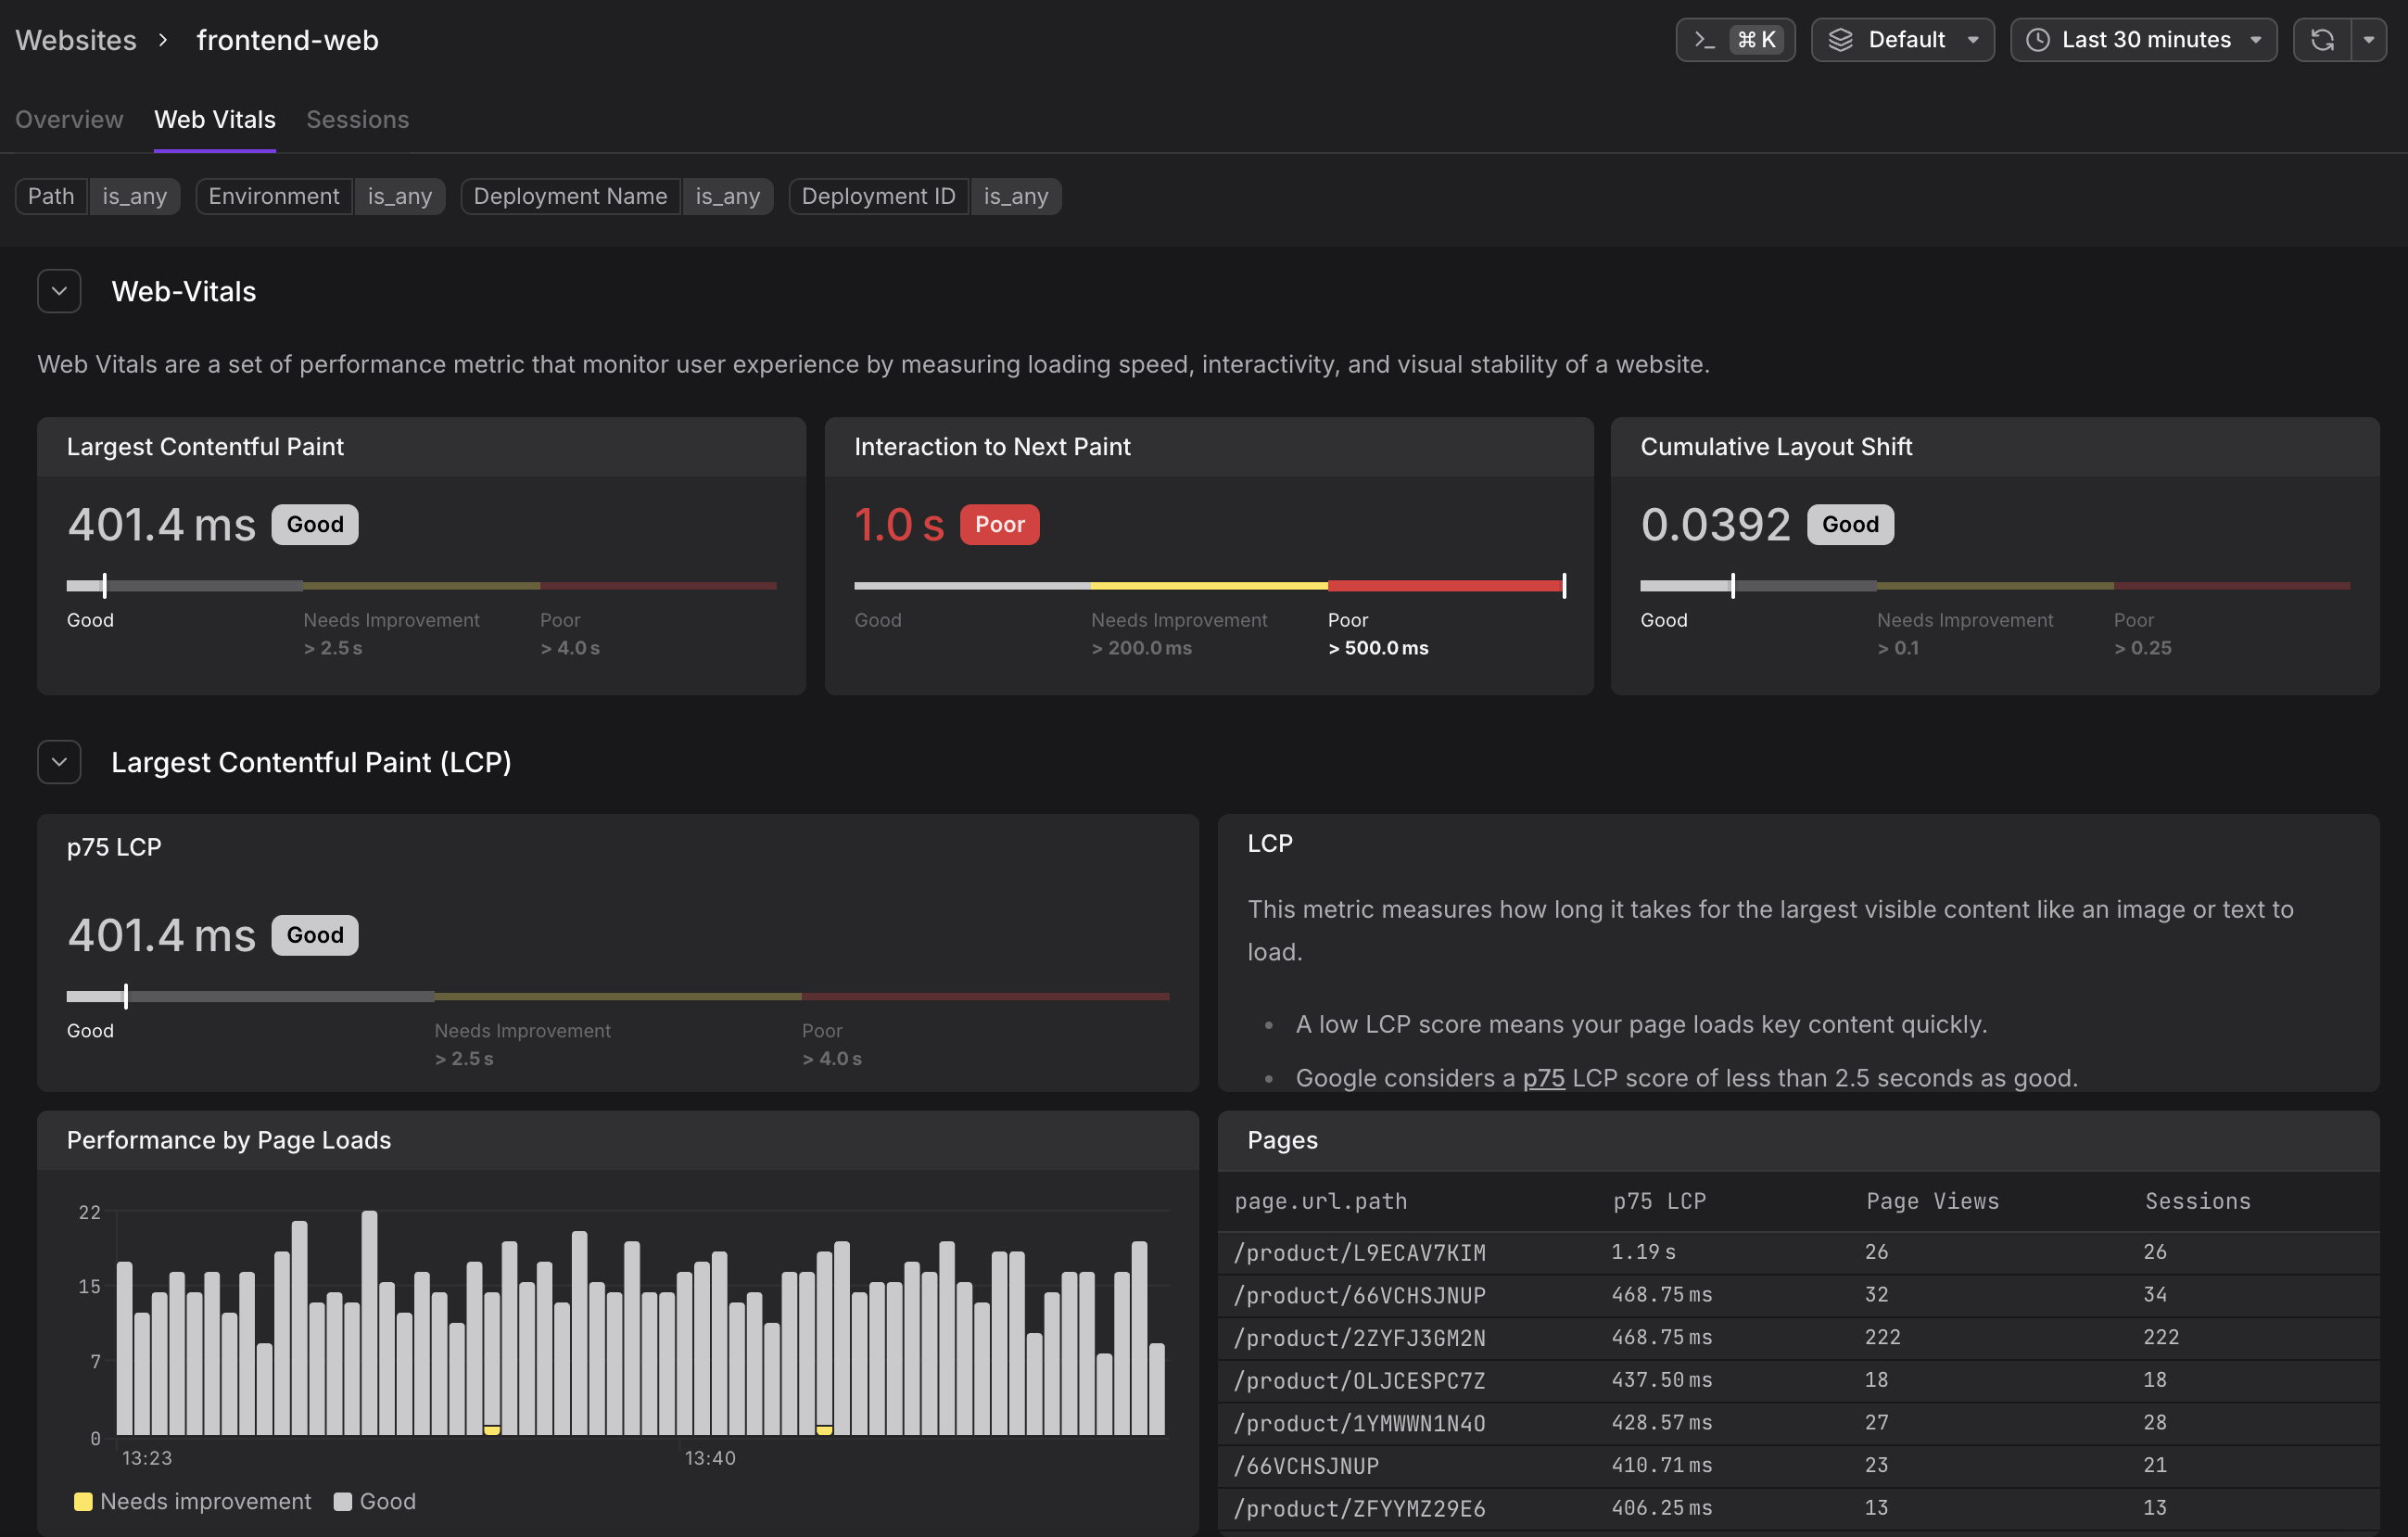
Web Vitals are a set of performance metrics defined by Google that quantify the real-user experience of a webpage — covering loading speed, interactivity, and visual stability. Dash0 surfaces these metrics in the Websites section using the same thresholds and labels that Google applies in its own tools and search ranking algorithms.
Website monitoring in Dash0 surfaces three Google-defined performance metrics at the p75 percentile — meaning 75% of real user experiences are at or below the displayed value:
- LCP — Largest Contentful Paint — measures how long it takes for the largest visible element (image or text block) to fully render.
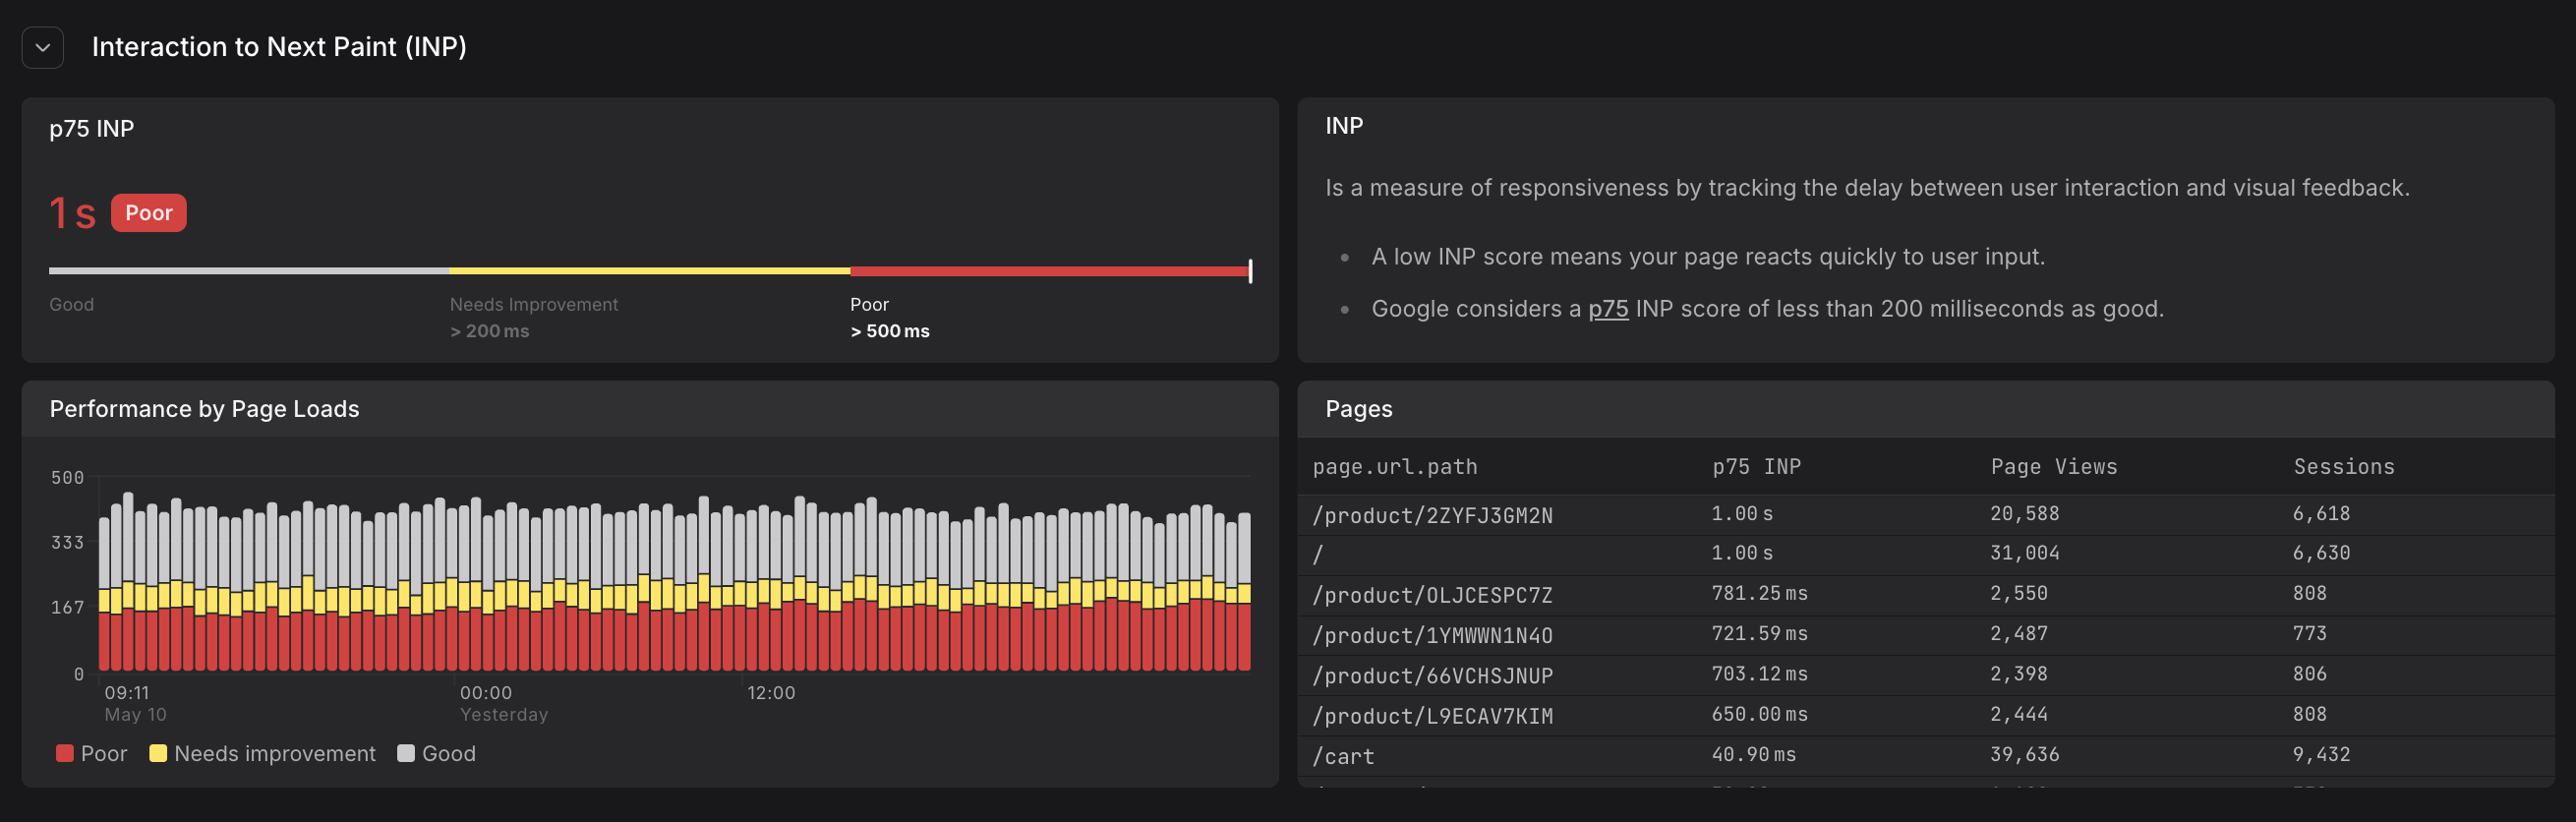
- INP — Interaction to Next Paint — measures how quickly the page responds to user input.
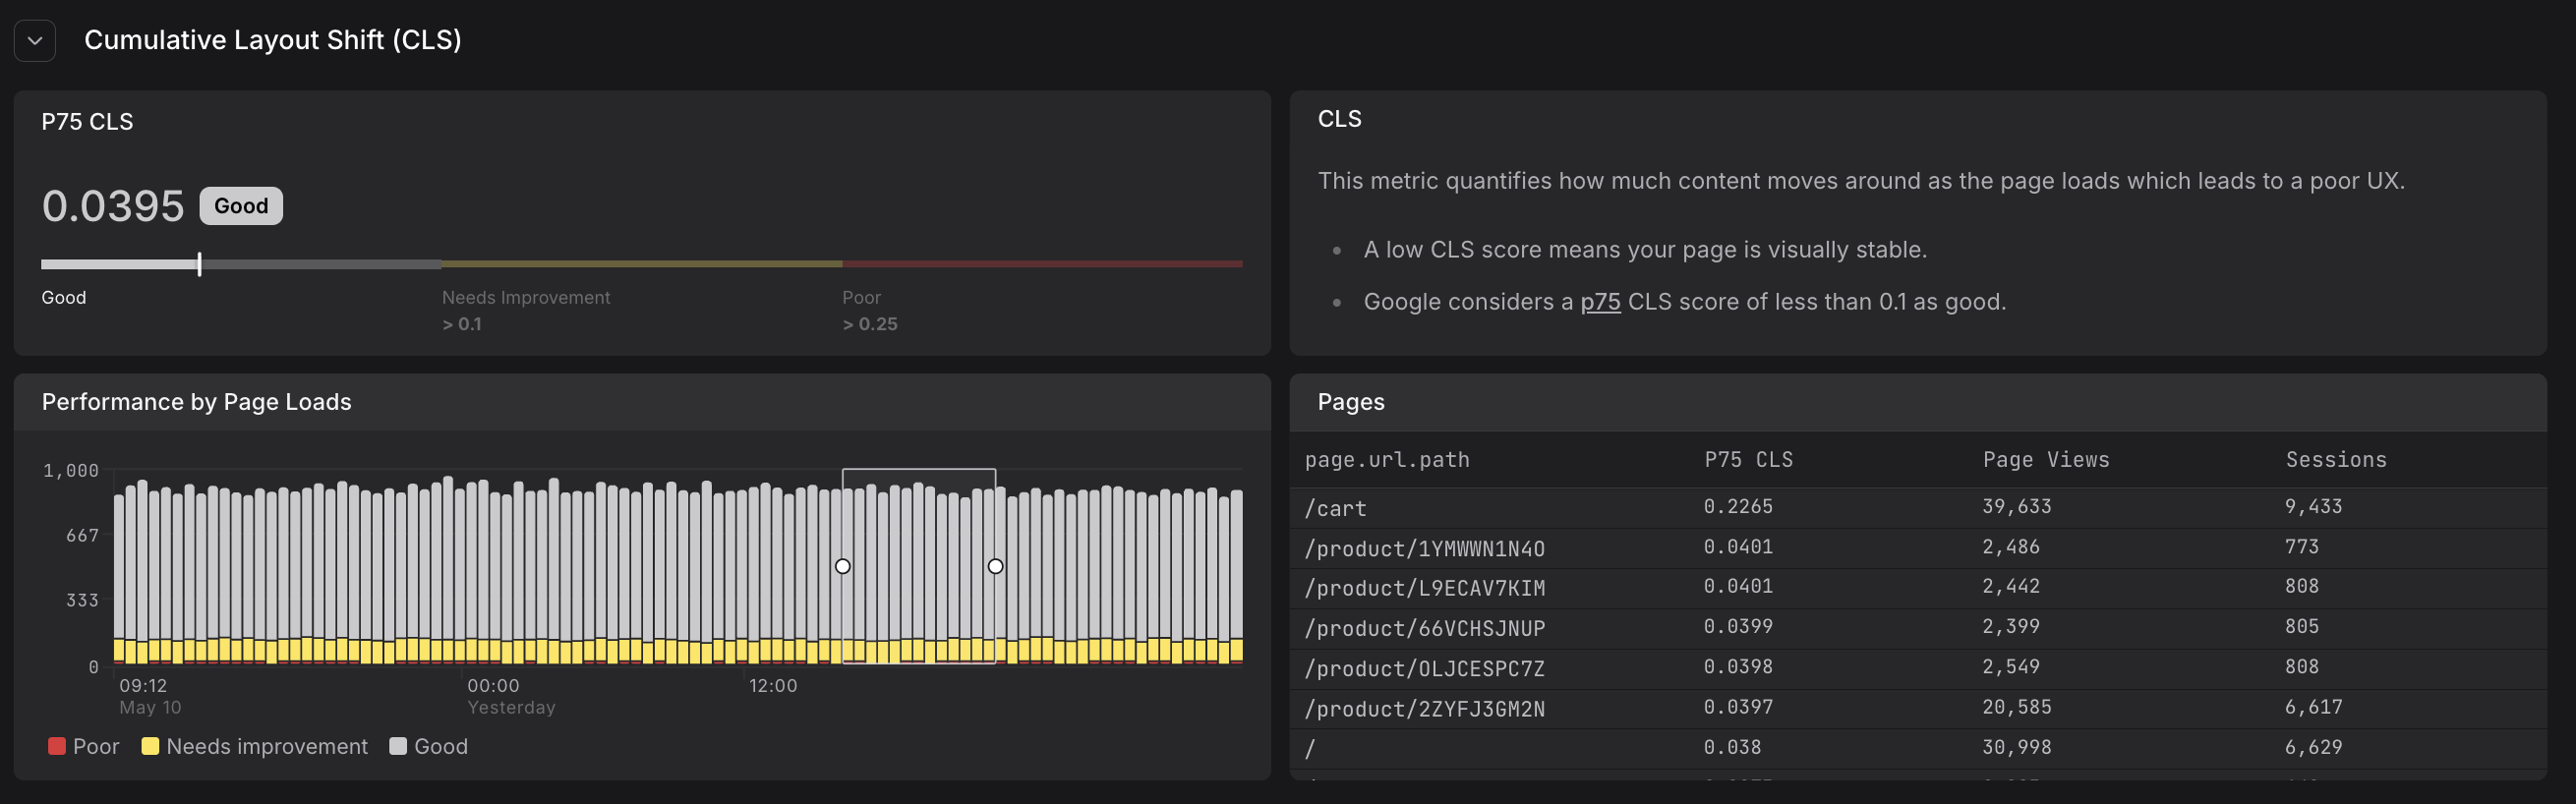
- CLS — Cumulative Layout Shift — measures how much page content shifts unexpectedly during load.
Google uses these metrics to rank pages in search results, so improving them benefits both user experience and SEO. Reference: Web Vitals (web.dev)
Why p75?
Dash0 reports all web vital scores at the 75th percentile (p75). This is the same methodology Google uses for its Core Web Vitals assessment.
The p75 is used instead of the median or the maximum because:
- The median (p50) ignores the worst quarter of experiences and can make a site look healthy even when a significant fraction of users are struggling.
- The maximum is dominated by outliers — a single user on a very slow device or network can make an otherwise fast site look broken.
- The p75 means that 75% of your users are at or below the reported score. If your p75 LCP is 2.4 s (Good), three out of four users load your largest content in under 2.4 seconds.
Largest Contentful Paint (LCP)
LCP measures how long it takes for the largest visible content element — typically a hero image, a large text block, or a video thumbnail — to fully render in the viewport after the page starts loading.
Thresholds:
| Rating | Value |
|---|---|
| Good | < 2.5 s |
| Needs Improvement | 2.5 s – 4.0 s |
| Poor | > 4.0 s |
What causes a poor LCP:
- Slow server response times (TTFB)
- Render-blocking JavaScript or CSS
- Slow resource load times for images or fonts
- Client-side rendering that delays the largest element until all data is fetched
How to improve it: Load critical resources early, use <link rel="preload"> for hero images, and avoid making the largest visible element dependent on a data fetch completing before it can paint.
Interaction to Next Paint (INP)
INP measures the latency of all user interactions (clicks, taps, keyboard input) throughout the entire page lifecycle, and reports the worst one. It replaced FID (First Input Delay) as a Core Web Vital in March 2024.
Thresholds:
| Rating | Value |
|---|---|
| Good | < 200 ms |
| Needs Improvement | 200 ms – 500 ms |
| Poor | > 500 ms |
What causes a poor INP:
- Long JavaScript tasks blocking the main thread
- Heavy re-renders triggered by state changes
- Synchronous data fetching on interaction
- Third-party scripts competing for the main thread
How to improve it: Break up long tasks, defer non-critical JavaScript, use web workers for heavy computation, and avoid synchronous operations in event handlers.
Cumulative Layout Shift (CLS)
CLS measures the total amount of unexpected layout movement that occurs during the page lifecycle. Every time a visible element moves unexpectedly — because an image loaded without reserved dimensions, an ad injected above existing content, or a font swap caused text to reflow — the shift is added to the CLS score.
Thresholds:
| Rating | Value |
|---|---|
| Good | < 0.1 |
| Needs Improvement | 0.1 – 0.25 |
| Poor | > 0.25 |
What causes a poor CLS:
- Images and iframes without explicit
widthandheightattributes - Dynamically injected content (ads, banners, cookie notices) above existing content
- Web font loading that causes a FOUT (Flash of Unstyled Text)
- Animations that move elements using properties that trigger layout (e.g.
top,leftinstead oftransform)
How to improve it: Always set explicit dimensions on images and embeds, reserve space for dynamic content using CSS min-height, and prefer transform-based animations.
How scores update during a session
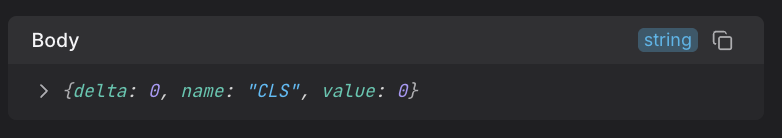
Web vital measurements are not recorded once at page load — they are updated throughout the session as the user interacts with the page. Each update produces a new browser.web_vital event with the current value and the delta (change since the last measurement).
This means:
- A user who loads a page quickly but later encounters a slow interaction will have their INP score worsen mid-session.
- A page that shifts layout while lazy-loading images will accumulate CLS incrementally.
In the Websites section, the p75 scores shown in the gauges and tables reflect the final value recorded for each page load event within the selected time window.
The delta field in web vital events shows how much the score changed since the previous measurement, allowing you to track performance degradation throughout a session. A CLS event with delta: 0 means no new layout shifts occurred since the last update.
Reference: Web Vitals (web.dev)
Further Reading
- About Web Events. Describes the
browser.web_vitalevent type that captures LCP, INP, and CLS measurements throughout a user session. - Analyze Web Vitals. Shows how to use the Web Vitals tab to identify poorly performing pages, interpret the Performance by Page Loads chart, and track web vital trends over time.
- Monitor Website Overview. Explains the Overview tab where the Experience gauges display p75 web vital scores at a glance.
- Understand Web Event Types. Details on the structure of
browser.web_vitalevents including how values change over time and the delta field. - Set Up the Web SDK. Installation instructions for the Dash0 Web SDK that automatically captures Core Web Vitals measurements.