
Last updated: October 11, 2026
Use the Failed Check Telemetry View
The Failed Check Telemetry View connects failed checks with the underlying telemetry that caused them. This eliminates manual correlation work and provides direct access to the logs, spans, metrics, and web events that triggered the alert.
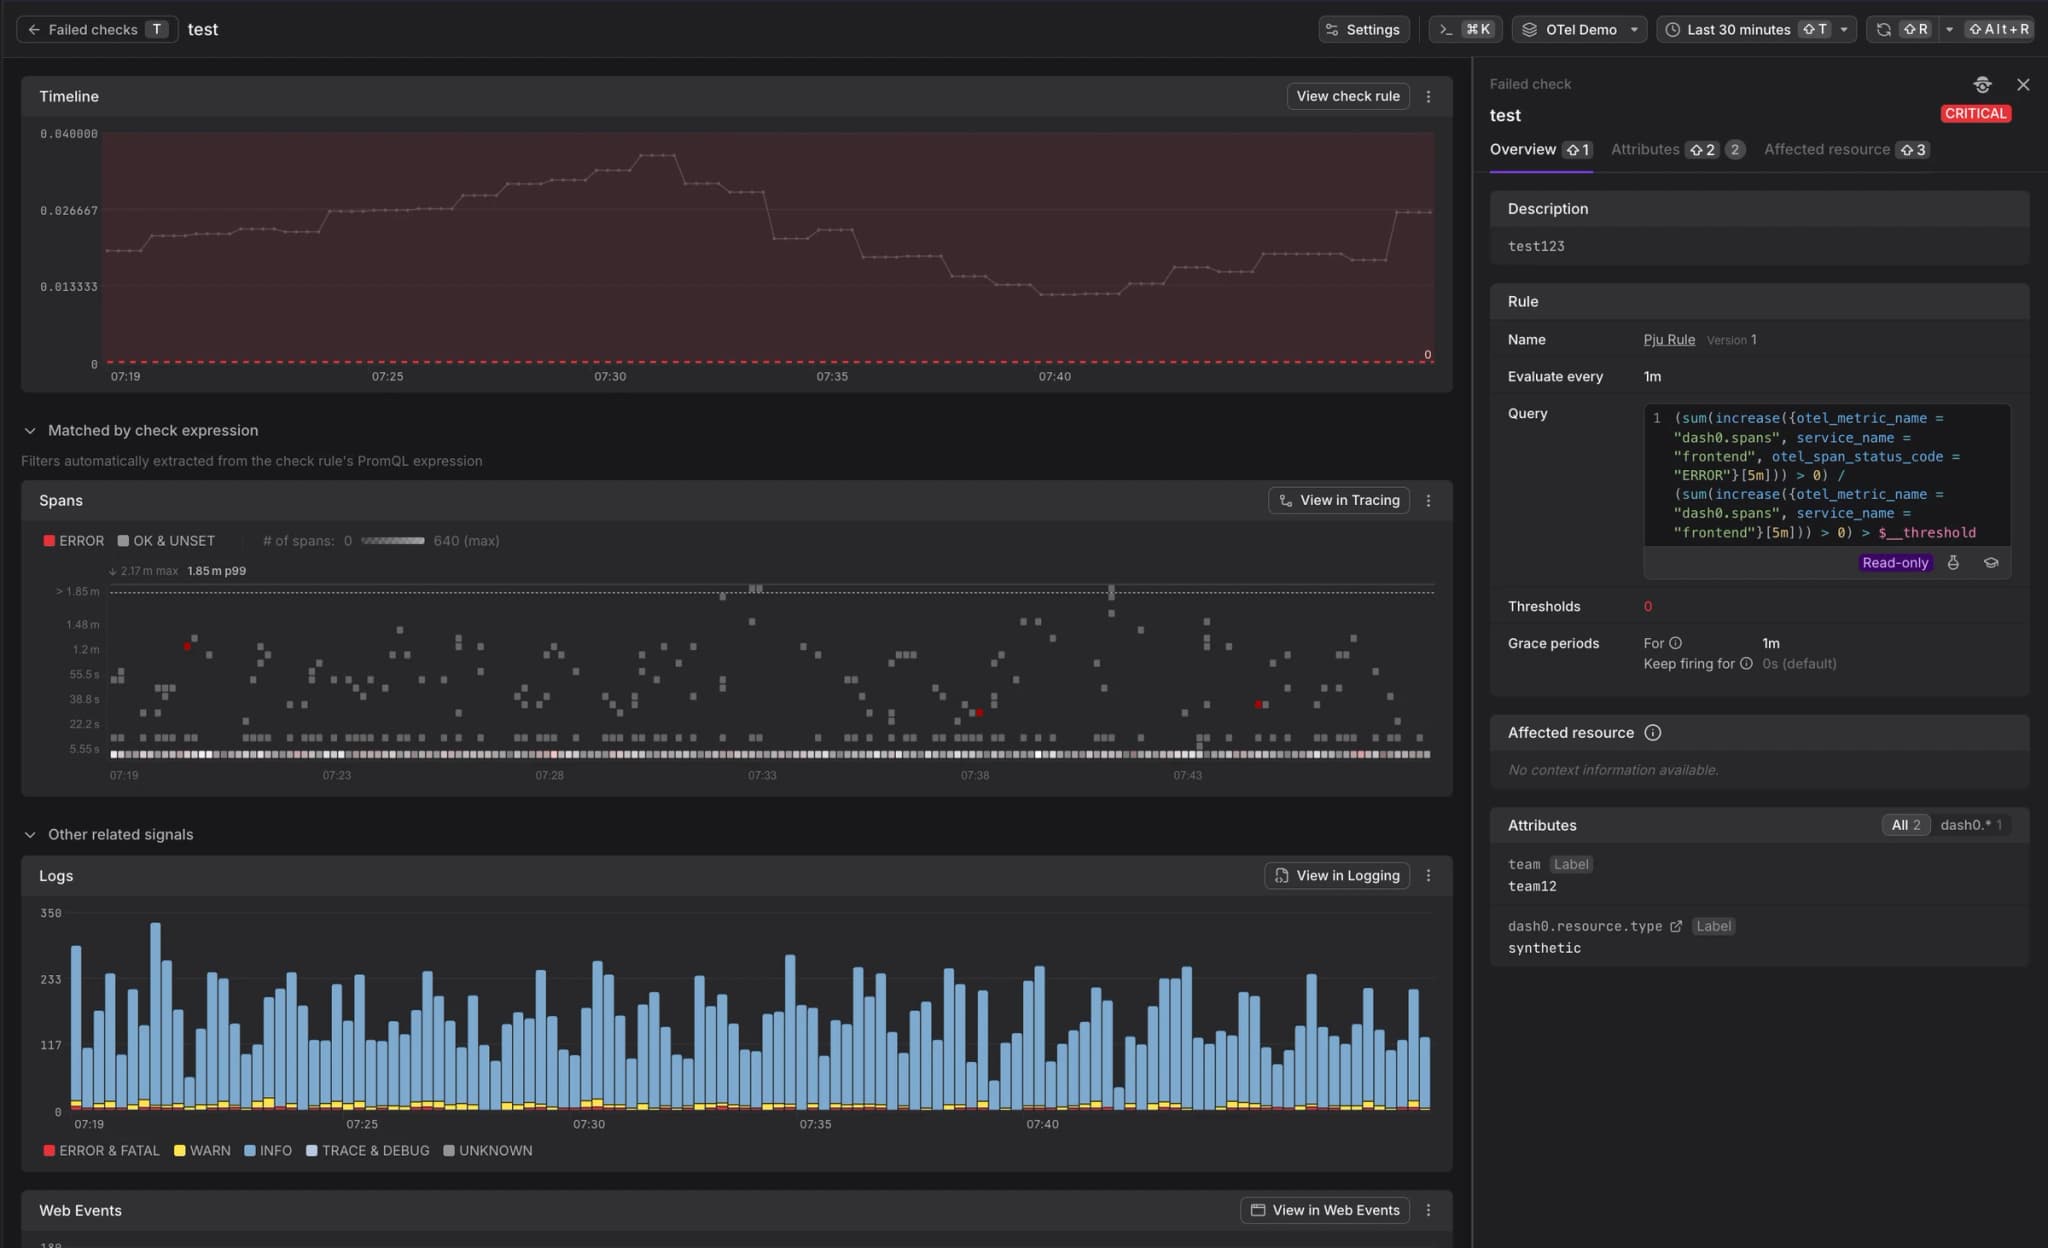
Navigate to the Failed Check Telemetry View from the Failed Checks View or Failed Check Details View: click a failed check to open the related details view. Click View failed check (or press T) and the telemetry view opens with automatic filtering applied.
How Telemetry Association Works
One of the most powerful features of Dash0's alerting system is the automatic connection between failed checks and the underlying telemetry that caused them. This eliminates the manual correlation work required in traditional monitoring systems.
Dash0 automatically scopes telemetry based on the check rule query filters. When you view a failed check, Dash0 shows you the exact logs, spans, and metrics that matched the alert conditions.
This works particularly well with Dash0's synthetic metrics.
For example:
dash0.spans.duration: Check rules monitoring span durations automatically show the matching spans that exceeded thresholds.dash0.logs: Log-based check rules display the matching log entries that triggered the alert.dash0.web_events: Browser monitoring check rules show the matching web events.
The telemetry view preserves all filters from the check rule query, including service names, resource attributes, and custom labels. This means you see only the telemetry relevant to the alert, not the entire dataset.
For further details, see Everything is Connected: From PromQL to Dashboards and Back.
Telemetry View Layout
The telemetry view has two main areas:
Main Panel (Left Side)
The main panel shows the telemetry data that matched the check rule:
- Timeline: Shows when the check matched the threshold with threshold violation markers
- Matched Telemetry: Related signals such as logs, spans, and web events displayed with the same filters applied
- Time Range: Automatically set to the period when the check was firing
Detail Sidebar (Right Side)
The detail sidebar shows check rule information:
- Description: Check summary explaining what triggered the failure
- Query: The PromQL query that produced this alert
- Thresholds: Configured threshold values
- Grace periods: Evaluation timing configuration
- Affected resource: Service and resource identifiers
- Attributes: All labels associated with this failed check
For detailed information, see Use the Failed Check Details View.
Navigate to Full Explorers
From the telemetry view, you can navigate to the full explorers with filters preserved:
- View check rule - Opens the check rule configuration
- View in Tracing - Opens the Tracing Explorer with matching spans
- View in Logging - Opens the Log Explorer with matching log entries
- View in Web Events - Opens the Web Events Explorer with matching events
- View in Metric Explorer - Opens the Metric Explorer with the check rule query
All navigation options preserve the filters from the check rule, allowing you to perform deeper analysis using the full capabilities of each explorer.
Understanding Filtered Views
The telemetry view shows only data that matches the check rule's query conditions. This is different from viewing the full dataset in an explorer.
What's included:
- Telemetry matching the time range when the check was firing
- Data matching all label selectors from the check rule query
- Resource attributes specified in the query
What's excluded:
- Telemetry outside the alert time range
- Data that doesn't match the query filters
- Unrelated services or resources
This focused view helps you identify the root cause without sifting through unrelated data.
Example: Investigating a Log Alert
Consider a check rule that fires when error logs exceed a threshold:
1sum(rate({otel_metric_name="dash0.logs", severity="ERROR", service_name="payment-service"}[5m])) > 10
When you view the telemetry for a failed check from this rule:
- The timeline shows when error log rates exceeded 10/second
- The log entries section shows the actual ERROR logs from payment-service
- Each log entry is from the time period when the check was firing
- Clicking "View in Logging" opens the full log explorer with the same service and severity filters
You can immediately see which error messages were occurring and investigate their context.
Example: Investigating a Latency Alert
For a span duration alert:
1histogram_quantile(0.99, sum by (le) (rate({otel_metric_name="dash0.spans.duration", service_name="frontend"}[5m]))) > 0.5
The telemetry view shows:
- Timeline with P99 latency exceeding 500ms
- Matching spans from the frontend service
- Spans sorted by duration, showing the slowest requests
- Span details including operations, status codes, and timing breakdown
Click a slow span to see its full trace and identify bottlenecks.
Tips for Effective Investigation
- Start with the timeline - Understand when the issue occurred and how severe it was
- Look for patterns - Multiple similar errors or spans may indicate a systemic issue
- Check resource context - Use the sidebar to see service metadata and infrastructure details
- Navigate to full explorers - When you need more context or want to expand the time range
- Compare with normal periods - Use the metric explorer to see how current values compare to baseline
Further Reading
- About Investigating Failed Checks - Overview of investigation tools and workflows
- Use the Failed Checks View - Browse all failed checks
- Use the Failed Check Detail View - Detailed view of a specific failed check
- Create Check Rules - Learn how query structure affects telemetry association