
Last updated: October 11, 2026
Use the Failed Checks View
The Failed Checks View shows which check rules are currently failing, their severity level, and historical state transitions. Use it to get an overview of all check failures and navigate to detailed investigation views.
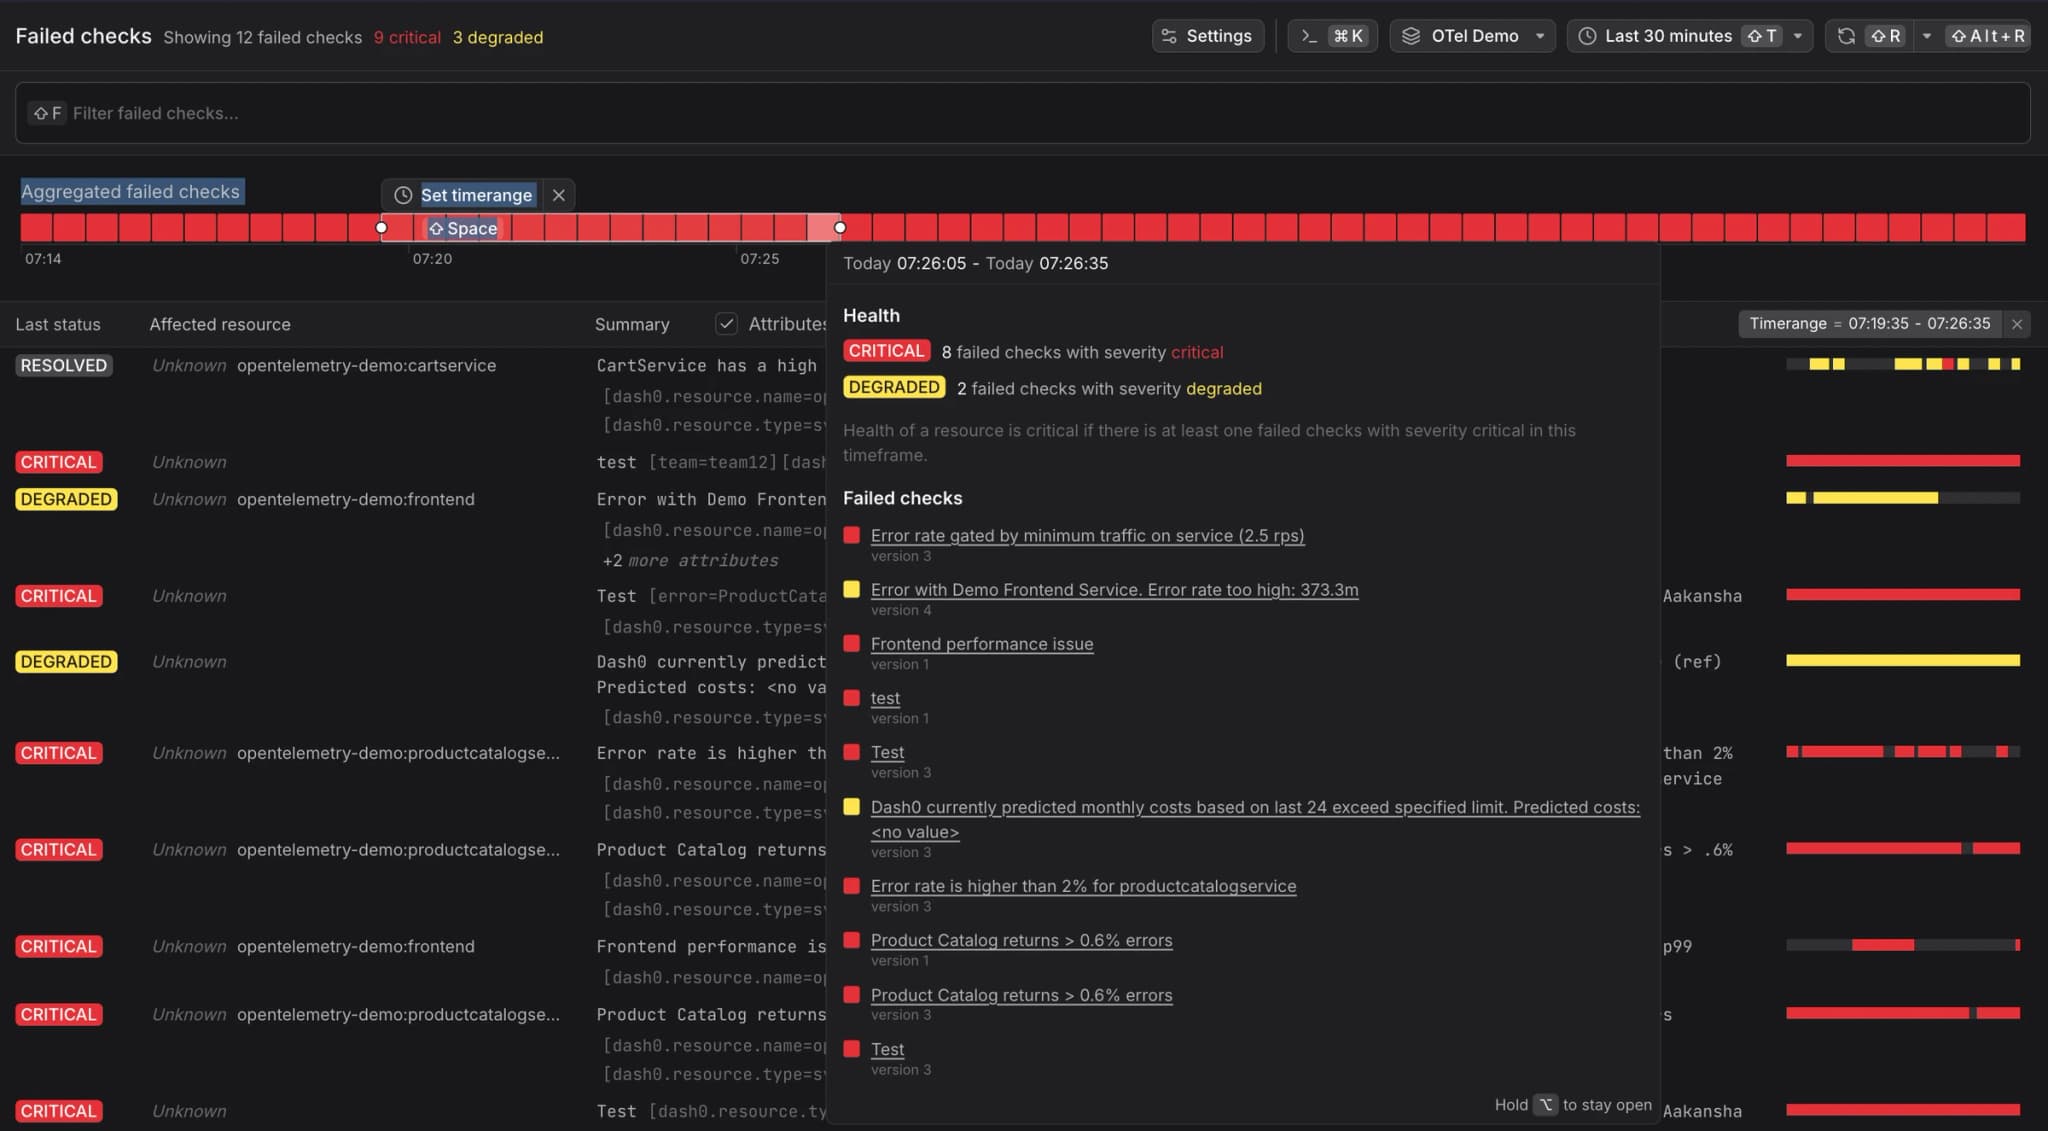
Each row in the table represents a failed check with the following information:
- Check name - The name of the check rule that fired
- Current status - RESOLVED (grey), DEGRADED (yellow), or CRITICAL (red)
- Affected resource - The service or resource associated with this failed check
- Status badges - Visual indicators for severity
- Timing information - When the check fired and last updated
Navigate to the Failed Checks View through the Dash0 navigation menu, choose Alerting and then Failed checks, or go to the Failed Checks View directly from here.
When a check fires, Dash0 records the metric values that caused the failure along with the associated service and resource attributes, providing a complete audit trail of check state changes.
View Check Details
Click any row to open the detail sidebar with comprehensive information about that specific failed check. The sidebar provides three tabs:
- Overview - Timeline, rule configuration, and affected resource summary
- Attributes - All labels associated with the failed check
- Affected Resource - Detailed resource information including metrics and metadata
See Use the Failed Check Detail View for complete details on the sidebar tabs.
Filter and Search
Use the filters and search functionality to find specific failed checks:
- Filter by status (CRITICAL, DEGRADED, RESOLVED)
- Filter by affected service or resource
- Search by check rule name
- Sort by time, severity, or affected resource
Service Health Panel
The health status panel on the right shows service health indicators based on check results. Services are colored according to their most severe check status:
- Gray - No active checks or all checks passing
- Yellow - One or more checks in DEGRADED state
- Red - One or more checks in CRITICAL state
Click a service in the health panel to filter the failed checks list to show only checks affecting that service.
Navigate to Telemetry
From the Failed Checks View, you can navigate to the underlying telemetry:
- Click a failed check row to open the detail sidebar.
- Click View failed check to see the telemetry view with the exact logs, spans, metrics, and web events that triggered the alert.
This direct navigation eliminates manual correlation between alerts and telemetry.
Further Reading
- About Investigating Failed Checks - Overview of investigation tools and workflows
- Use the Failed Check Detail View - Detailed view of a specific failed check
- Use the Failed Check Telemetry View - View associated telemetry for failed checks