Last updated: July 14, 2026
About Investigating Failed Checks
Learn how to investigate failed checks using the Failed Checks View, detail views, and associated telemetry to identify and resolve issues affecting your services.
When a check fires, Dash0 provides multiple views and tools to help during investigation of alerts.
These are the tools and views available for investigating failed checks:
- Failed Checks View - Browse all failed checks, filter by status, and access detailed views.
- Failed Check Detail View - Examine timeline, configuration, attributes, and affected resources for a specific check.
- Failed Check Telemetry View - View the exact telemetry (logs, spans, metrics, and web events) that caused the alert.
- Agent0 - Ask natural language questions about failed checks to get instant root cause analysis with supporting telemetry.
Each view provides progressively more detail, allowing you to identify issues at a high level and drill down to root causes.
Note
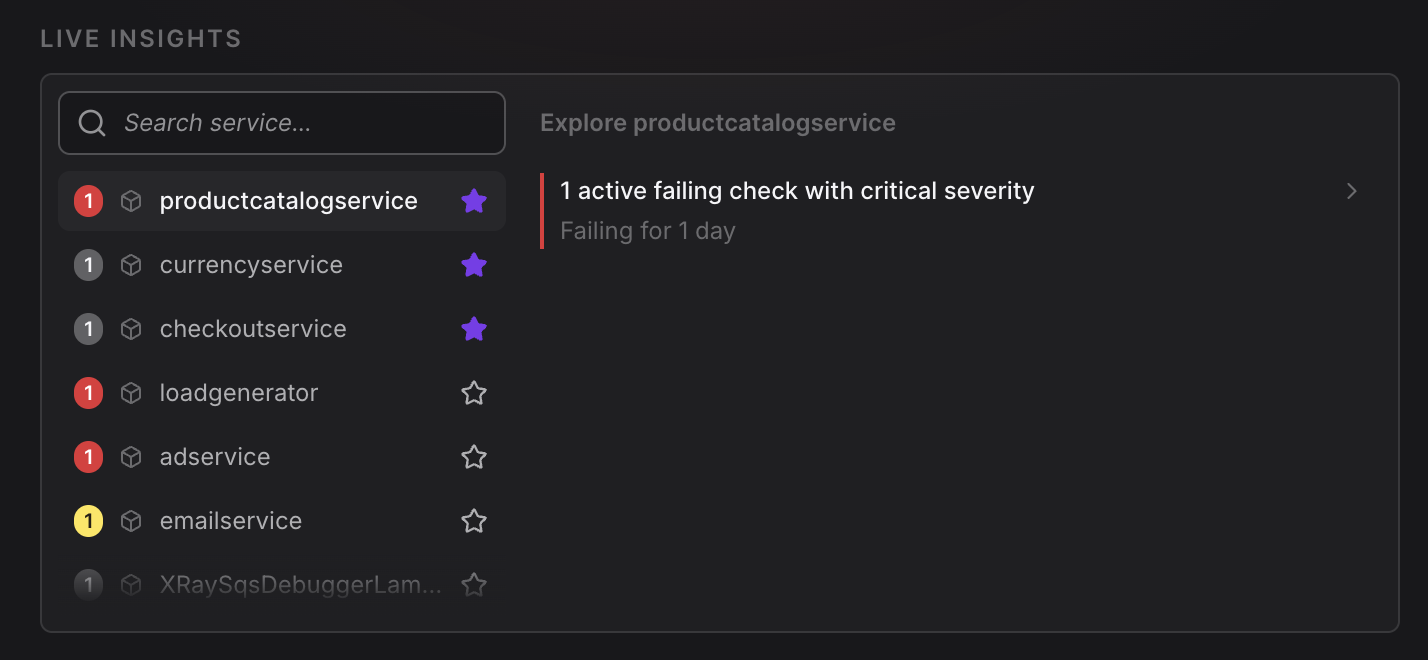
Agent0 provides Live Insights that proactively surface anomalies, errors, and performance issues across your services. When investigating failed checks, Agent0 can correlate the alert with related signals to accelerate root cause analysis.
Further Reading
- About Alert Monitoring — Overview of Dash0's alerting capabilities and how check rules monitor your systems.
- Create Check Rules — Set up check rules to monitor metrics, logs, spans, and web events using PromQL expressions and threshold values.
- Send Check Rule Notifications — Configure notification channels to keep your team informed when checks fail.
- Route Check Rule Notifications — Use label-based routing to direct alerts to the right teams automatically.