
Last updated: October 11, 2026
Use the Failed Check Details View
The Failed Check Details View provides detailed information about a specific check failure across three tabs.
Navigate to the Failed Check Details View by clicking a failed check row in the Failed Checks View.
Overview Tab
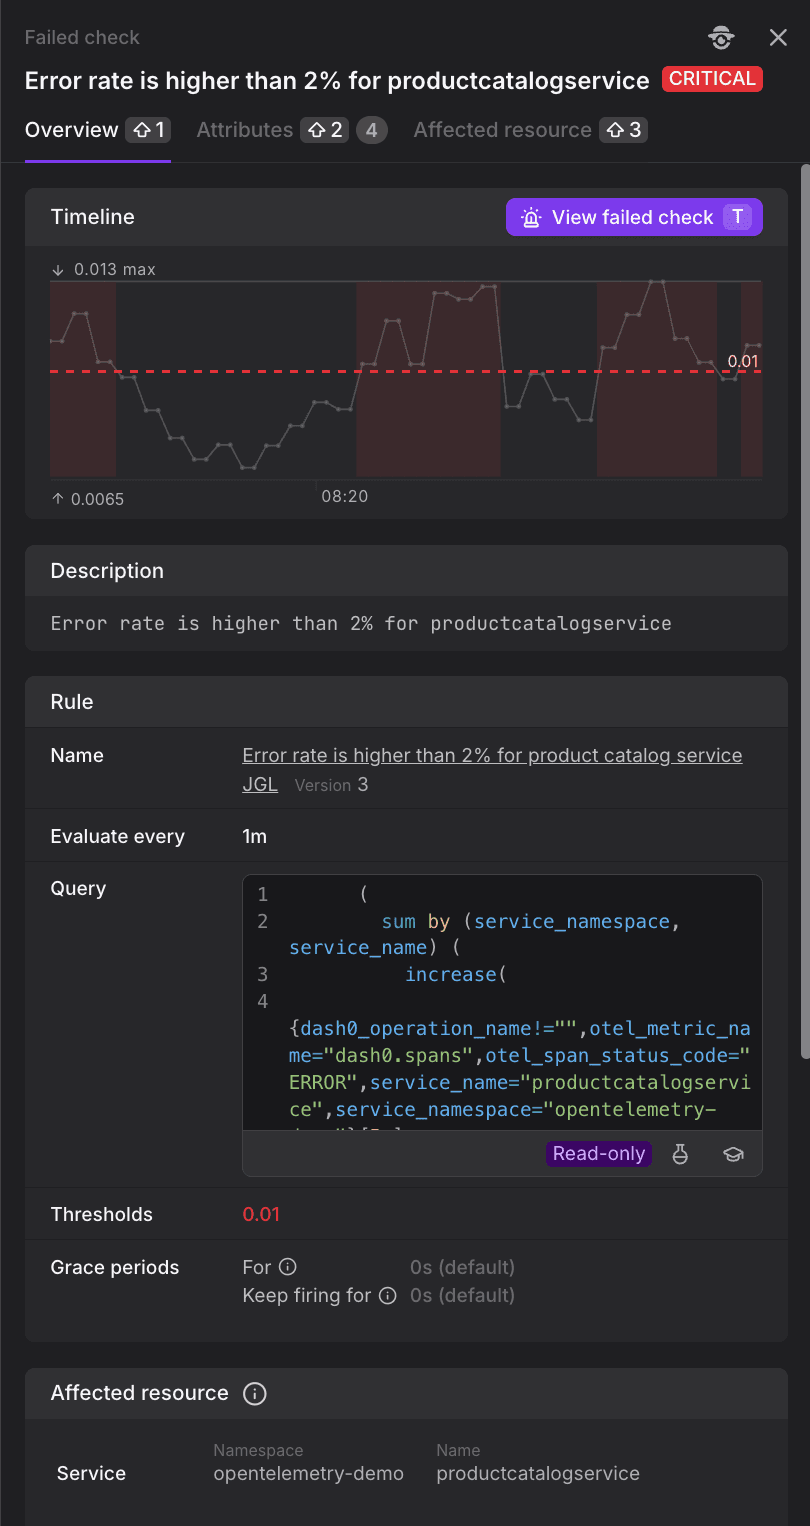
The Overview tab shows the check timeline, rule configuration, and affected resource summary.
In the Overview tab, the following fields are displayed:
- Title: The failed check title with its severity badge (CRITICAL, DEGRADED, or RESOLVED).
- Timeline: Metric values over time with a dashed horizontal line representing the critical threshold. Values crossing the threshold appear against a dark red background indicating threshold violations. Peaks and valleys are labeled with their values (e.g., 0.013 max, 0.0065 min).
- View failed check: Purple button with keyboard shortcut "T". Click to navigate to the full telemetry context. See Use the Failed Check Telemetry View for details.
- Description: Check summary text explaining what triggered the failure.
- Rule: Check name and version, evaluation interval (e.g., "1m"), and the formatted PromQL query marked as read-only. Use the copy and expand icons to interact with the query.
- Thresholds: Configured critical threshold value in red.
- Grace periods: "For" and "Keep firing for" durations with info icons that reveal default values (e.g., "0s (default)") when hovered.
- Affected resource: Service namespace and name associated with this failed check.
Click View failed check to see the telemetry view with the exact logs, spans, metrics, and web events that triggered the alert.
Attributes Tab
The Attributes tab displays all labels associated with the failed check, including resource identifiers and service metadata.
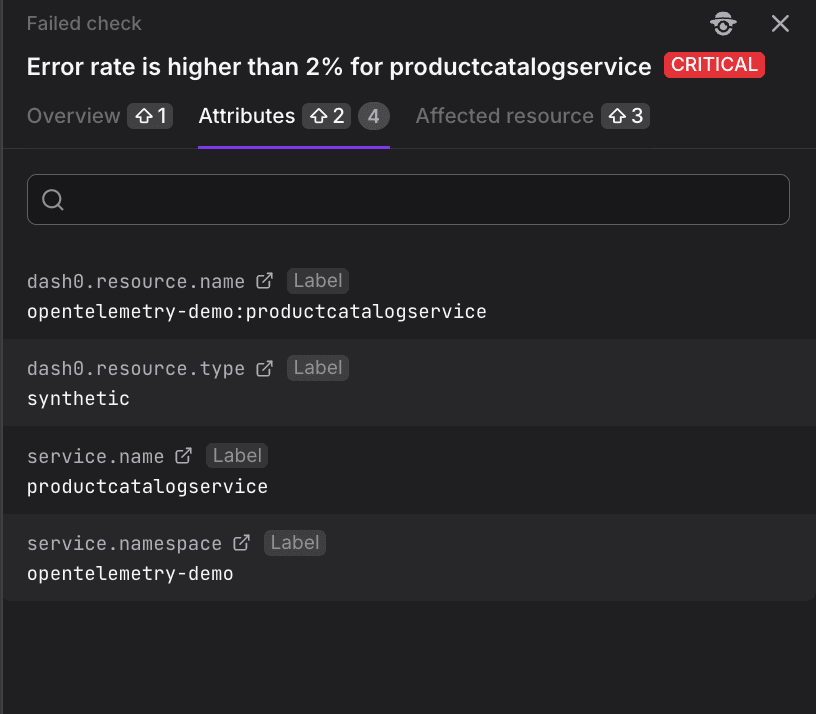
In the Attributes tab, the following fields are displayed:
- Search: Search field with magnifying glass icon to filter through all labels.
- Attributes: The attributes applicable to the failed check. Each attribute shows both the label key and its value.
These attributes determine how the check is routed to notification channels and which service is colored based on the check result. Understanding which labels are present helps you configure routing rules effectively.
Using Attributes for Routing
The labels shown in the Attributes tab are the same labels available for notification routing. When you configure label-based routing rules, you're matching against these exact attribute keys and values.
For example, if you see:
team: platformservice_name: checkoutdash0.failed_check.max_status: critical
You can create routing rules that match any combination of these labels to direct alerts to the appropriate notification channels.
Affected Resource Tab
The Affected Resource tab shows detailed information about the resource associated with the failed check.
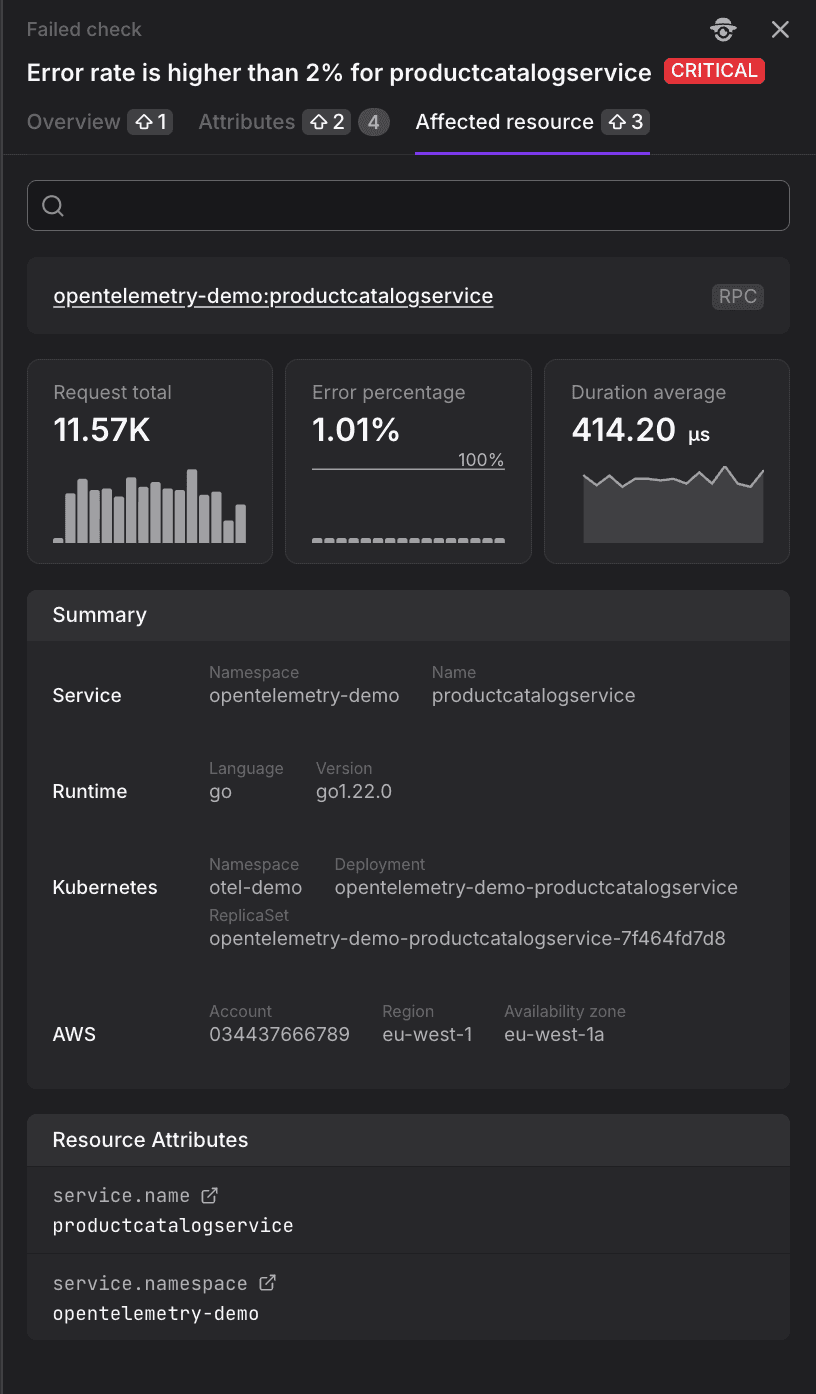
In the Affected Resource tab, the operational context is shown, including request metrics, runtime environment, infrastructure details, and cloud provider information:
- Search: Search field for filtering through all resource information.
- Resource identifier: The resource name at the top with its type badge (e.g., "opentelemetry-demo:productcatalogservice" with "RPC" badge).
- Request total: Total number of requests (e.g., "11.57K") with a bar chart visualizing request distribution over time.
- Error percentage: Current error rate (e.g., "1.01%") with a scale indicator showing the maximum (e.g., "100%") and a dashed horizontal baseline.
- Duration average: Average response time (e.g., "414.20 µs") with a line graph displaying duration trends over time.
- Service: Namespace (e.g., "opentelemetry-demo") and service name (e.g., "productcatalogservice").
- Runtime: Programming language (e.g., "go") and version (e.g., "go1.22.0").
- Kubernetes: Namespace, deployment name, and replicaset identifier.
- AWS: Account ID, region, and availability zone.
- Resource Attributes: Key service identifiers (service.name and service.namespace) with external link icons. Click the external link icon to explore these attributes in other views.
Correlating Resource Metrics with Failures
The request metrics shown in the Affected Resource tab help you understand the operational context of the failure:
- Request volume spikes may indicate load-related issues
- Error rate trends show whether the failure is isolated or part of a pattern
- Duration increases can reveal performance degradation
Compare these metrics with the failed check timeline to understand the broader context of the alert.
Keyboard Shortcuts
The detail view supports keyboard shortcuts for faster navigation:
- T - View failed check (navigate to telemetry view)
- ESC - Close the detail sidebar
Further Reading
- About Investigating Failed Checks - Overview of investigation tools and workflows
- Use the Failed Checks View - Browse all failed checks
- Use the Failed Check Telemetry View - View associated telemetry for failed checks
- Route Check Rule Notifications - Configure label-based routing using attributes