Last updated: June 19, 2026
Explore All Web Events
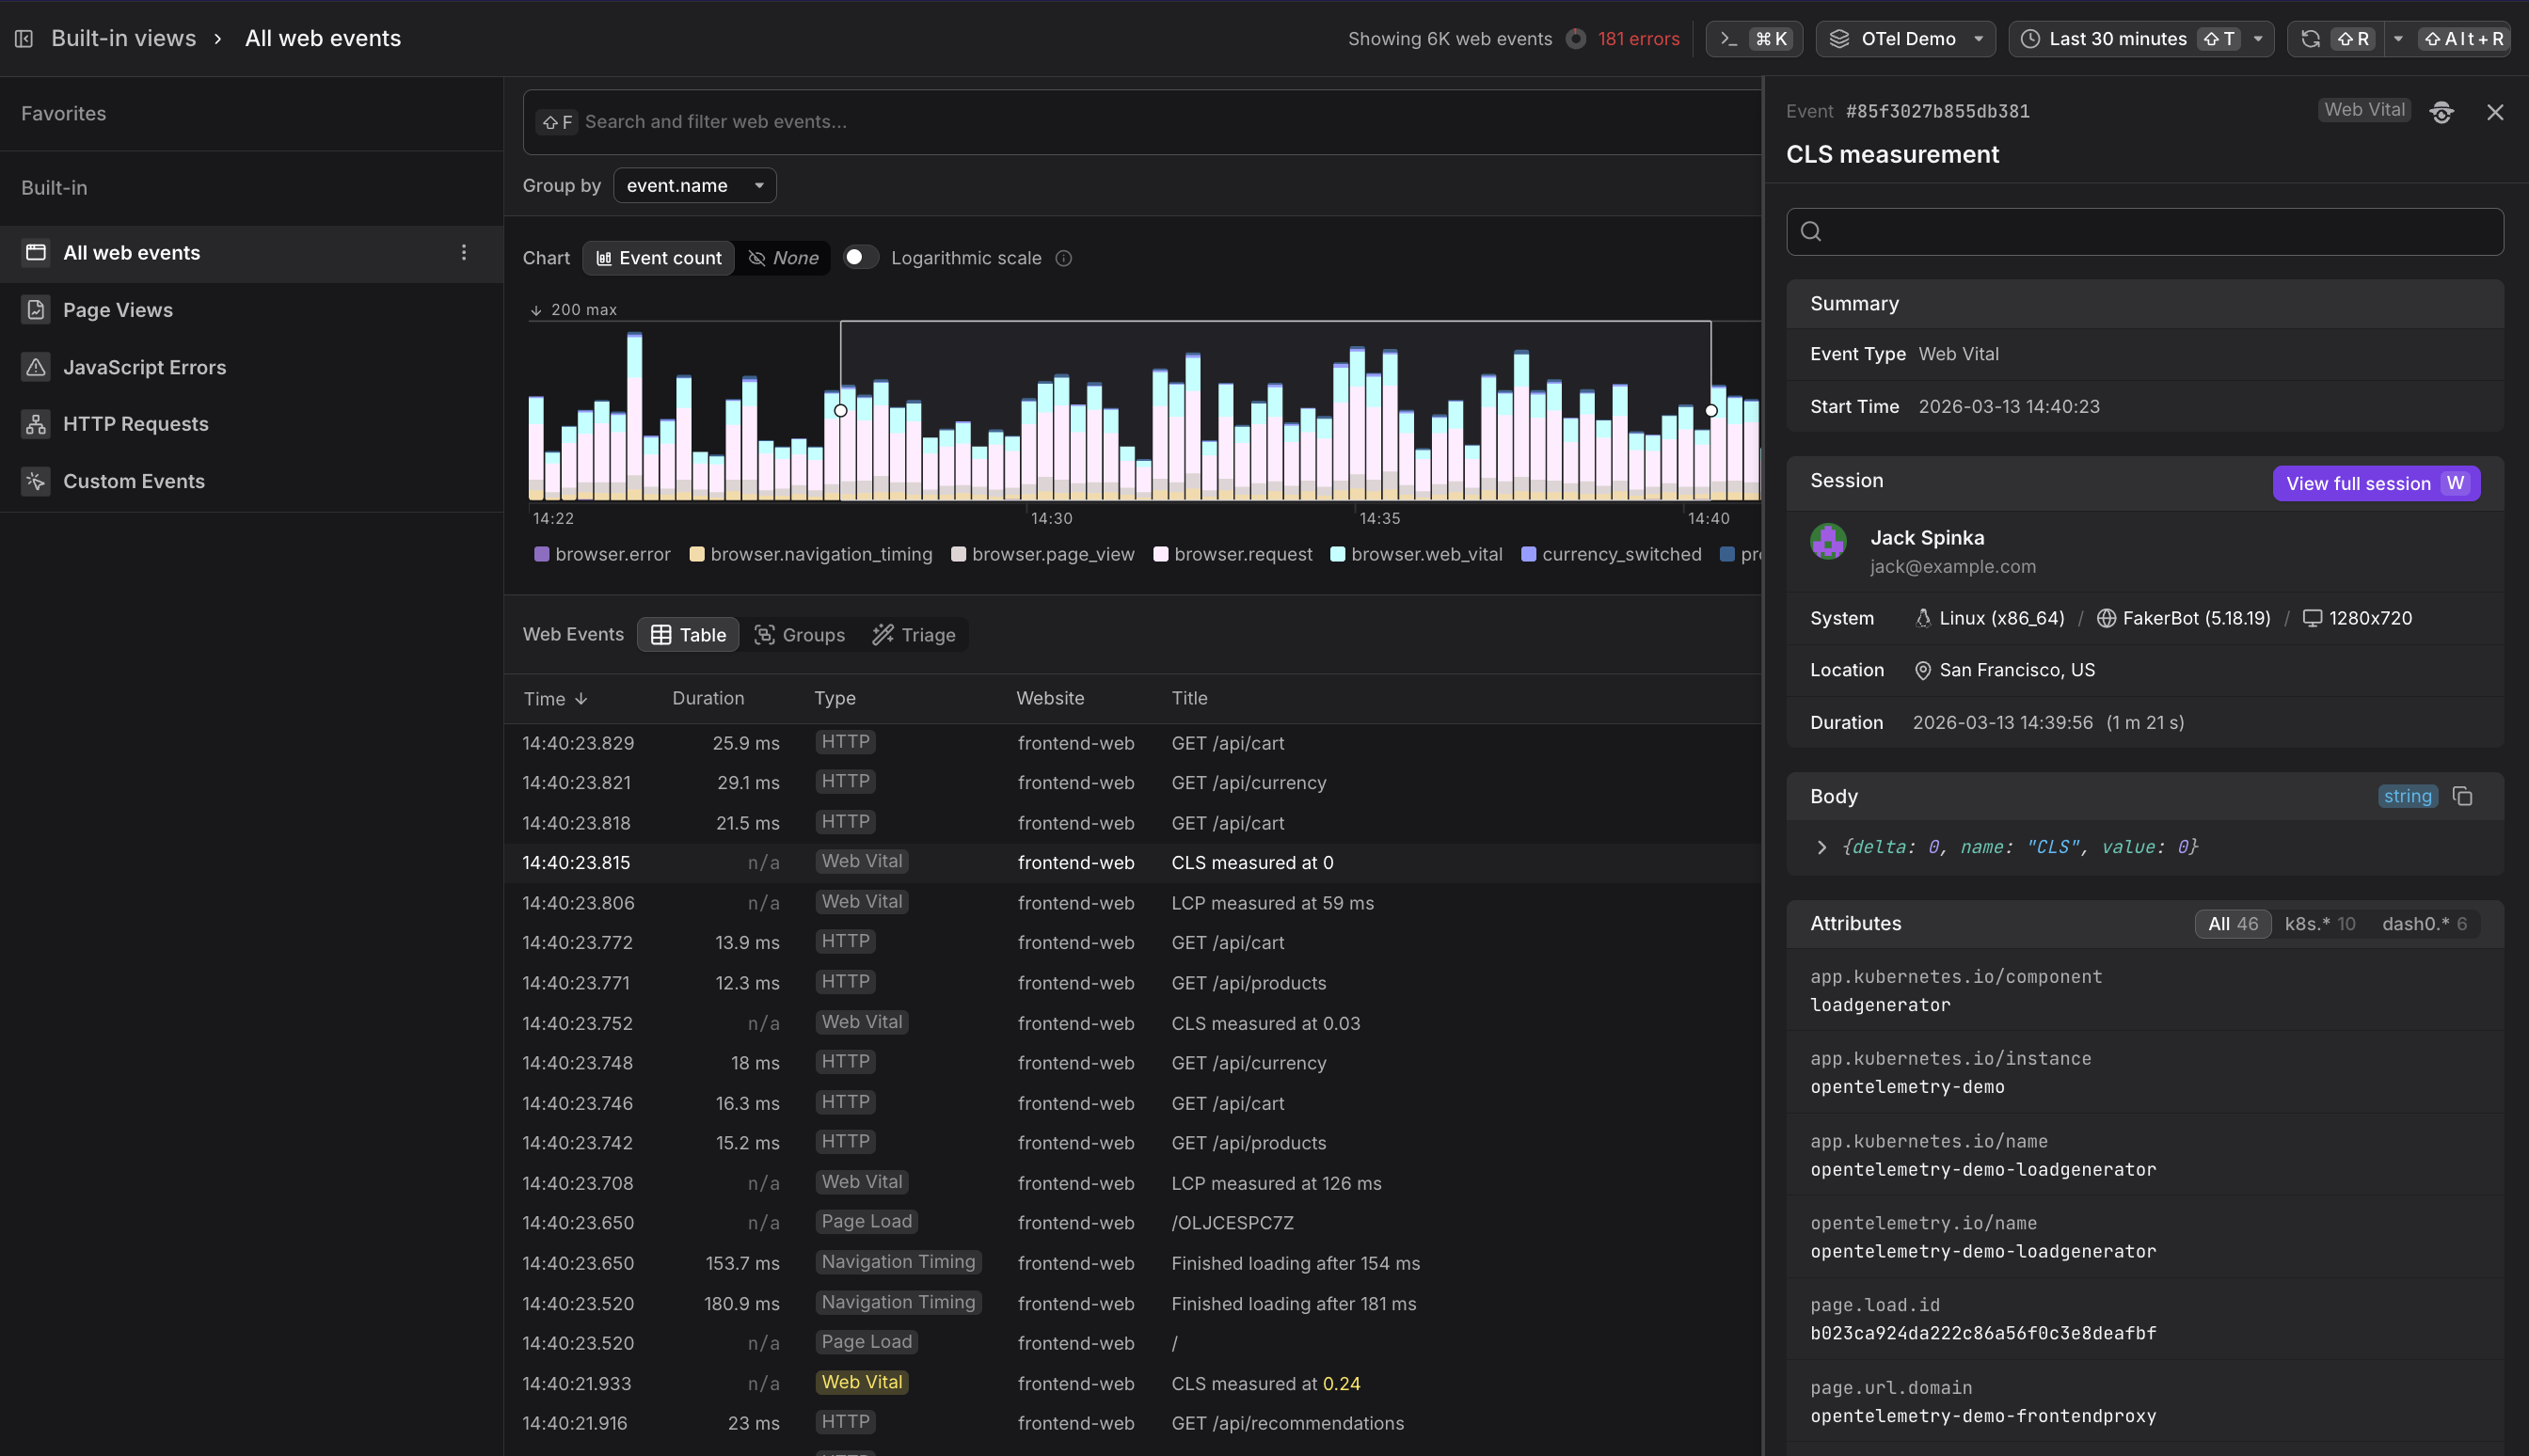
The All web events view is the unfiltered entry point into the Web Events section.
It shows every event the Web SDK has collected across all your websites — browser errors, page views, navigation timings, HTTP requests, web vitals, and any custom events you have instrumented.
- Use the search bar to add filters and narrow the event stream. Filters are carried over when you navigate to a built-in view, so you can start with a broad query and then drill into Page Views or HTTP Requests without losing your context.
- Use the Group by dropdown to pivot the chart by any attribute — for example, group by
url.pathto compare event volumes per page, or bysession.countryto break down traffic by geography.
Use the Event Count Chart
The chart at the top visualizes event volume over the selected time window, grouped by event.name by default.
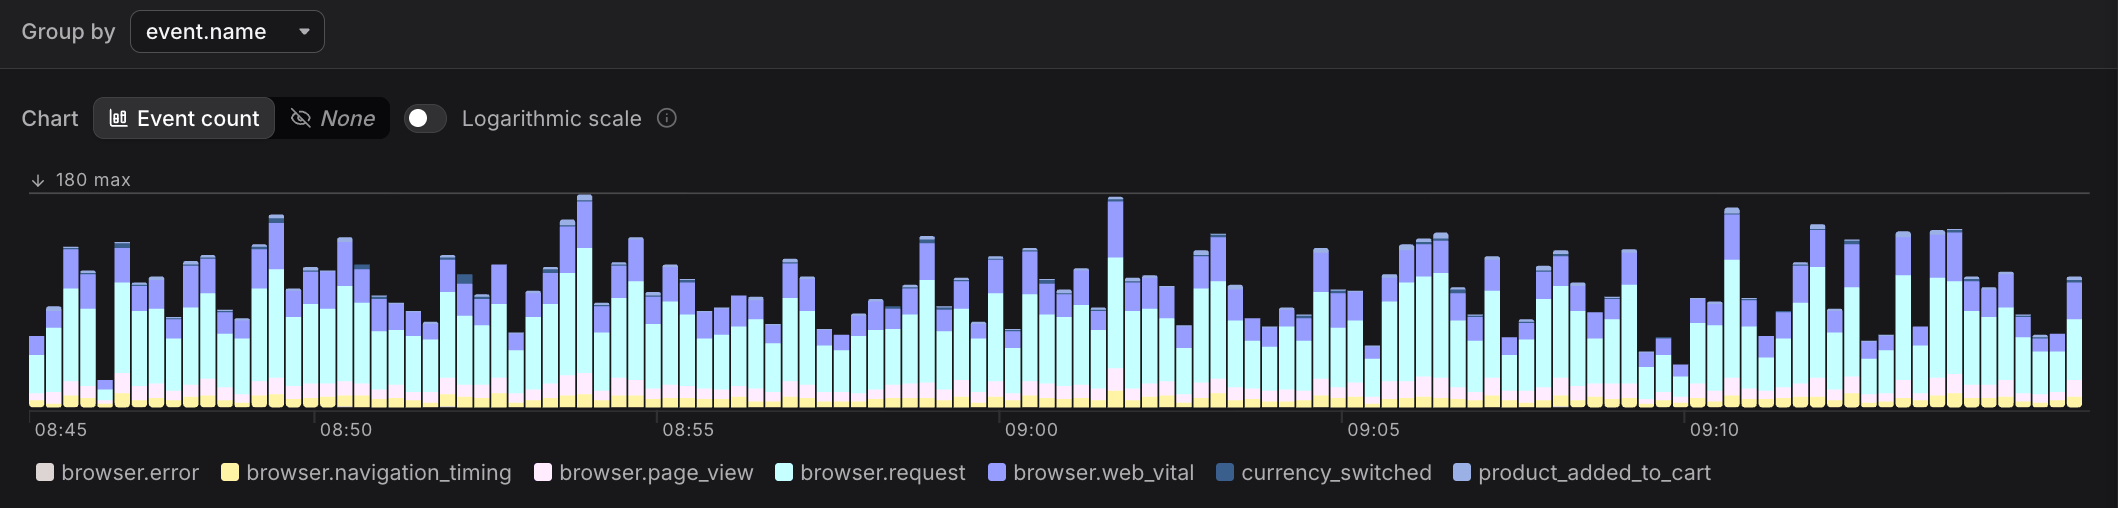
The stacked bar chart uses distinct colors to represent different event types:
- browser.error — JavaScript exceptions
- browser.navigation_timing — page load timing breakdowns
- browser.page_view — page load and transition events
- browser.request — HTTP calls to the backend
- browser.web_vital — LCP, CLS, and INP measurements
- Custom events (e.g.
currency_switched,product_added_to_cart) — application-specific instrumented actions
Colors are assigned automatically in the order event types appear in your data. The legend at the bottom of the chart shows which color corresponds to which event type.
The stacked bar chart makes it easy to spot unusual activity patterns. For example, a sudden increase in the height of a specific event type's segment indicates a spike in that activity, while a decrease might signal a deployment issue or broken functionality.
Use the Web Events Table
Below the chart, the table lists individual web events in reverse chronological order.
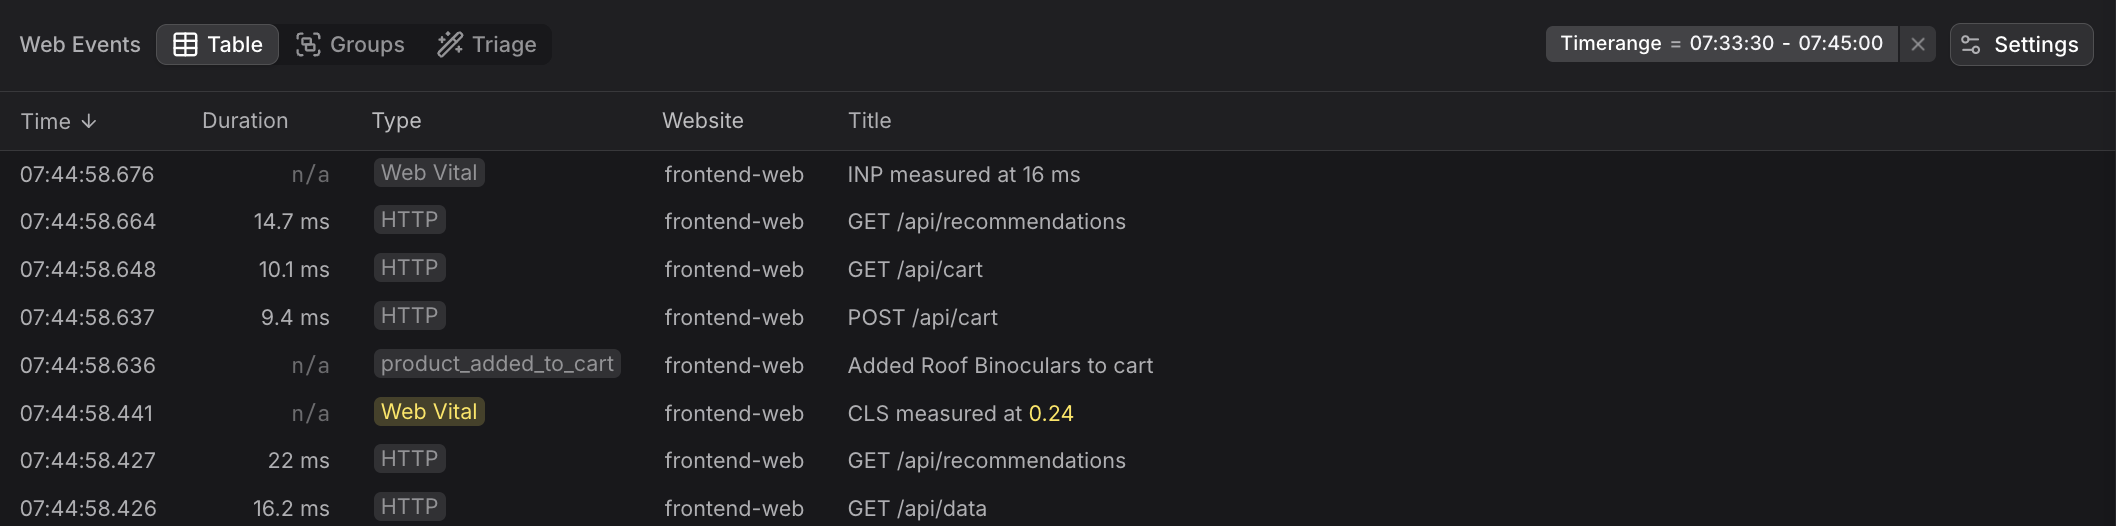
The default columns are:
| Column | Description |
|---|---|
| Time | Timestamp of the event |
| Duration | How long the event took (n/a for instantaneous events like web vitals) |
| Type | The event type badge (Web Vital, HTTP, Page Load, Navigation Timing, etc.) |
| Website | Which instrumented website the event came from |
| Title | A human-readable summary — e.g. "LCP measured at 91 ms" or "GET /api/cart" |
Use the Event Sidebar
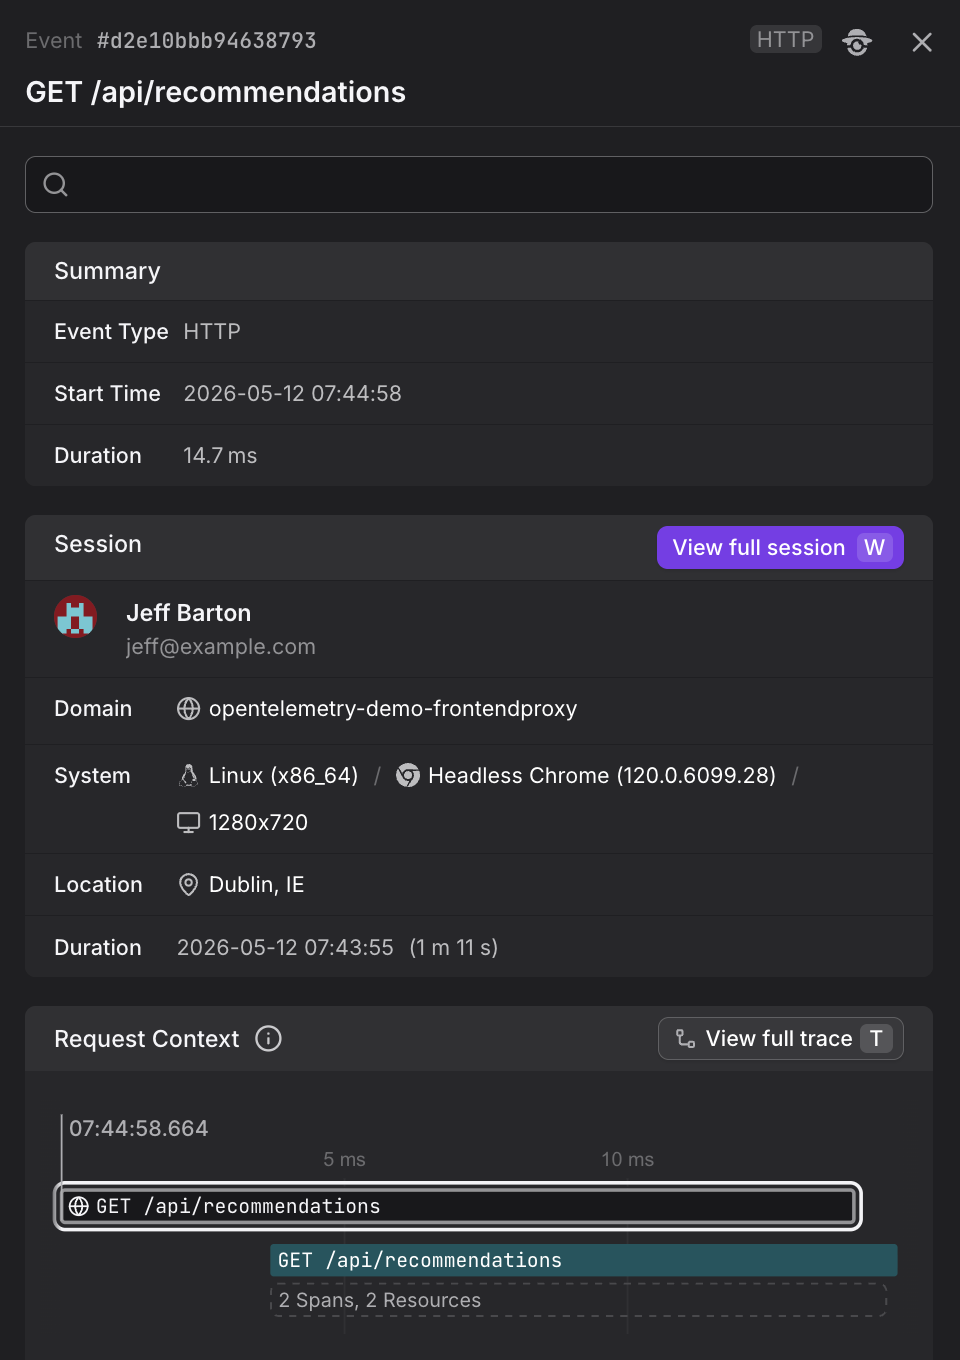
Click any row to open the detail panel on the right. The panel shows:
- Summary — event type and exact start time
- Session — the user's name and email, their operating system and browser, screen resolution, geographic location, and session duration
- Body — the raw event payload (e.g.
{delta: 0, name: "CLS", value: 0}for a web vital) - Attributes — all attached metadata, filterable by namespace (e.g.
k8s.*,dash0.*)
From the Session section you can click View full session to jump directly into the session replay in the Websites section.
For details on what the event detail sidebar shows including Request Duration charts and Trace Context, see View Event Details.
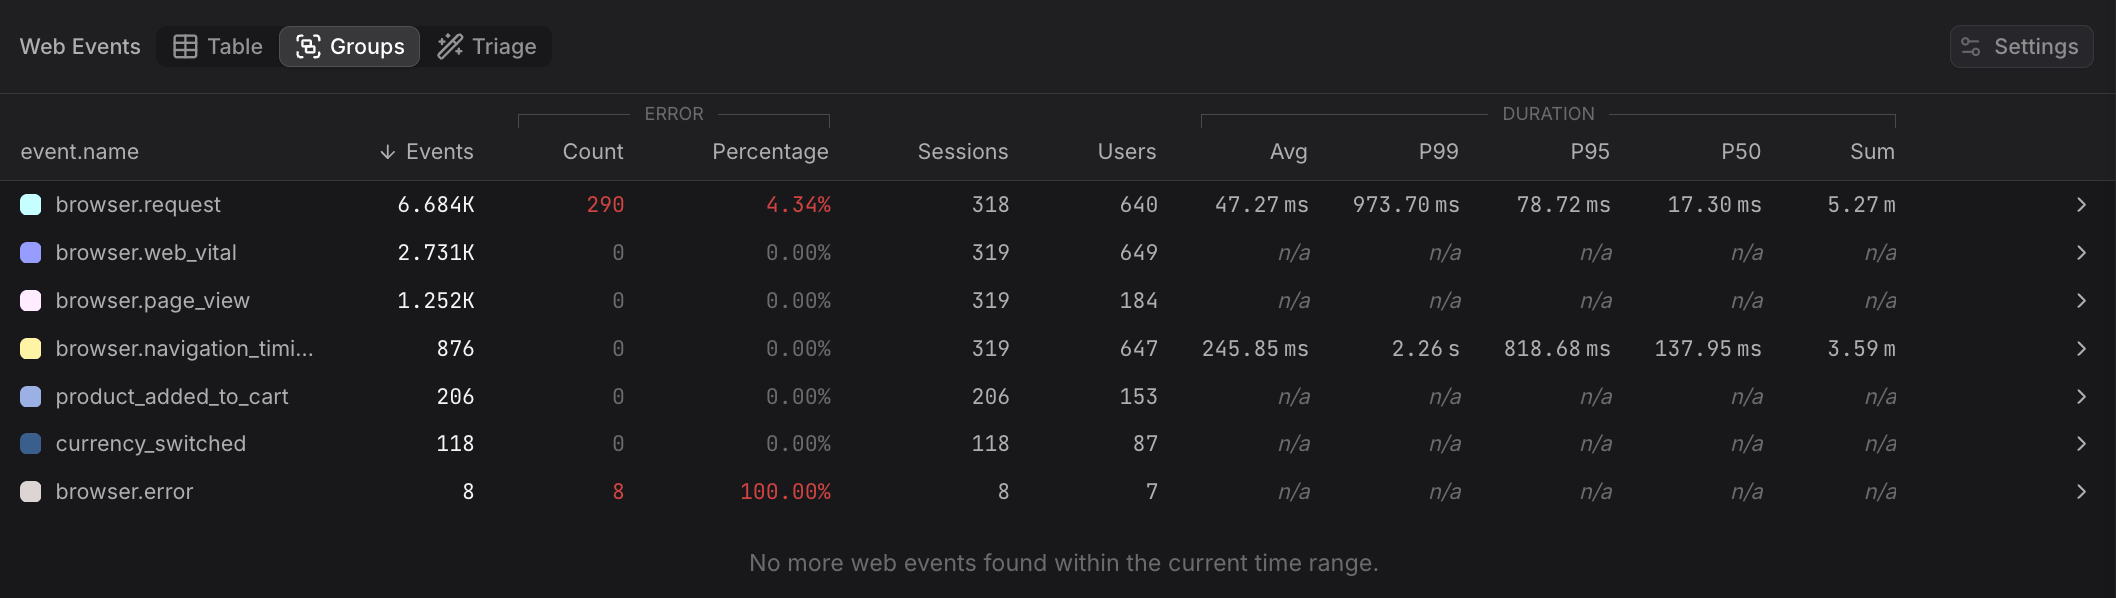
Use the Groups Tab
Switch to the Groups tab to aggregate events by any attribute. By default, events are grouped by event.name, showing the count for each event type.
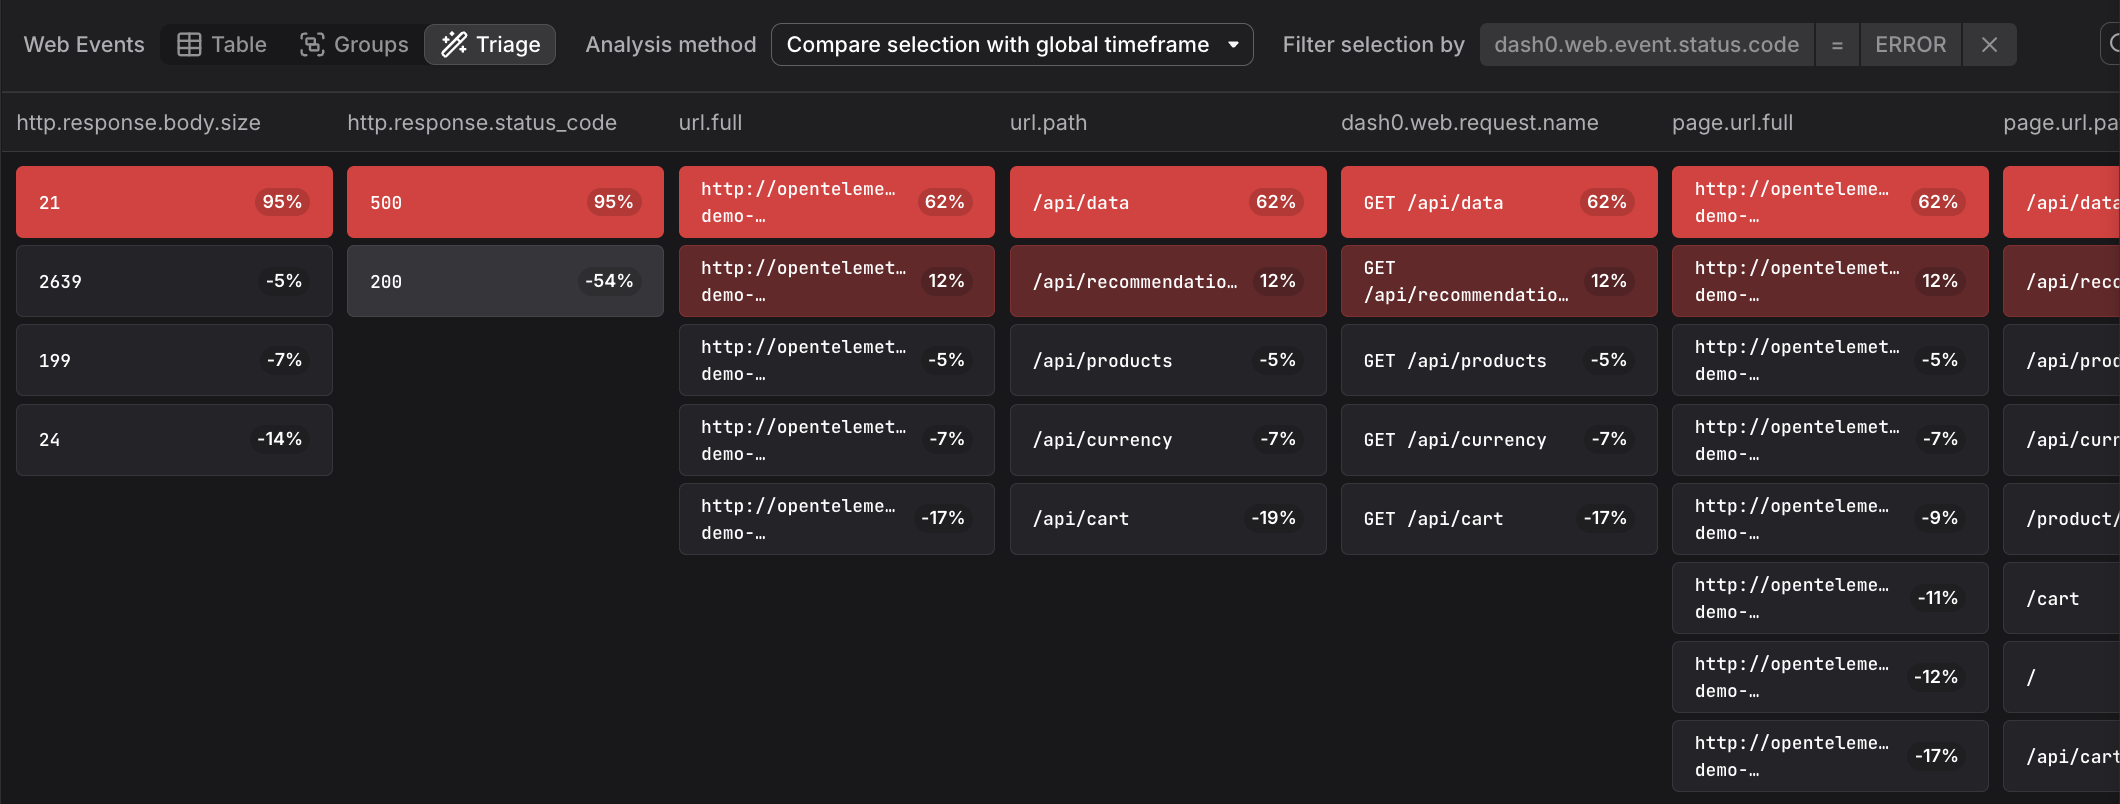
Use the Triage Tab
The Triage tab reveals which attributes correlate most strongly with the selected events, helping you identify patterns and anomalies in your web telemetry data.
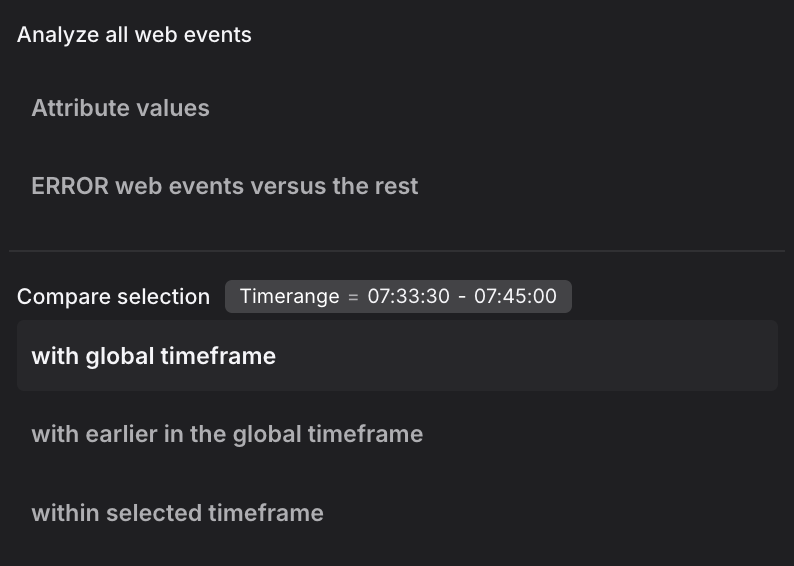
The triage analysis supports multiple analysis methods. The dropdown shows two analysis modes at the top, followed by comparison methods:
Analysis modes:
-
Attribute values: Displays the raw distribution of attribute values across all events without correlation analysis. This mode shows how attributes are distributed in your data, useful as a starting point before applying comparisons.
-
ERROR web events versus the rest: Compares error events (status code ERROR) against all non-error events within the selected time range. This mode helps identify which attributes are specifically associated with errors rather than normal operation across all event types.
Comparison methods:
When you have a focused selection (a time range brushed in the chart), these methods compare your selection against different baselines:
-
with global timeframe: Compares the selected events against all events in the entire global time window. This baseline reveals which attributes are overrepresented in your selection relative to normal behavior across the full timeframe. Use this when investigating a specific incident window to understand what makes those events different from the overall pattern.
-
with earlier in the global timeframe: Compares the selected time range against the immediately preceding period of equal duration. The baseline is the time window that comes right before your selection, extending back to the start of the global timeframe. This mode is useful for identifying changes over time, such as what attributes shifted between two adjacent periods or how a deployment affected event characteristics.
-
within selected timeframe: Compares events with longer duration against those with shorter duration within the selected time range. The selection includes events above a duration threshold, and the baseline includes faster events below that threshold, all within the same time window. This mode isolates performance-related attributes across all event types, helping you identify which contexts correlate with slow versus fast event execution.
Further Reading
- About Web Events. Overview of the Web Events Explorer and how it provides direct access to the underlying telemetry stream collected by the Dash0 Web SDK.
- Filter and Group Web Events. Covers filtering techniques, Group by controls, and table view modes to slice the event stream in different ways.
- Understand Web Event Types. Details on the schema and attributes for each built-in event type displayed in the All web events view.
- Analyze Page Views. Shows how to drill down into the
browser.page_viewevents visible in the All web events view. - Monitor JavaScript Errors. Explains how to investigate the
browser.errorevents that appear as spikes in the All web events chart.