Last updated: June 19, 2026
Monitor JavaScript Errors
The JavaScript Errors built-in view filters the event stream to browser.error events.
These are unhandled JavaScript exceptions and unhandled promise rejections captured automatically by the Web SDK — no manual instrumentation required.
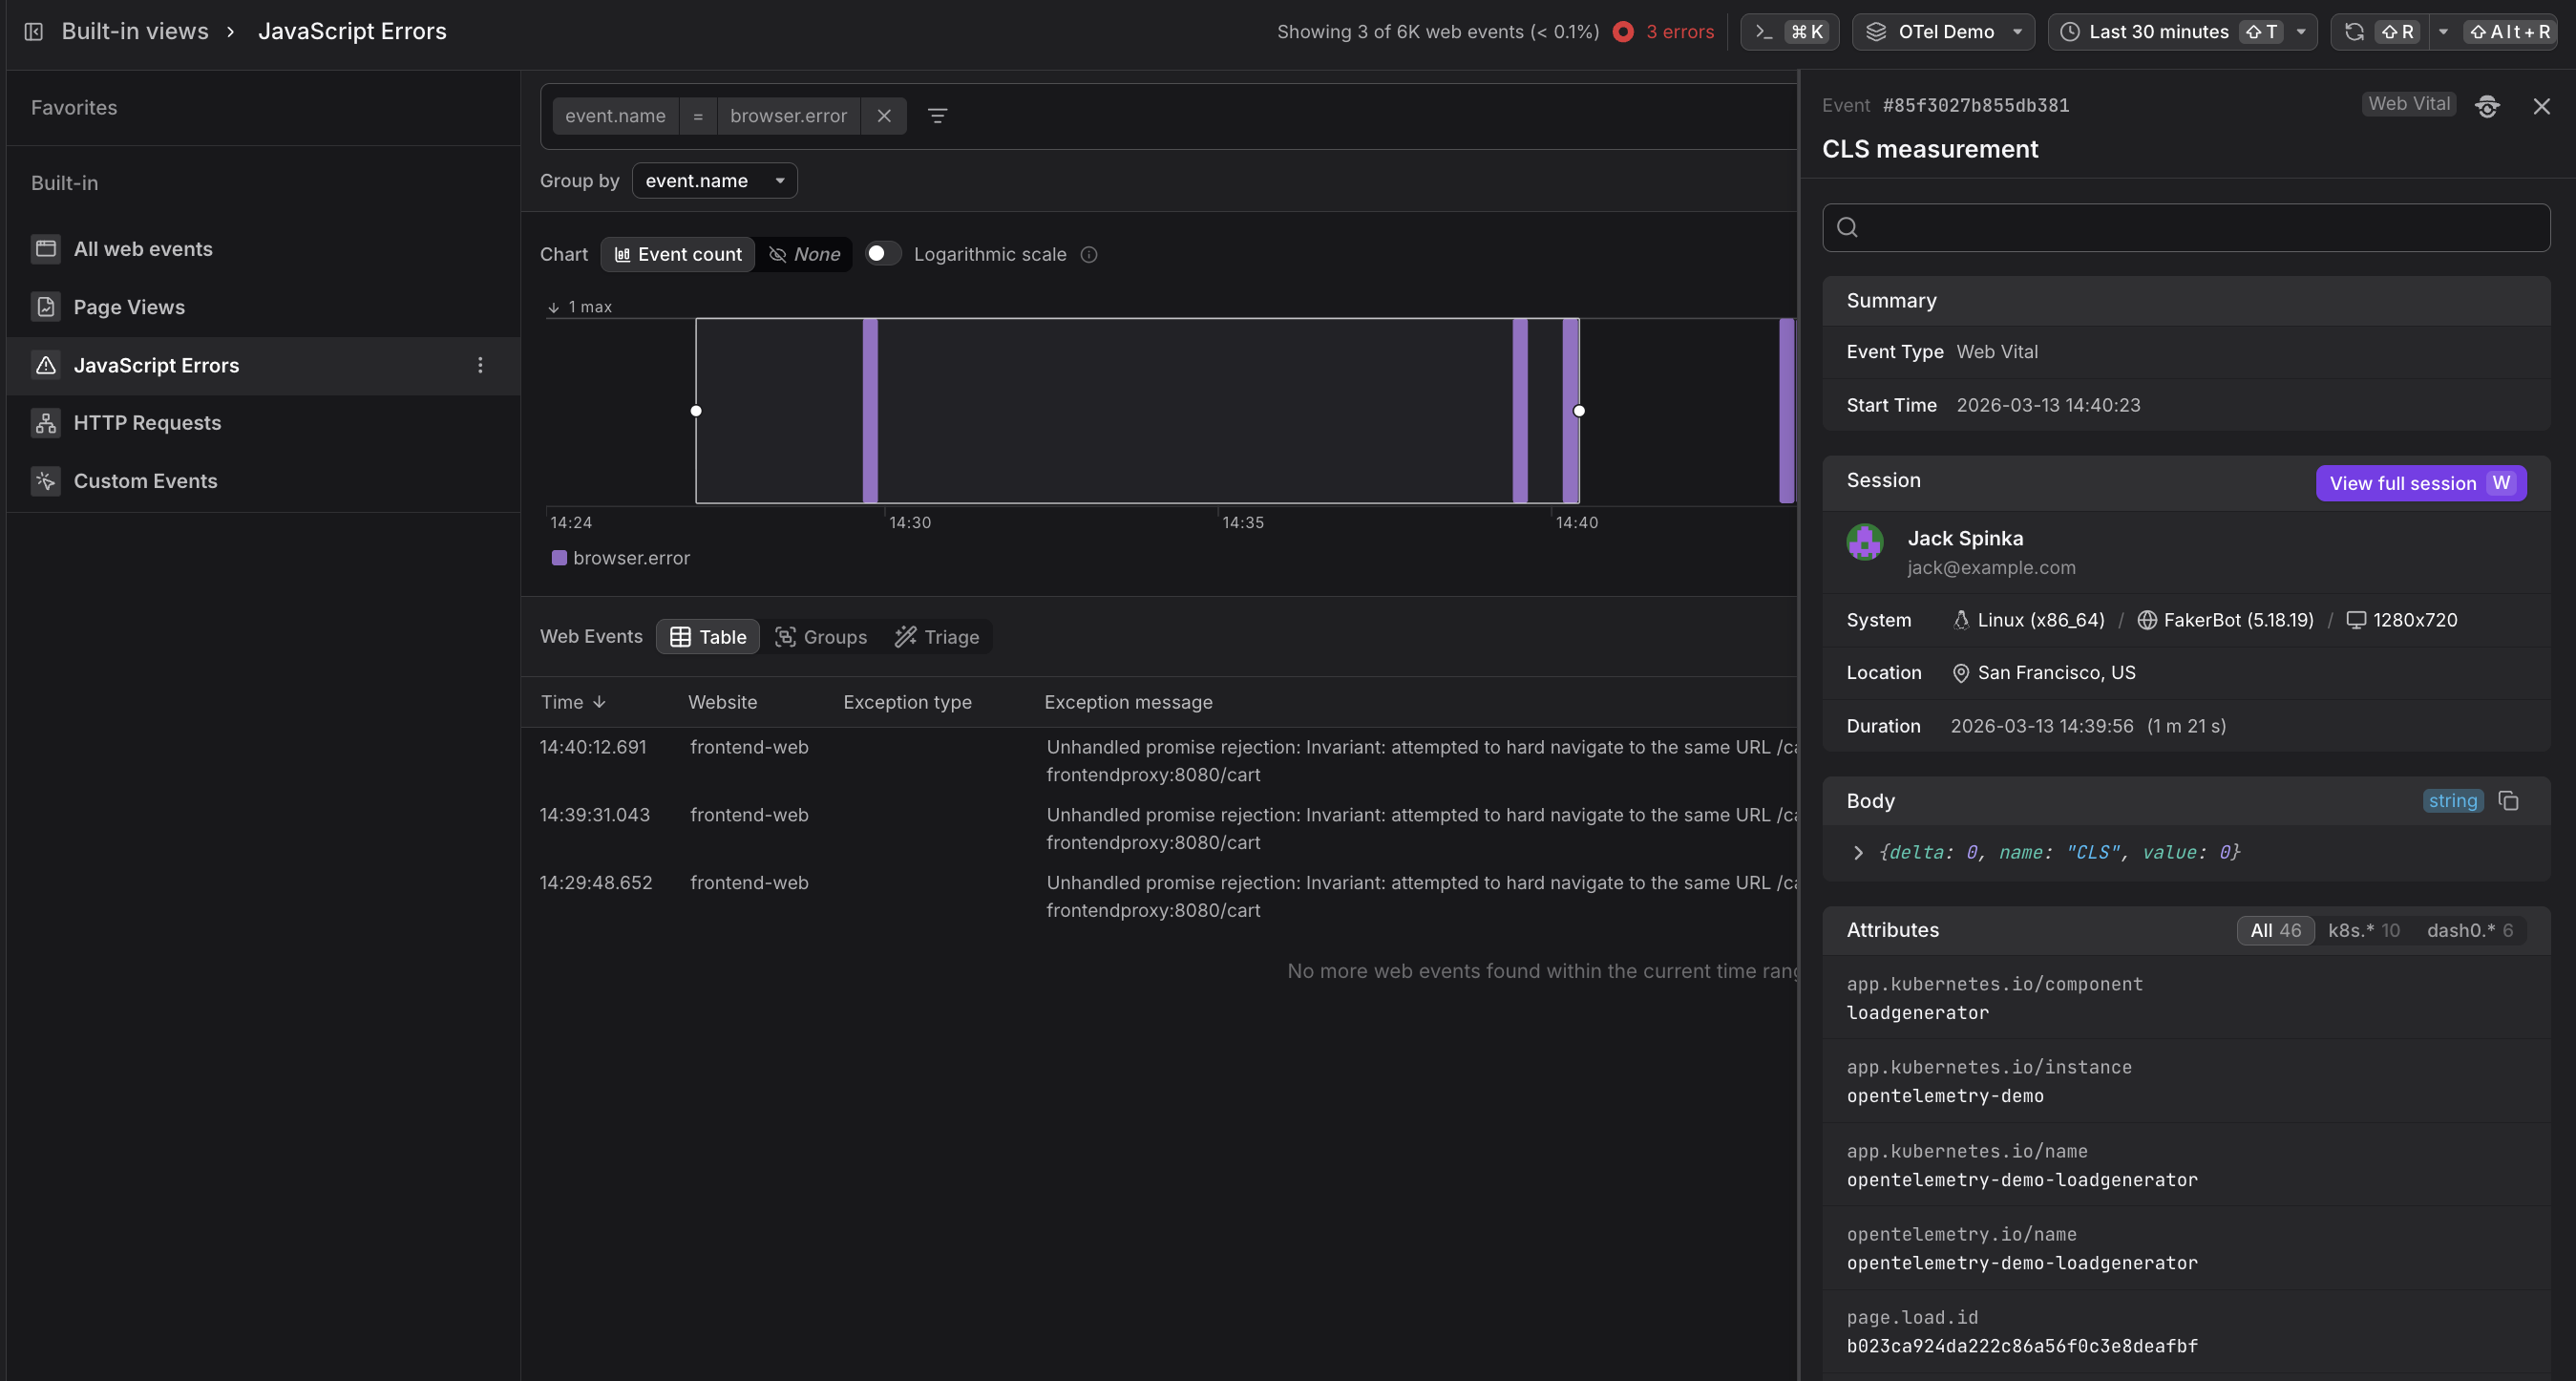
The chart shows error frequency over the selected time window. Sparse, irregular spikes typically indicate intermittent issues (race conditions, flaky APIs). A sustained baseline of errors appearing at regular intervals often points to a reproducible bug tied to a specific user action or page.
Use the Web Events Table
Below the chart, the table lists individual web events in reverse chronological order.
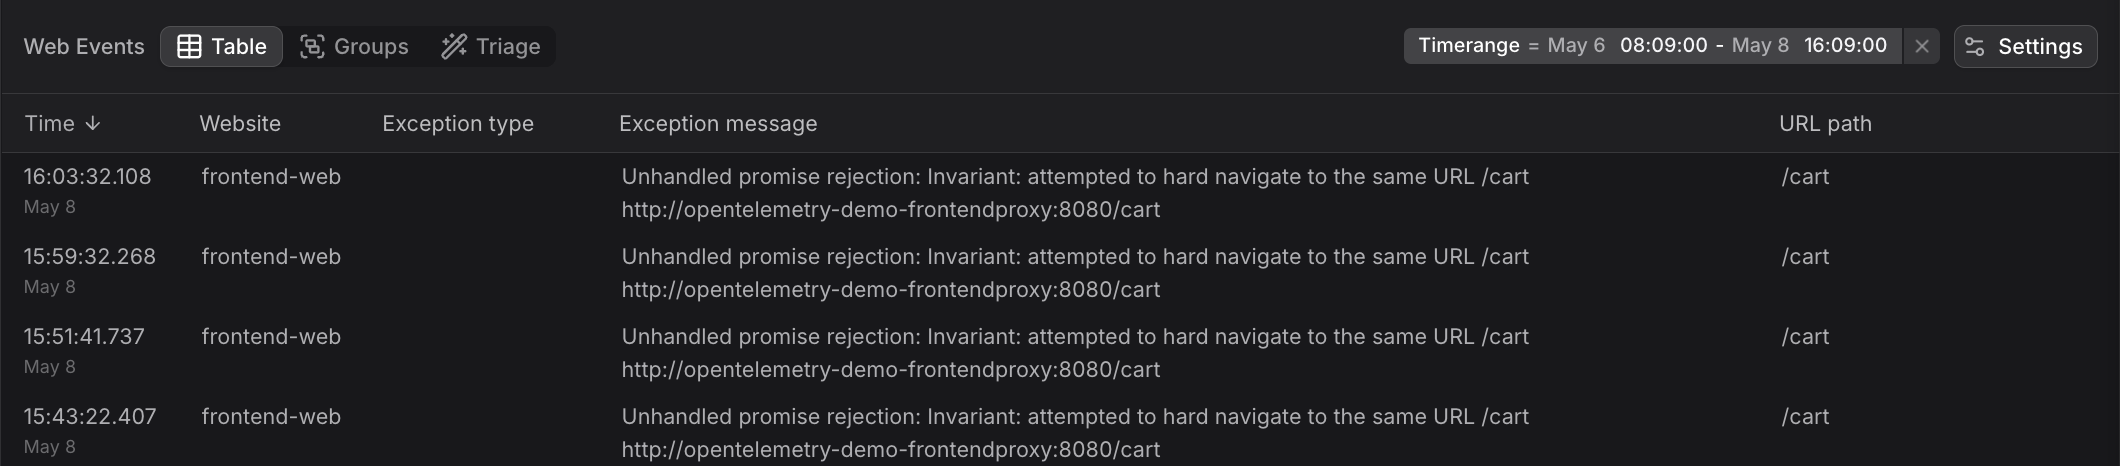
The JavaScript Errors table surfaces the columns most useful for triage:
| Column | Description |
|---|---|
| Time | When the error was thrown |
| Website | Which instrumented site the error came from |
| Exception type | The JavaScript error class (e.g. TypeError, RangeError) |
| Exception message | The full error message string |
| URL path | The page the user was on when the error occurred |
A repeated exception message across multiple rows is a strong signal of a systematic bug rather than a one-off user issue.
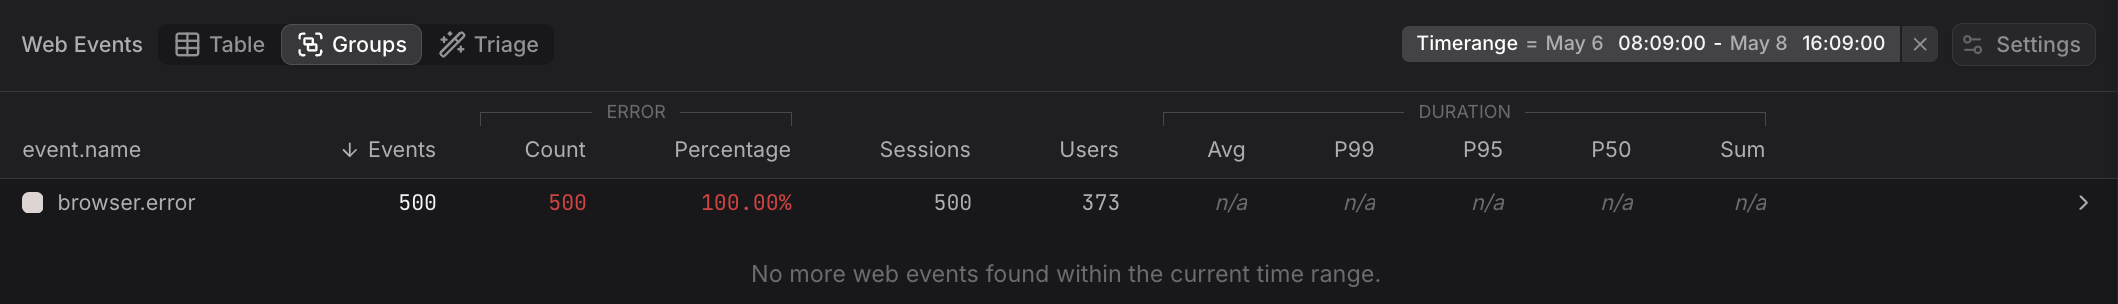
Use the Groups Tab
Switch to the Groups tab to aggregate errors by exception.message or url.path.
This immediately shows you which errors are most frequent and on which pages they concentrate — making it straightforward to prioritize what to fix first.
Use the Event Sidebar
Click any row to open the Event Sidebar.
In addition to the standard session context (user, device, location), the Body field contains the raw error payload.
The Attributes section includes metadata such as the Kubernetes component that served the page and the page load ID, which you can use to correlate the error with a specific page load event.
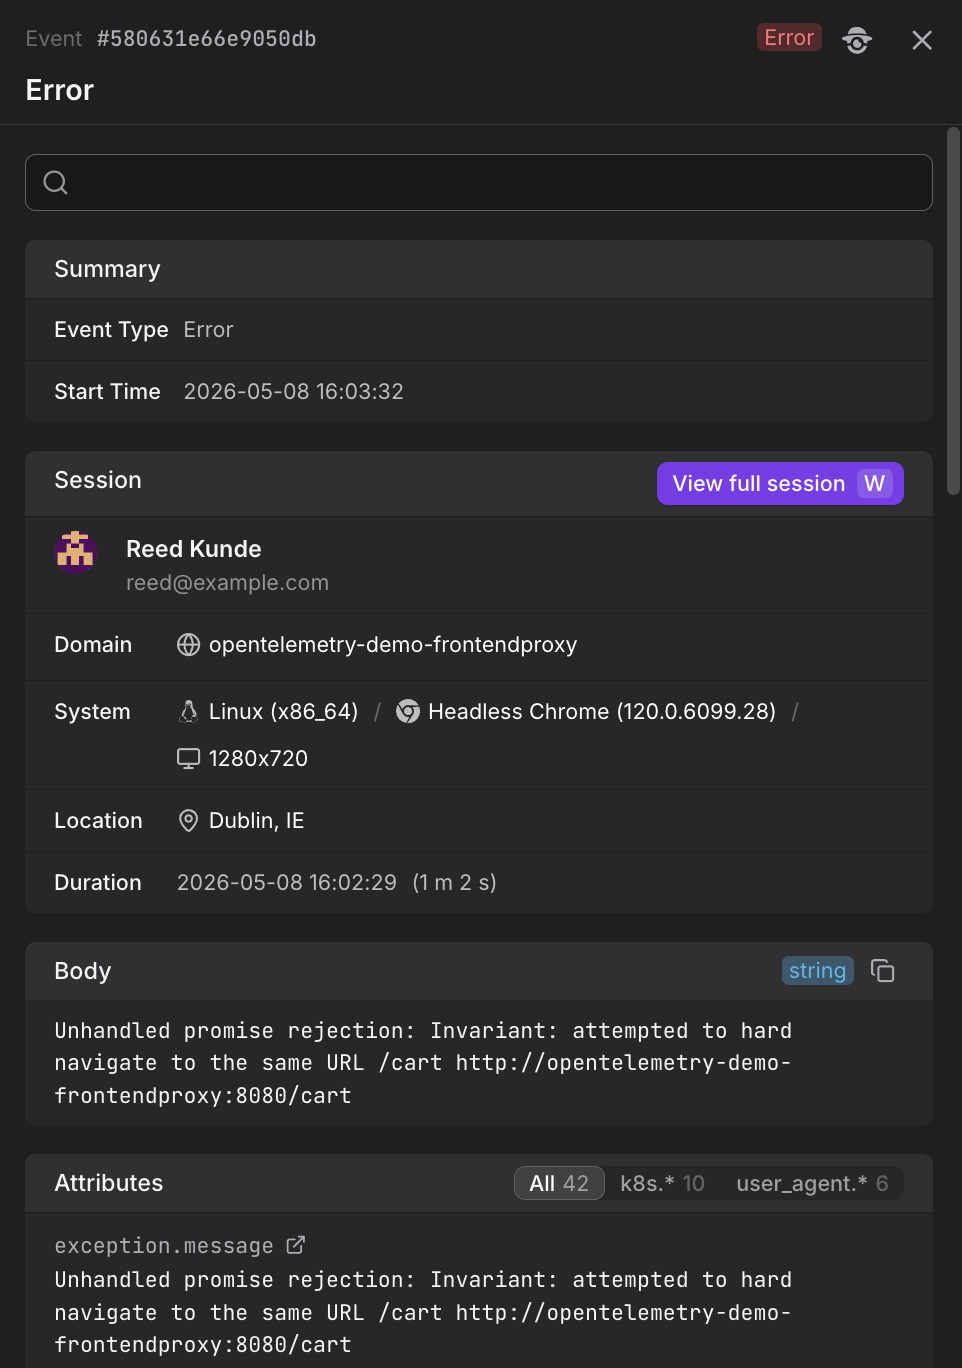
The Session section in the Event Sidebar shows which user encountered the error. Click View full session to open the full session replay in Websites and see exactly what the user was doing — including prior page views and HTTP requests — in the moments before the error was thrown.
Stack traces in production JavaScript are minified and hard to read. Dash0 automatically translates them back to original source locations using source maps. See Resolve Stack Traces with Source Maps for setup instructions and troubleshooting.
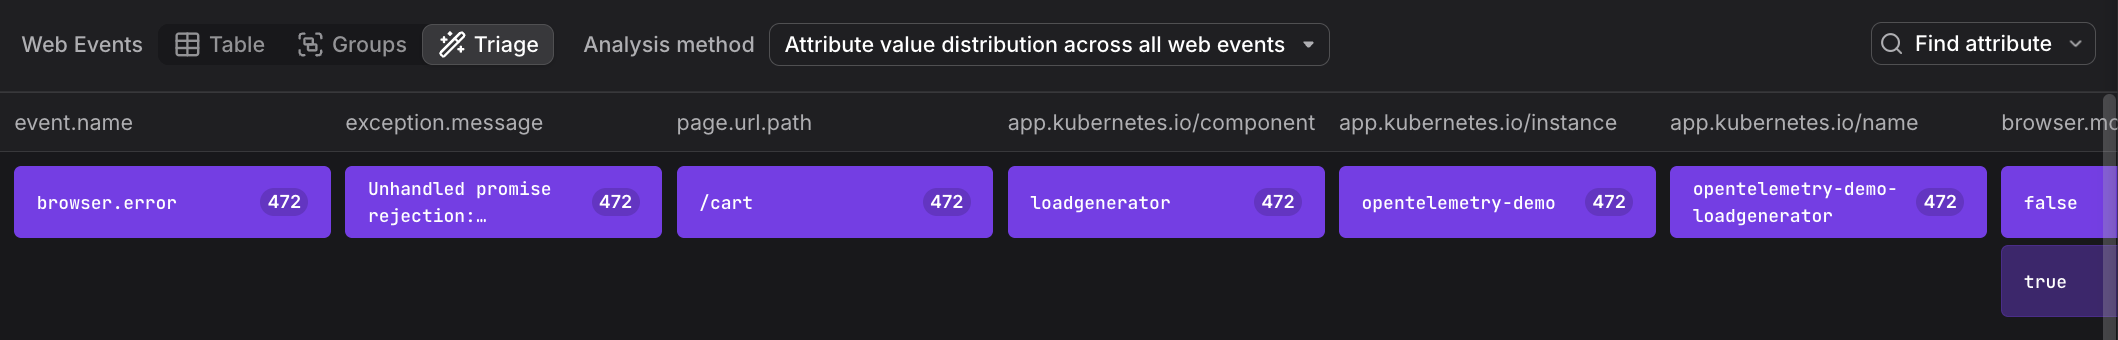
Use the Triage Tab
The Triage tab helps identify which attributes correlate with JavaScript errors, making it easier to pinpoint common causes such as specific browsers, operating systems, or user environments.
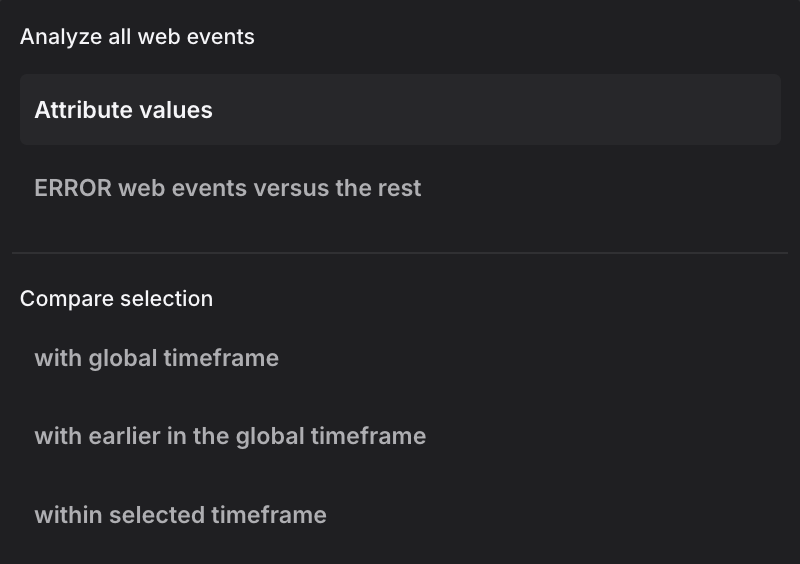
The analysis method selector supports multiple modes. The dropdown shows two analysis modes at the top, followed by comparison methods:
Analysis modes:
-
Attribute values: Displays the raw distribution of attribute values across all error events without correlation analysis. This mode shows how attributes are distributed in your error data, useful as a starting point before applying comparisons.
-
ERROR web events versus the rest: Compares error events (status code ERROR) against all non-error events within the selected time range. This mode helps identify which attributes are specifically associated with errors rather than normal operation, revealing environmental or contextual factors that correlate with failure conditions.
Comparison methods:
When you have a focused selection (a time range brushed in the chart), these methods compare your selection against different baselines:
-
with global timeframe: Compares the selected events against all events in the entire global time window. This baseline reveals which attributes are overrepresented in your selection relative to normal behavior across the full timeframe. Use this when investigating an error spike to understand what makes those error events different from the overall pattern.
-
with earlier in the global timeframe: Compares the selected time range against the immediately preceding period of equal duration. The baseline is the time window that comes right before your selection, extending back to the start of the global timeframe. This mode is useful for identifying what changed between two periods, such as which browsers, pages, or user contexts saw an increase in errors after a deployment.
Further Reading
- About Web Events. Overview of the Web Events Explorer and how the JavaScript Errors built-in view fits into the broader web events experience.
- Resolve Stack Traces with Source Maps. Explains how Dash0 automatically translates minified JavaScript stack traces in error events back to their original source locations.
- Explore All Web Events. Shows how to browse all event types including errors, and how
browser.errorevents appear in the event count chart. - Understand Web Event Types. Details on the structure of
browser.errorevents including exception type, message, and stacktrace attributes. - Filter and Group Web Events. Covers grouping techniques for aggregating errors by exception message or URL path to identify patterns.