Last updated: June 19, 2026
Use Custom Events
The Custom Events built-in view filters the event stream to events whose name does not start with browser. — in other words, all the events you have instrumented manually in your application code.
Custom events let you track business-relevant actions alongside technical telemetry, so you can answer questions like "which features are actually being used?" and "did users complete this flow after the last deployment?"
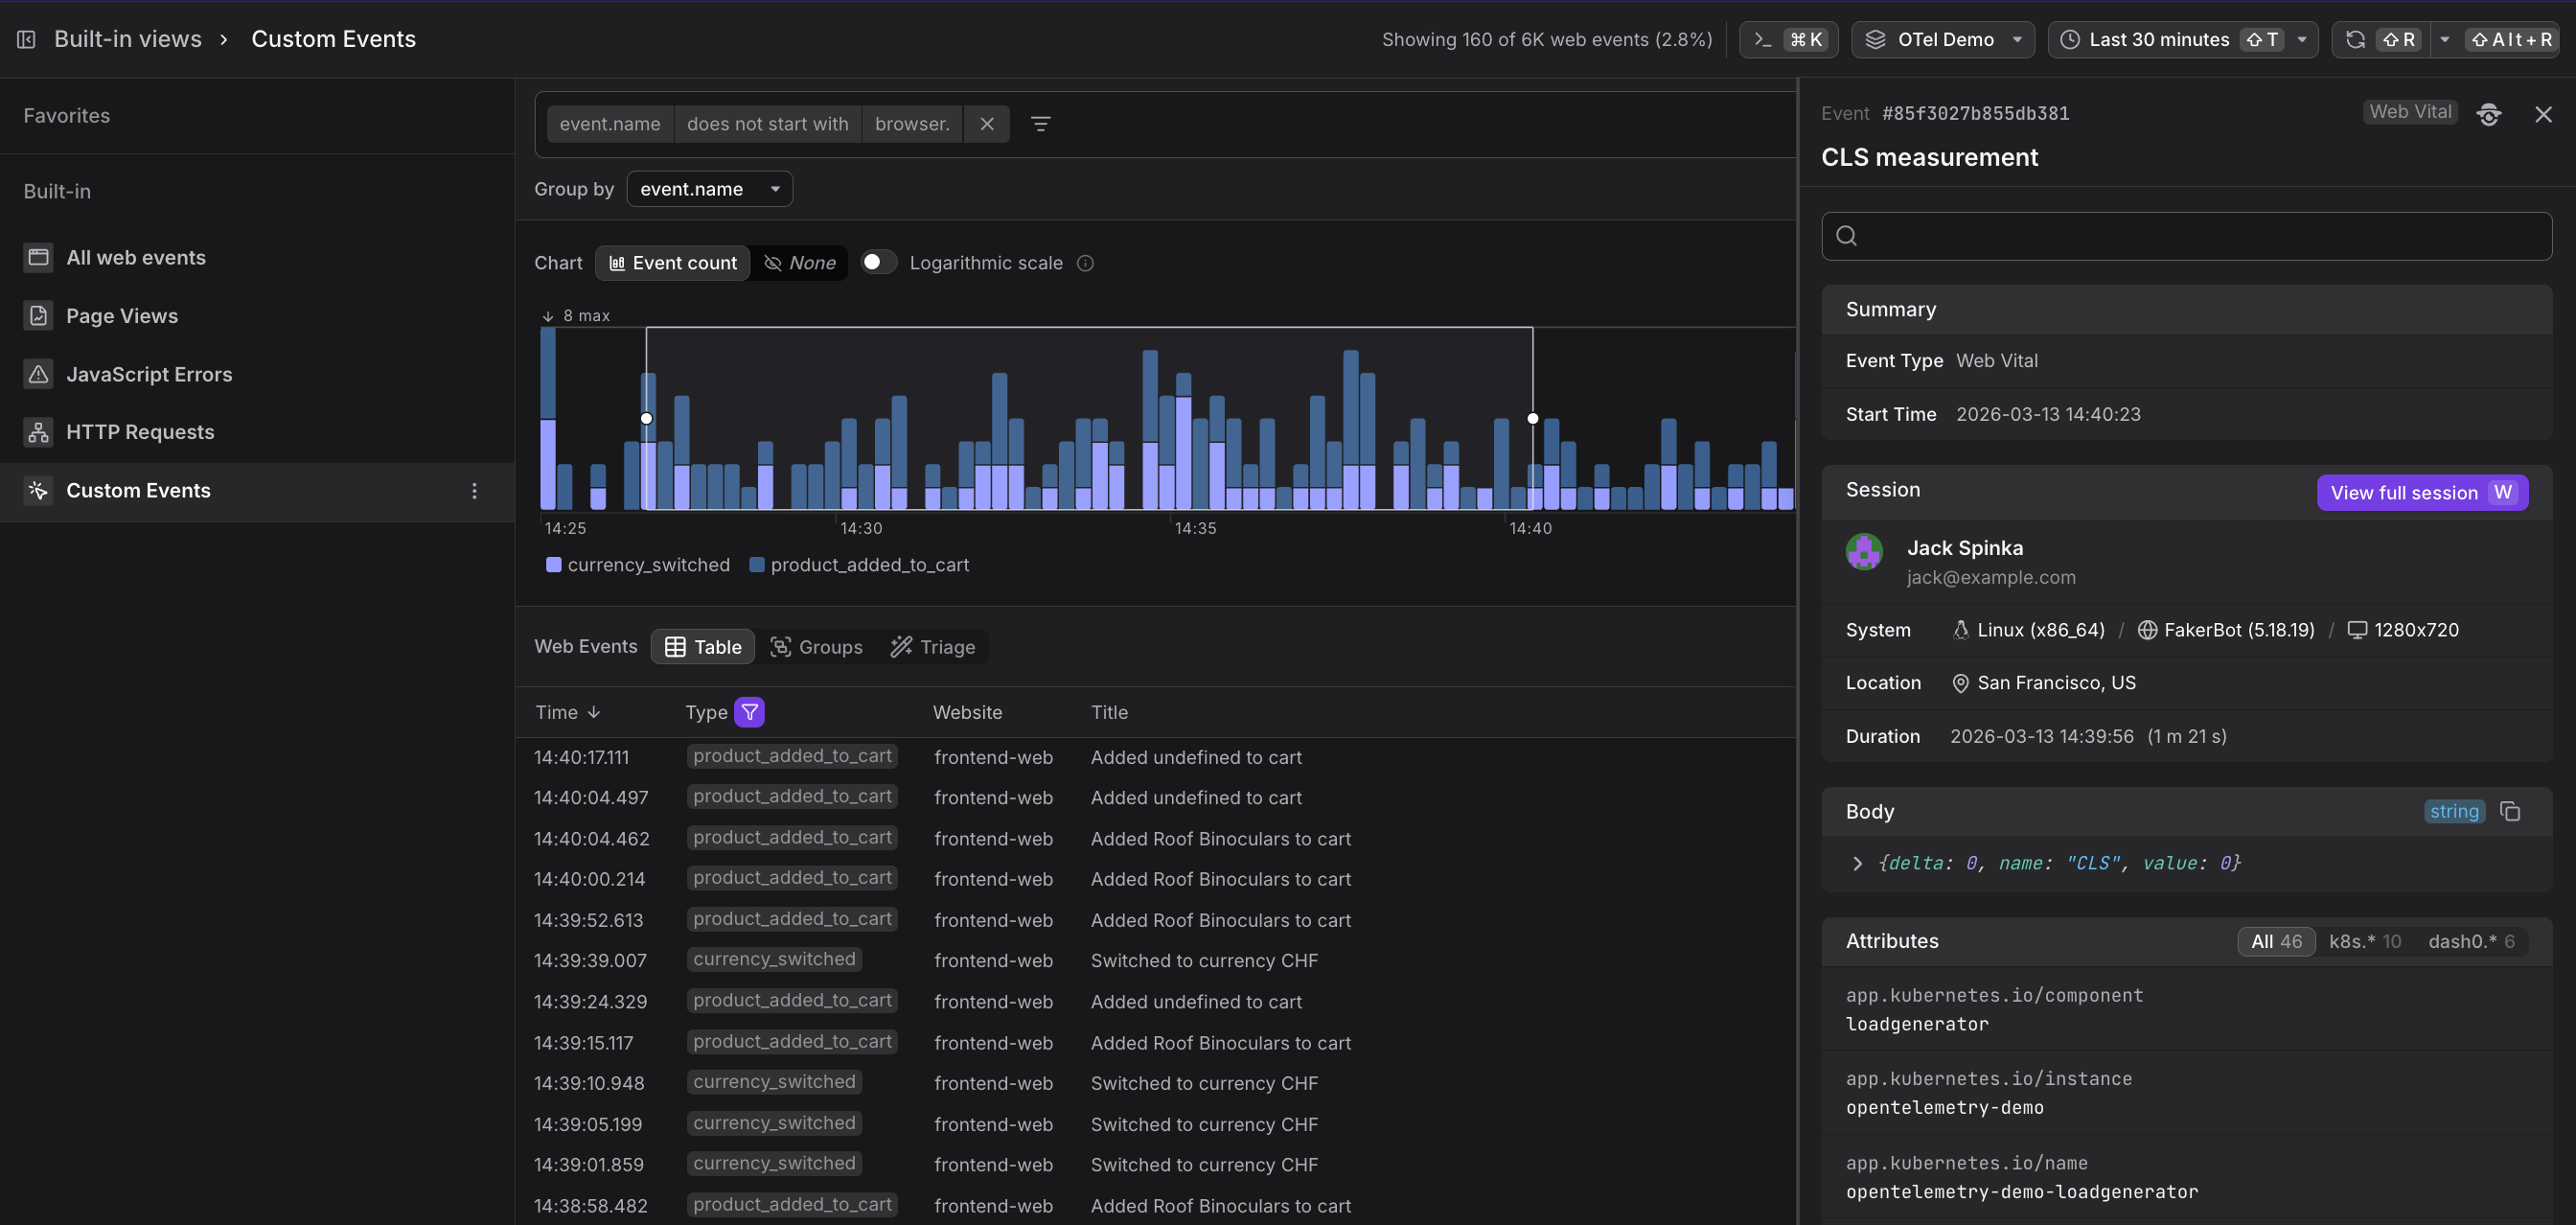
A custom event records whatever you choose to name and attach to it. In the Dash0 OTel Demo application, for example, two custom events are instrumented out of the box:
| Event name | What it tracks |
|---|---|
product_added_to_cart | A user added a product to their shopping cart |
currency_switched | A user changed the display currency |
You can instrument any meaningful action: button clicks, form submissions, feature flag exposures, funnel steps, onboarding milestones, and so on.
Add Custom Events to an Application
Use the Dash0 Web SDK's event API to emit a custom event from your JavaScript code:
12345678import { trackEvent } from '@dash0/web-sdk';trackEvent('product_added_to_cart', {product_id: item.id,product_name: item.name,price: item.price,currency: selectedCurrency,});
The event name and any attributes you pass are immediately available in the Web Events explorer, and in the Custom Events built-in view.
Use the Events Table
Below the chart, the table lists individual web events in reverse chronological order.
The Custom Events table shows individual custom events in reverse chronological order:
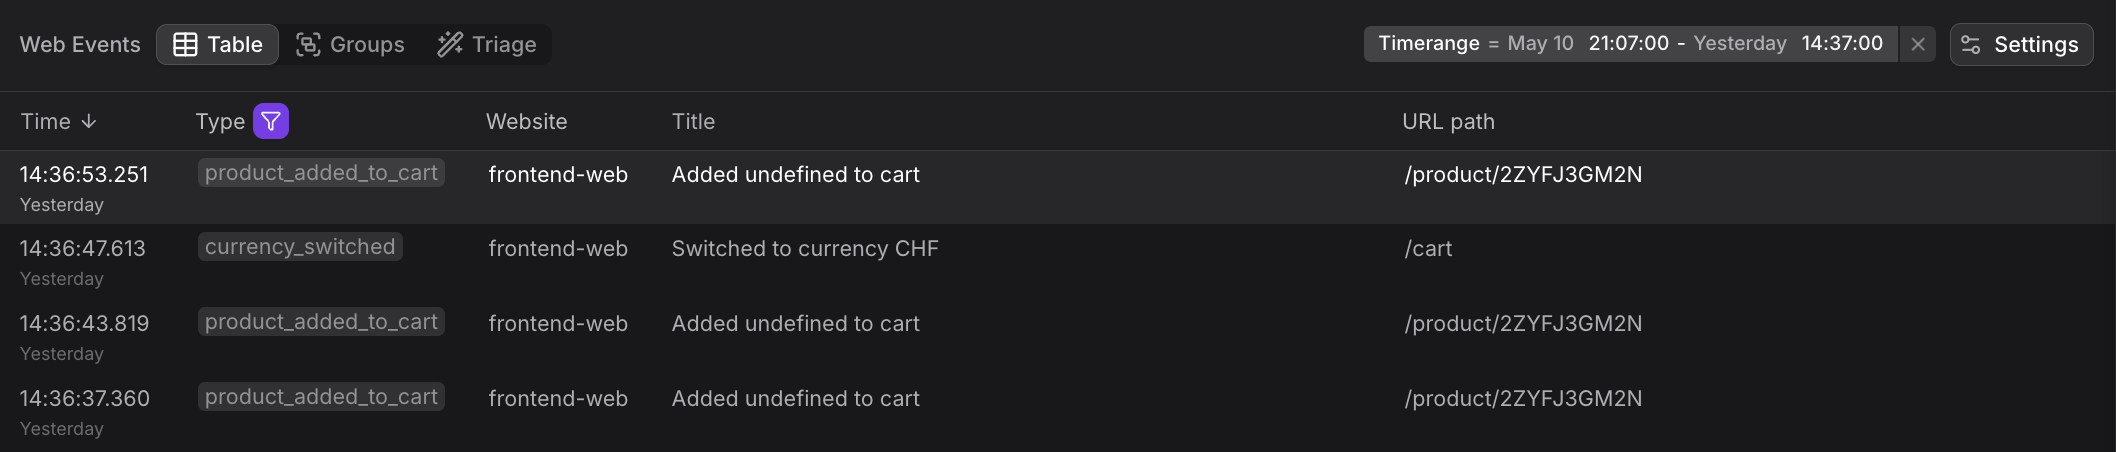
| Column | Description |
|---|---|
| Time | When the event was triggered |
| Type | The custom event name (e.g. product_added_to_cart, currency_switched) |
| Website | Which instrumented site emitted the event |
| Title | A human-readable description of the event |
| URL path | The page the user was on when the event was triggered |
Custom events appear alongside built-in browser events in the All web events view, but the Custom Events view filters exclusively to events you've instrumented. This makes it easy to focus on business-relevant user actions without technical telemetry noise.
Use the Event Sidebar
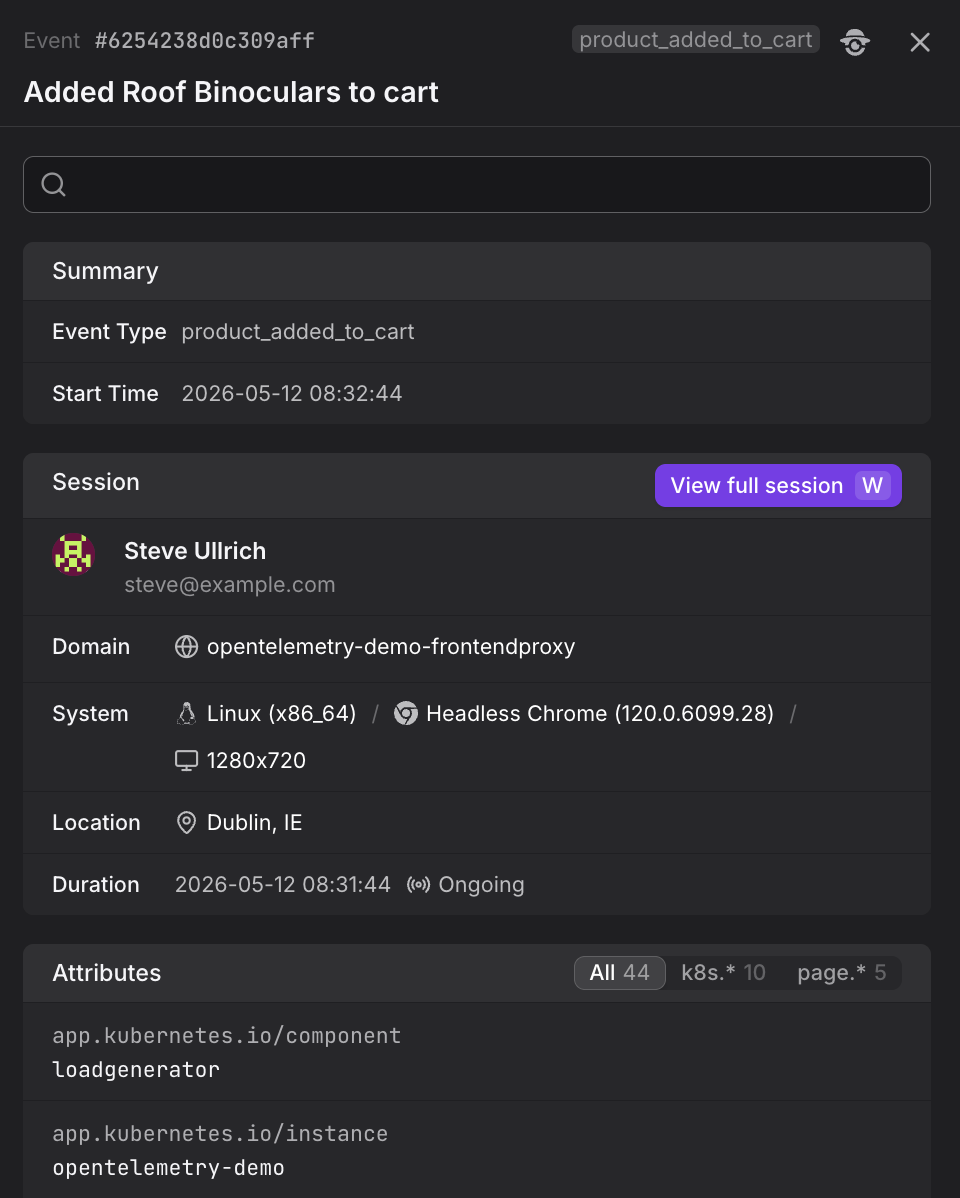
Click any row to open the Event Sidebar showing the full custom event context.
In the Event Sidebar, you will find:
- Summary — event type and exact timestamp
- Session — the user's name and email, their operating system and browser, screen resolution, geographic location, and session duration
- Body — the raw event payload including any custom attributes you passed to
trackEvent() - Attributes — all attached metadata including custom properties, page context, and infrastructure attributes
Click View full session in the Event Sidebar to open the session replay in the Websites section. This lets you see the complete user journey including what pages they visited, what HTTP requests were made, and what other custom events they triggered before and after this event.
Use the Groups Tab
Switch to the Groups tab to aggregate custom events by any attribute. By default, events are grouped by event.name, showing the count for each custom event type.
The Groups view shows aggregate statistics including event count, sessions, users, and duration metrics (where applicable).
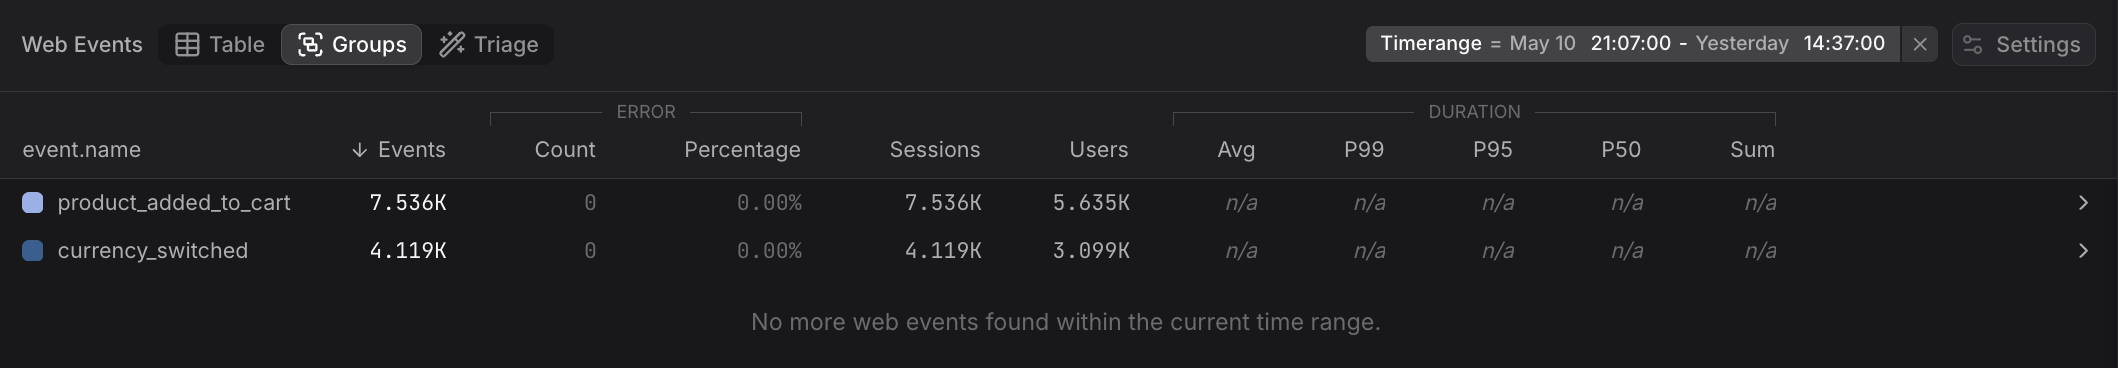
Grouping by event.name reveals which features are used most frequently and which newly shipped features have not been adopted yet. Group by page.url.path to see where in your application users are triggering specific custom events.
Use the Triage Tab
The Triage tab reveals which attributes correlate most strongly with the selected custom events, helping you identify patterns in user behavior and feature usage.
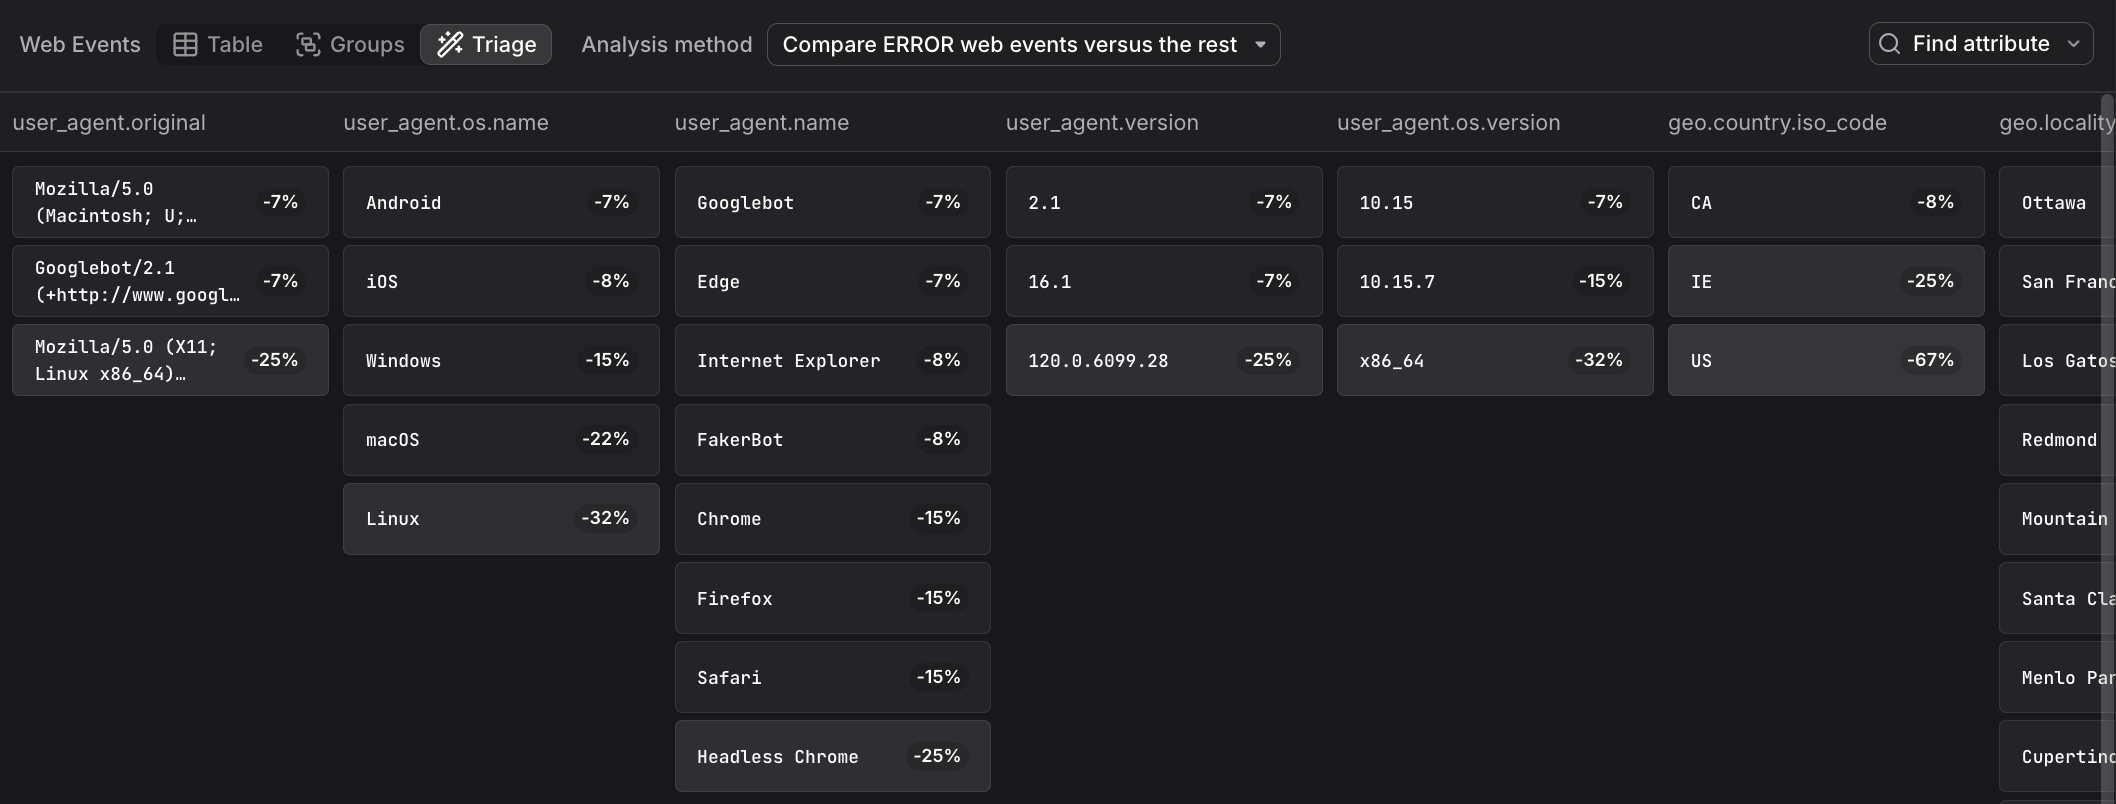
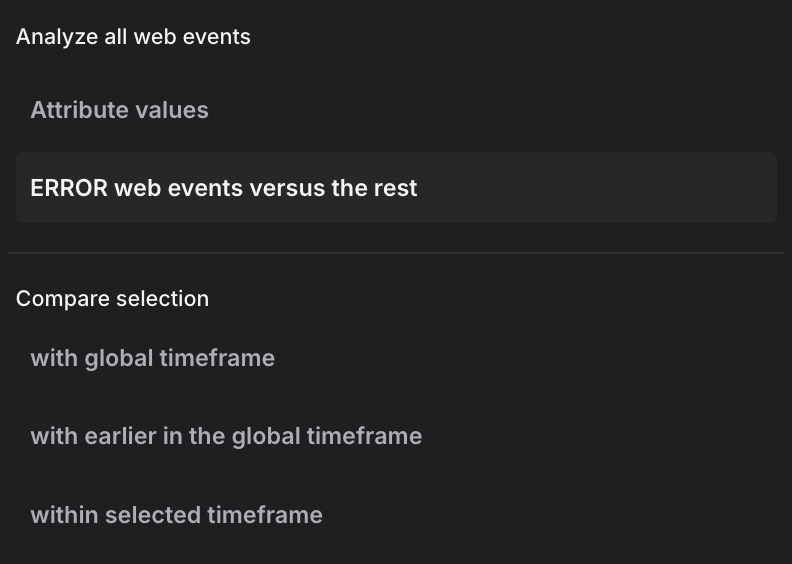
The triage analysis supports multiple analysis methods. The dropdown shows two analysis modes at the top, followed by comparison methods:
Analysis modes:
-
Attribute values: Displays the raw distribution of attribute values across all custom events without correlation analysis. This mode shows how attributes are distributed in your custom event data, useful as a starting point before applying comparisons.
-
ERROR web events versus the rest: Compares error events (status code ERROR) against all non-error events within the selected time range. This mode helps identify which attributes are specifically associated with errors rather than normal operation.
Comparison methods:
When you have a focused selection (a time range brushed in the chart), these methods compare your selection against different baselines:
-
with global timeframe: Compares the selected events against all events in the entire global time window. This baseline reveals which attributes are overrepresented in your selection relative to normal behavior across the full timeframe. Use this when investigating a feature adoption spike or drop to understand what makes those events different from the overall pattern.
-
with earlier in the global timeframe: Compares the selected time range against the immediately preceding period of equal duration. The baseline is the time window that comes right before your selection, extending back to the start of the global timeframe. This mode is useful for identifying changes over time, such as which user segments or pages saw increased feature usage after a marketing campaign or product update.
-
within selected timeframe: Compares custom events with longer associated session duration against those with shorter duration within the selected time range. This mode helps identify which contexts or user behaviors correlate with longer versus shorter engagement patterns.
Use Cases
Custom events enable several powerful analysis patterns that combine business metrics with technical telemetry.
Analyze Feature Adoption
Group custom events by event.name to see the relative volume of different user actions and understand which features are being used most frequently.
Combine Custom Events with Technical Telemetry
Because custom events live in the same event stream as browser.request and browser.web_vital events, you can filter to a time window around a specific custom event and immediately see the HTTP requests, page loads, and web vital scores that accompanied it.
This makes it straightforward to answer questions like "what was the page performance like for users who completed a purchase?"
Use Custom Events in Alerts
Custom events can be used as the signal in Dash0 alerts.
For example, you can alert when the rate of product_added_to_cart events drops below a threshold — an early warning that a checkout flow may be broken — without waiting for explicit error reports.
Further Reading
- About Web Events. Overview of the Web Events Explorer including the Custom Events built-in view that filters to non-
browser.*events. - Explore All Web Events. Shows how custom events appear in the All web events view alongside built-in browser events in the event count chart and table.
- Filter and Group Web Events. Covers filtering and grouping techniques to analyze custom events by event name or other attributes.
- Understand Web Event Types. Explains the structure of custom events compared to the built-in browser event types.
- Set Up the Web SDK. Installation instructions for the Dash0 Web SDK that provides the
trackEvent()API for instrumenting custom events.