Last updated: June 19, 2026
Analyze Page Views
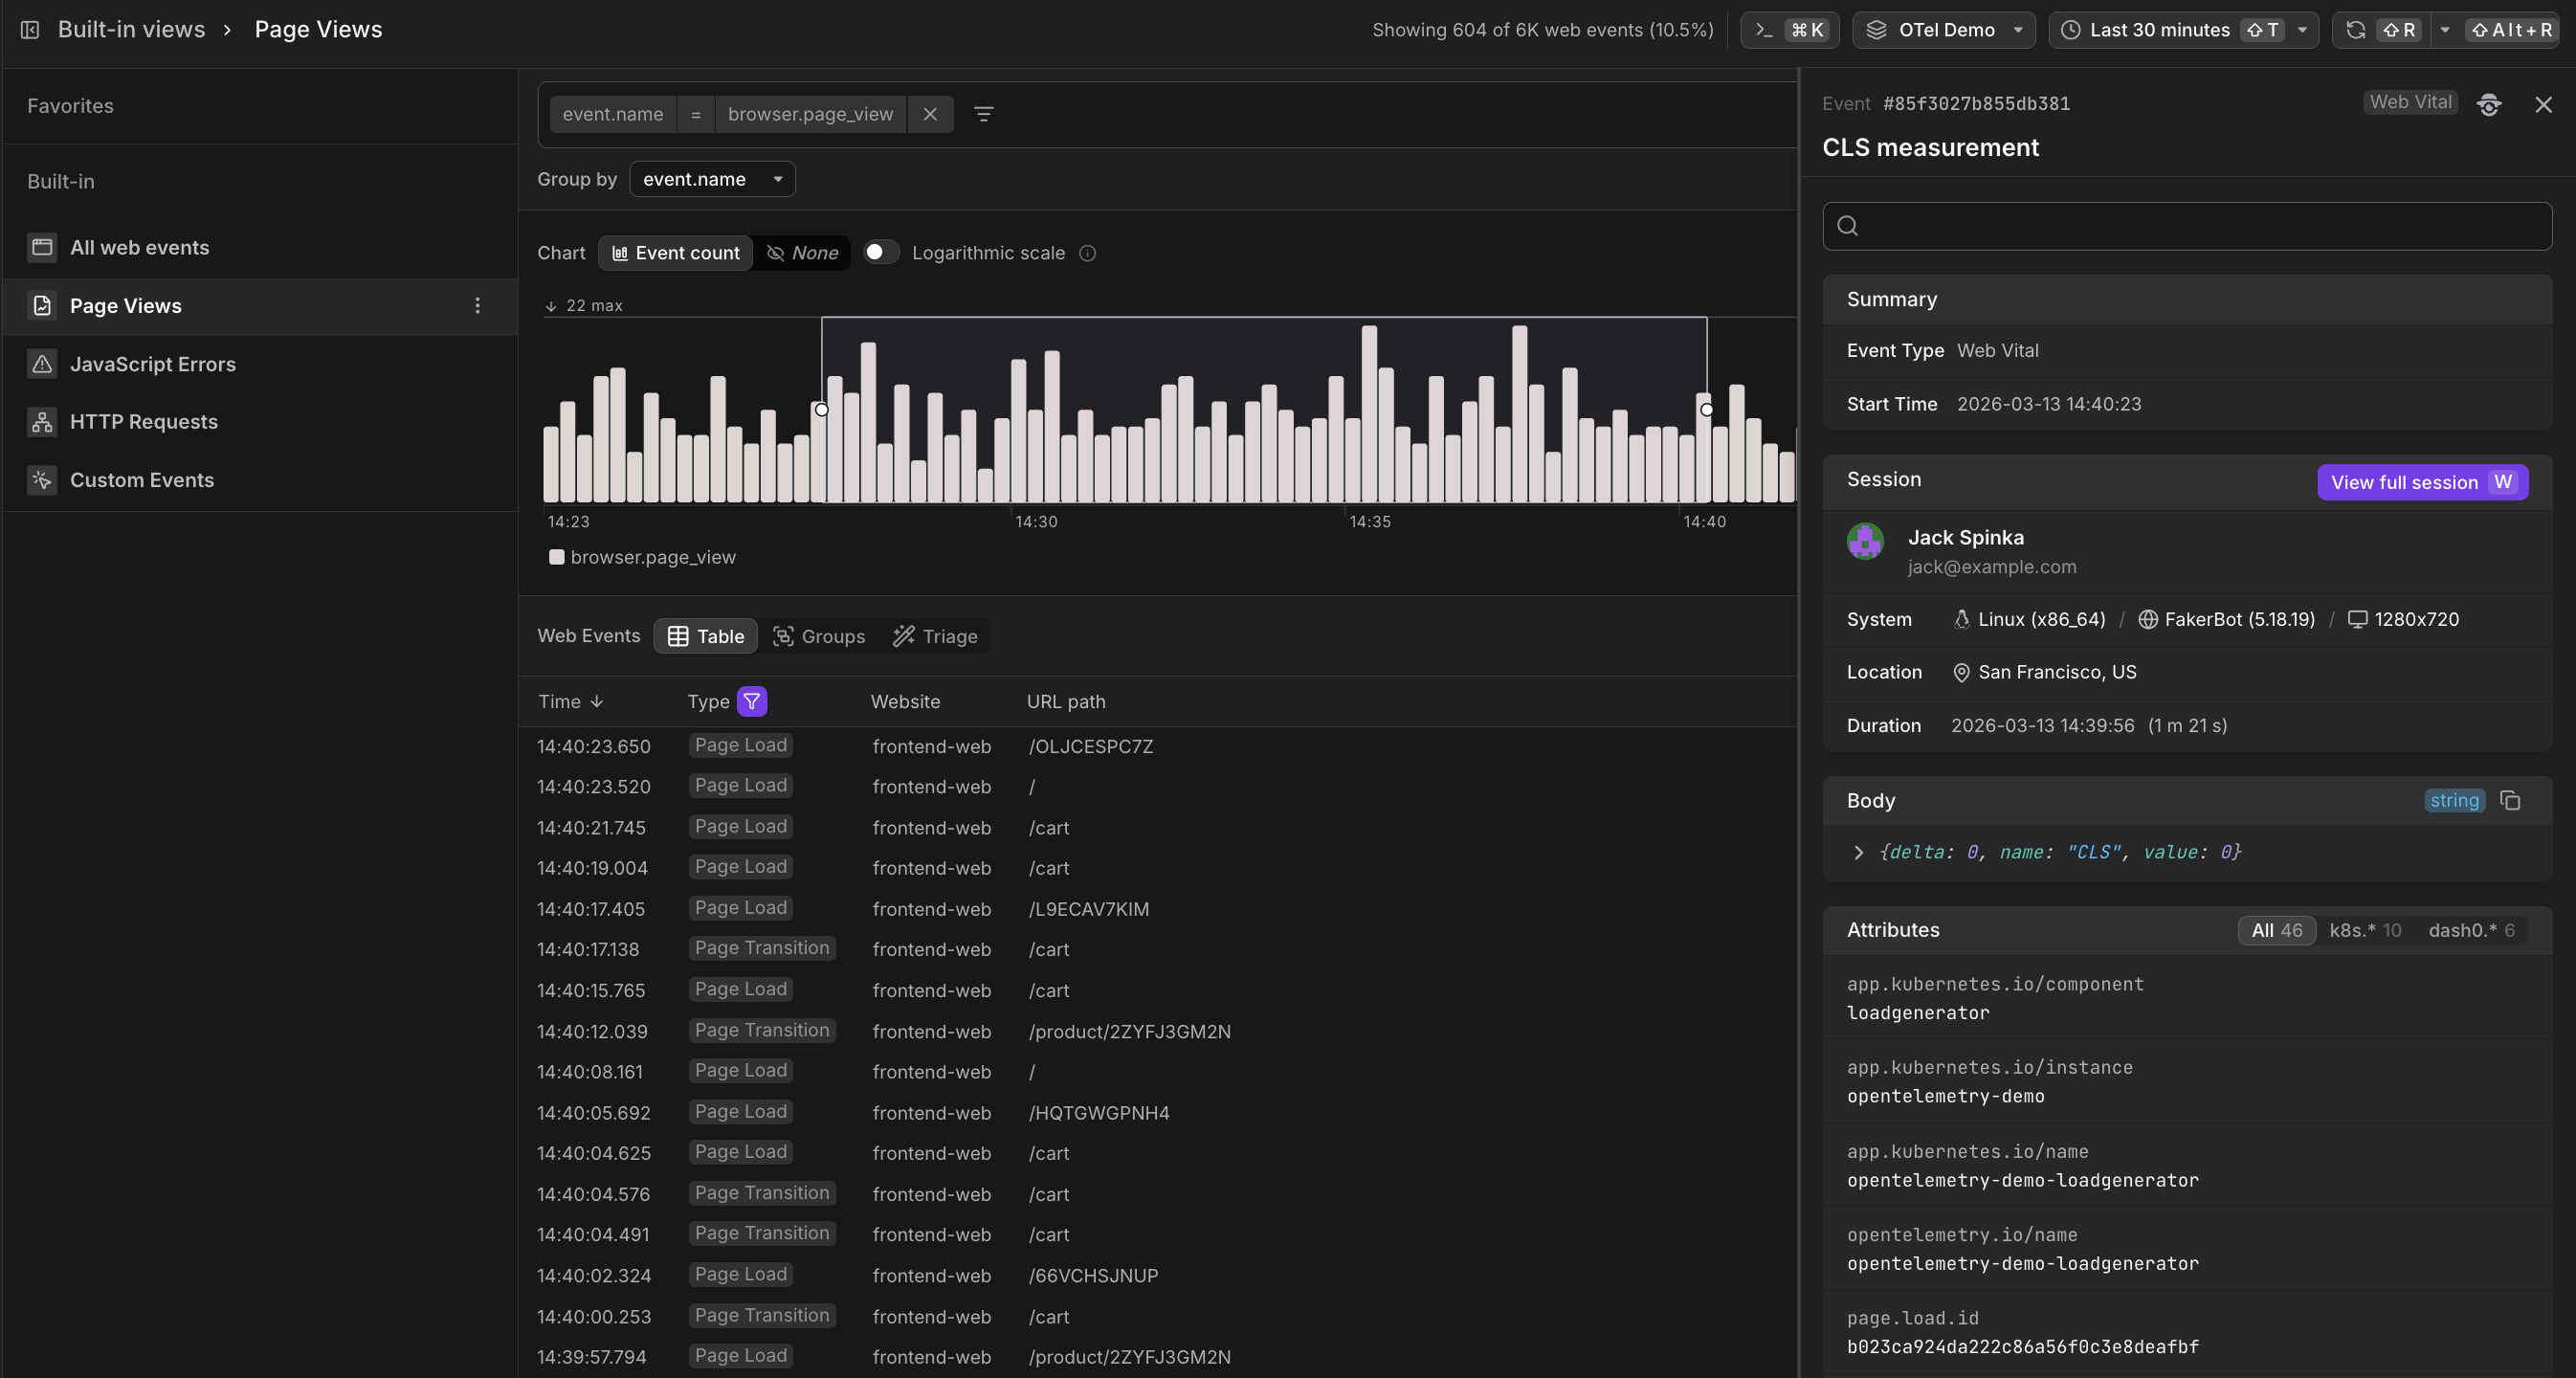
The Page Views built-in view filters the event stream to browser.page_view events only.
Use it to understand how users navigate your website — which pages are visited most, how often users arrive via a full page load versus a single-page transition, and where in a session a navigation occurred.
Every page view event carries one of two Types:
| Type | What it means |
|---|---|
| Page Load | A full browser reload. The entire page is fetched, the DOM is constructed, and navigation timing data is recorded. |
| Page Transition | A client-side navigation within a single-page application (SPA). The framework swaps content without a full reload, so no new navigation timing event is generated. |
Modern web apps are Single Page Applications (SPAs): the app loads once, and subsequent navigation produces Page Transition events. A Page Load event appears when a user first opens the app, or when they hard-refresh the page. In the session timeline, Page Loads are displayed as a full circle and Page Transitions as a line.
Use the Web Events Table
Below the chart, the table lists individual web events in reverse chronological order.
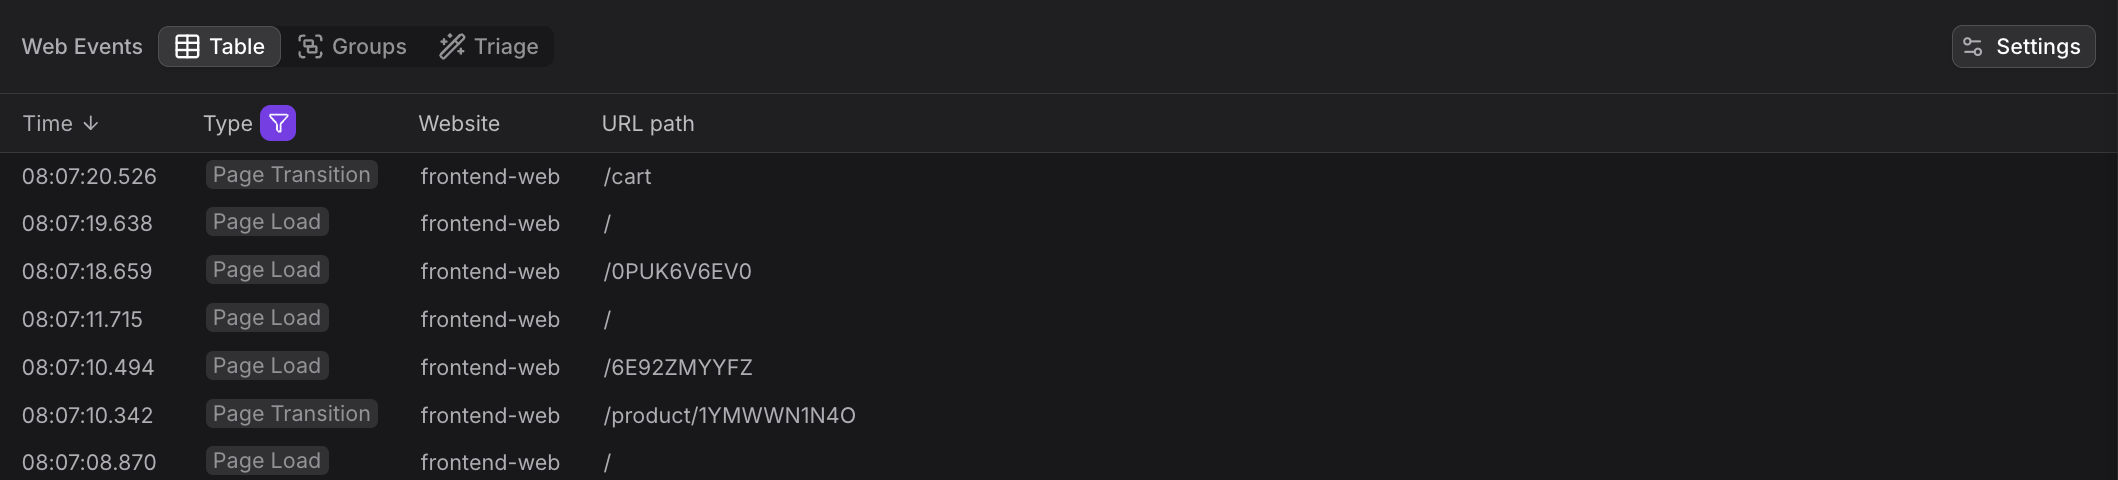
The Page Views table shows:
| Column | Description |
|---|---|
| Time | When the navigation occurred |
| Type | Page Load or Page Transition |
| Website | Which instrumented site |
| URL path | The path the user landed on (e.g. /cart, /product/2ZYFJ3GM2N) |
To focus on a single path, add a filter on url.path. The chart updates immediately to show traffic for that path only, and the table shows the individual load and transition events.
Use the Event Sidebar
Page load events are closely related to web vital scores. When you open a Page Load event's Event Sidebar, you can see all events from the same timestamp cluster — including the browser.navigation_timing event that captures DOM construction time, and any browser.web_vital events (LCP, CLS) that were recorded as the page painted.
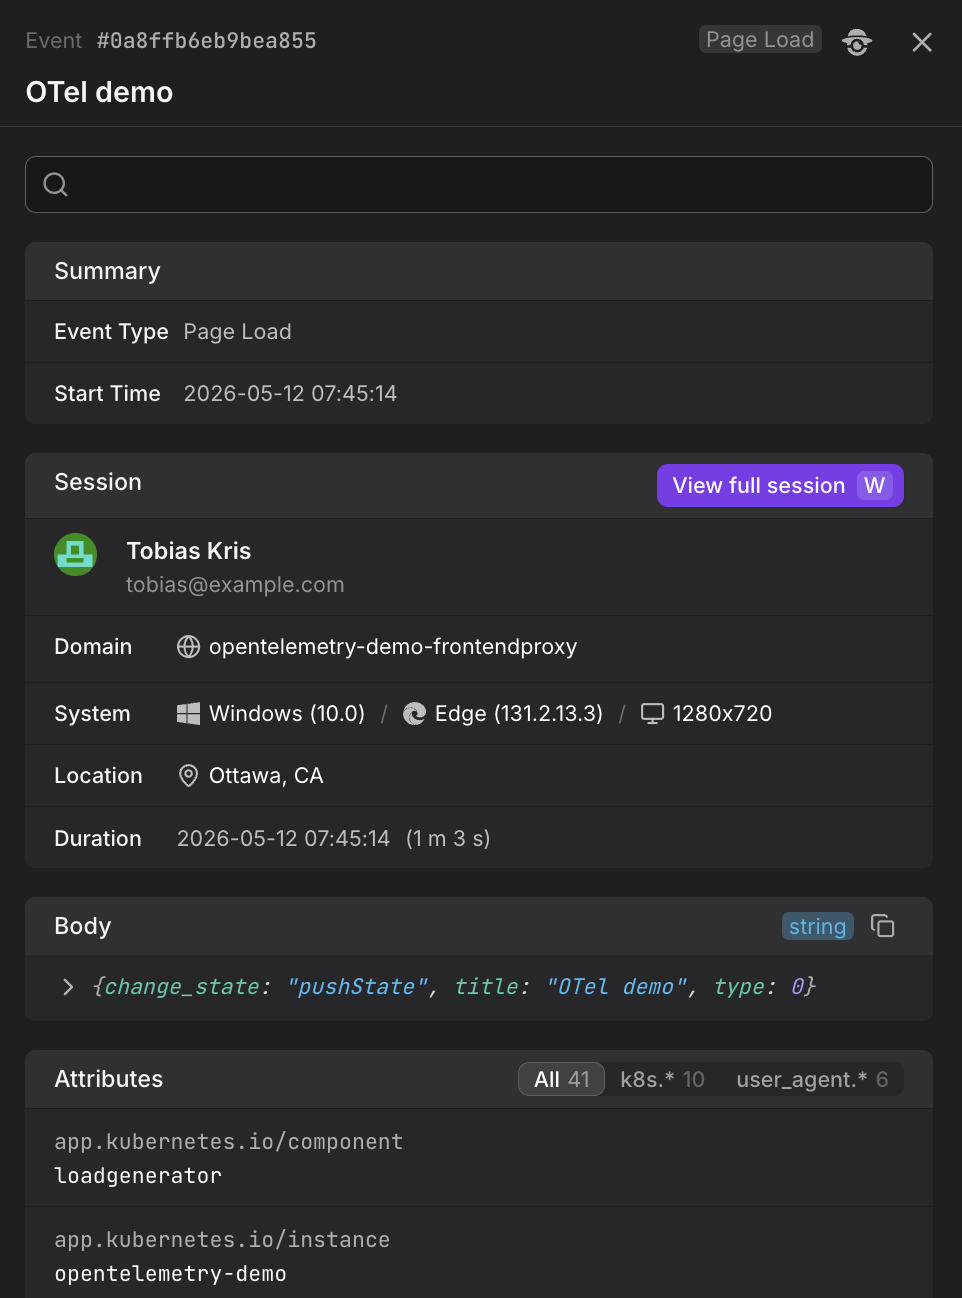
Click View full session in the Event Sidebar to open the session replay in the Websites section. This lets you see the full navigation sequence — all tabs, all pages, and all HTTP requests — that surrounded the page view you were investigating.
To understand how page views fit into the complete session timeline with cross-tab tracking, see Investigate Sessions and View Session Details.
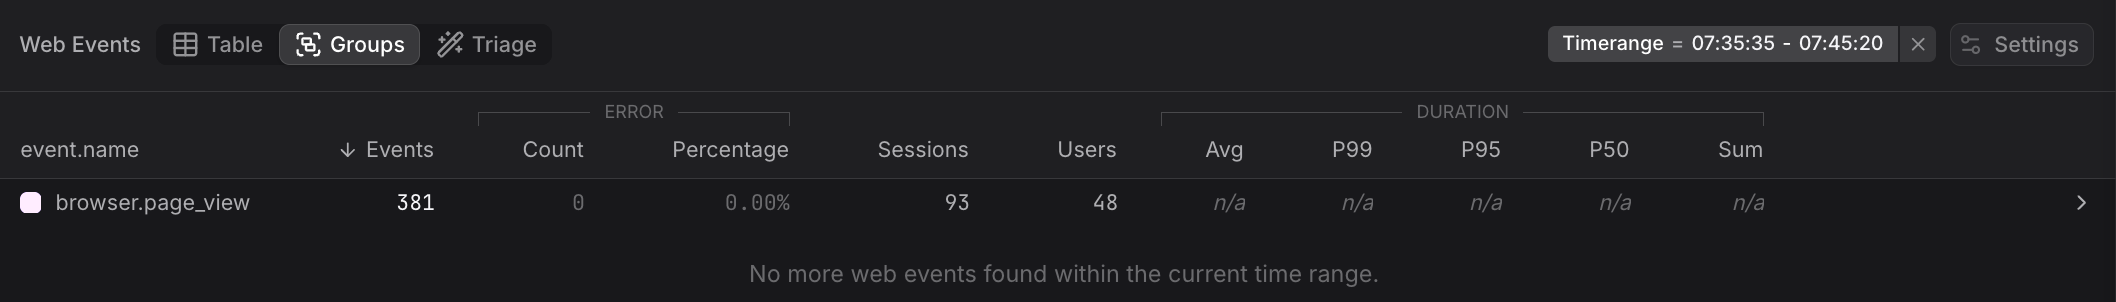
Use the Groups Tab
Switch to the Groups tab to aggregate page views by any attribute such as url.path or session.country.
This view shows event counts per group, making it easy to identify the most frequently visited pages or compare traffic across different dimensions.
Use the Triage Tab
The Triage tab helps identify which attributes correlate most strongly with the selected events.
Switch to Triage mode to see a table of attribute values ranked by correlation strength. This makes it easy to spot patterns such as which browsers, devices, or geographic regions are associated with specific navigation behaviors.
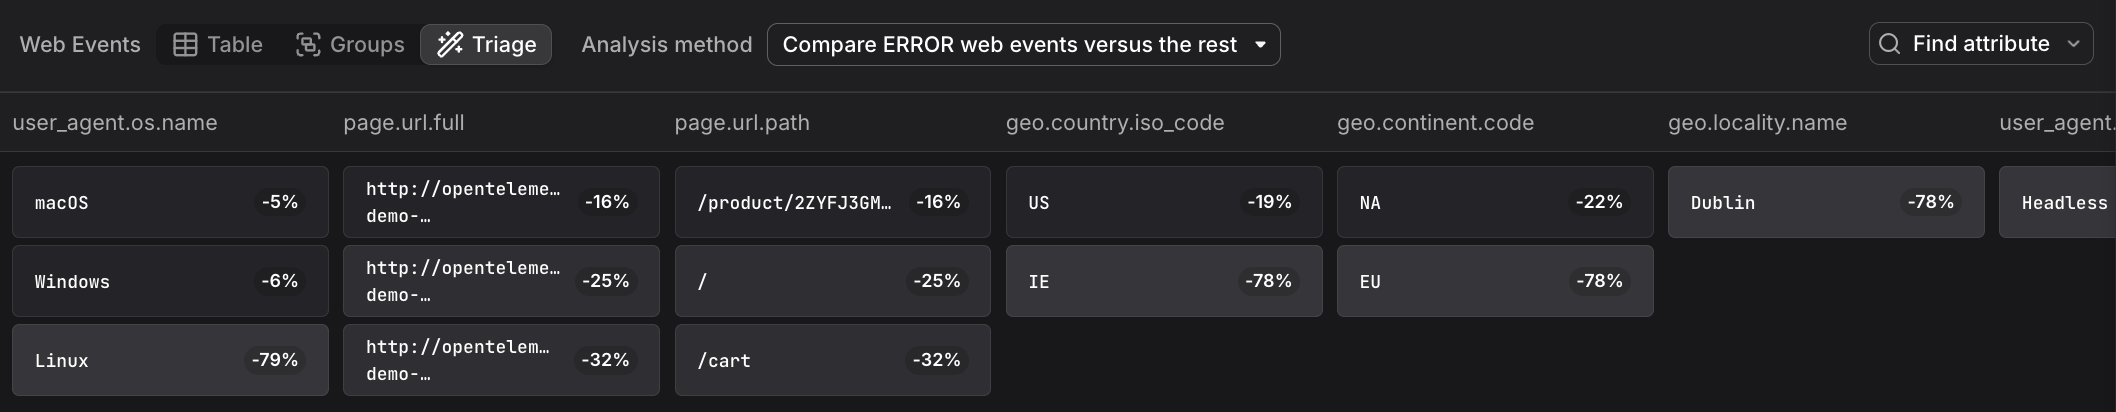
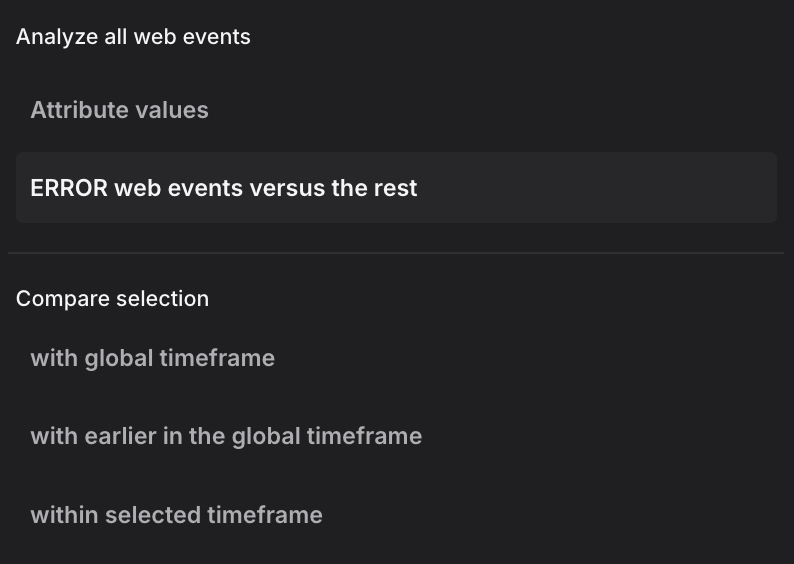
The triage view supports multiple analysis methods. The dropdown shows two analysis modes at the top, followed by comparison methods:
Analysis modes:
-
Attribute values: Displays the raw distribution of attribute values across all events without correlation analysis. This mode shows how attributes are distributed in your data, useful as a starting point before applying comparisons.
-
ERROR web events versus the rest: Compares error events (status code ERROR) against all non-error events within the selected time range. This mode helps identify which attributes are specifically associated with errors rather than normal operation.
Comparison methods:
When you have a focused selection (a time range brushed in the chart), these methods compare your selection against different baselines:
-
with global timeframe: Compares the selected events against all events in the entire global time window. This baseline reveals which attributes are overrepresented in your selection relative to normal behavior across the full timeframe. Use this when investigating a specific incident window to understand what makes those events different from the overall pattern.
-
with earlier in the global timeframe: Compares the selected time range against the immediately preceding period of equal duration. The baseline is the time window that comes right before your selection, extending back to the start of the global timeframe. This mode is useful for identifying changes over time, such as what attributes shifted between two adjacent periods or how a deployment affected event characteristics.
-
within selected timeframe: Compares slower page views against faster ones within the selected time range. The selection includes events above a duration threshold, and the baseline includes faster events below that threshold, all within the same time window. This mode isolates performance-related attributes, helping you identify which browsers, pages, or user contexts correlate with slow versus fast navigation timing.
Further Reading
- About Web Events. Overview of the Web Events Explorer and how the Page Views built-in view fits into the broader web events experience.
- Explore All Web Events. Explains how to use the All web events view to browse all event types, including page views alongside HTTP requests and web vitals.
- Understand Web Event Types. Details on the structure of
browser.page_viewandbrowser.navigation_timingevents, including the difference between Page Load and Page Transition types. - Investigate Sessions. Shows how page views appear in the session detail panel's page flow timeline, with visual indicators distinguishing Page Load from Page Transition events.
- Filter and Group Web Events. Covers filtering and grouping techniques to narrow page views by URL path, browser, or other attributes.