Last updated: July 14, 2026
About Service Monitoring
Dash0 gives you two complementary ways to monitor and understand the services that make up your distributed system: the Service Catalog and the Service Map.
Service monitoring is part of Dash0's Observability layer — the right side of the platform that sees everything running in production. This data feeds Agent0 for autonomous detection and diagnosis, and connects to Darkplane to close the loop back to development.
Together, the Service Catalog and Service Map provide both the quantitative metrics and the visual context you need to keep your system healthy.
Two Views, One Goal
-
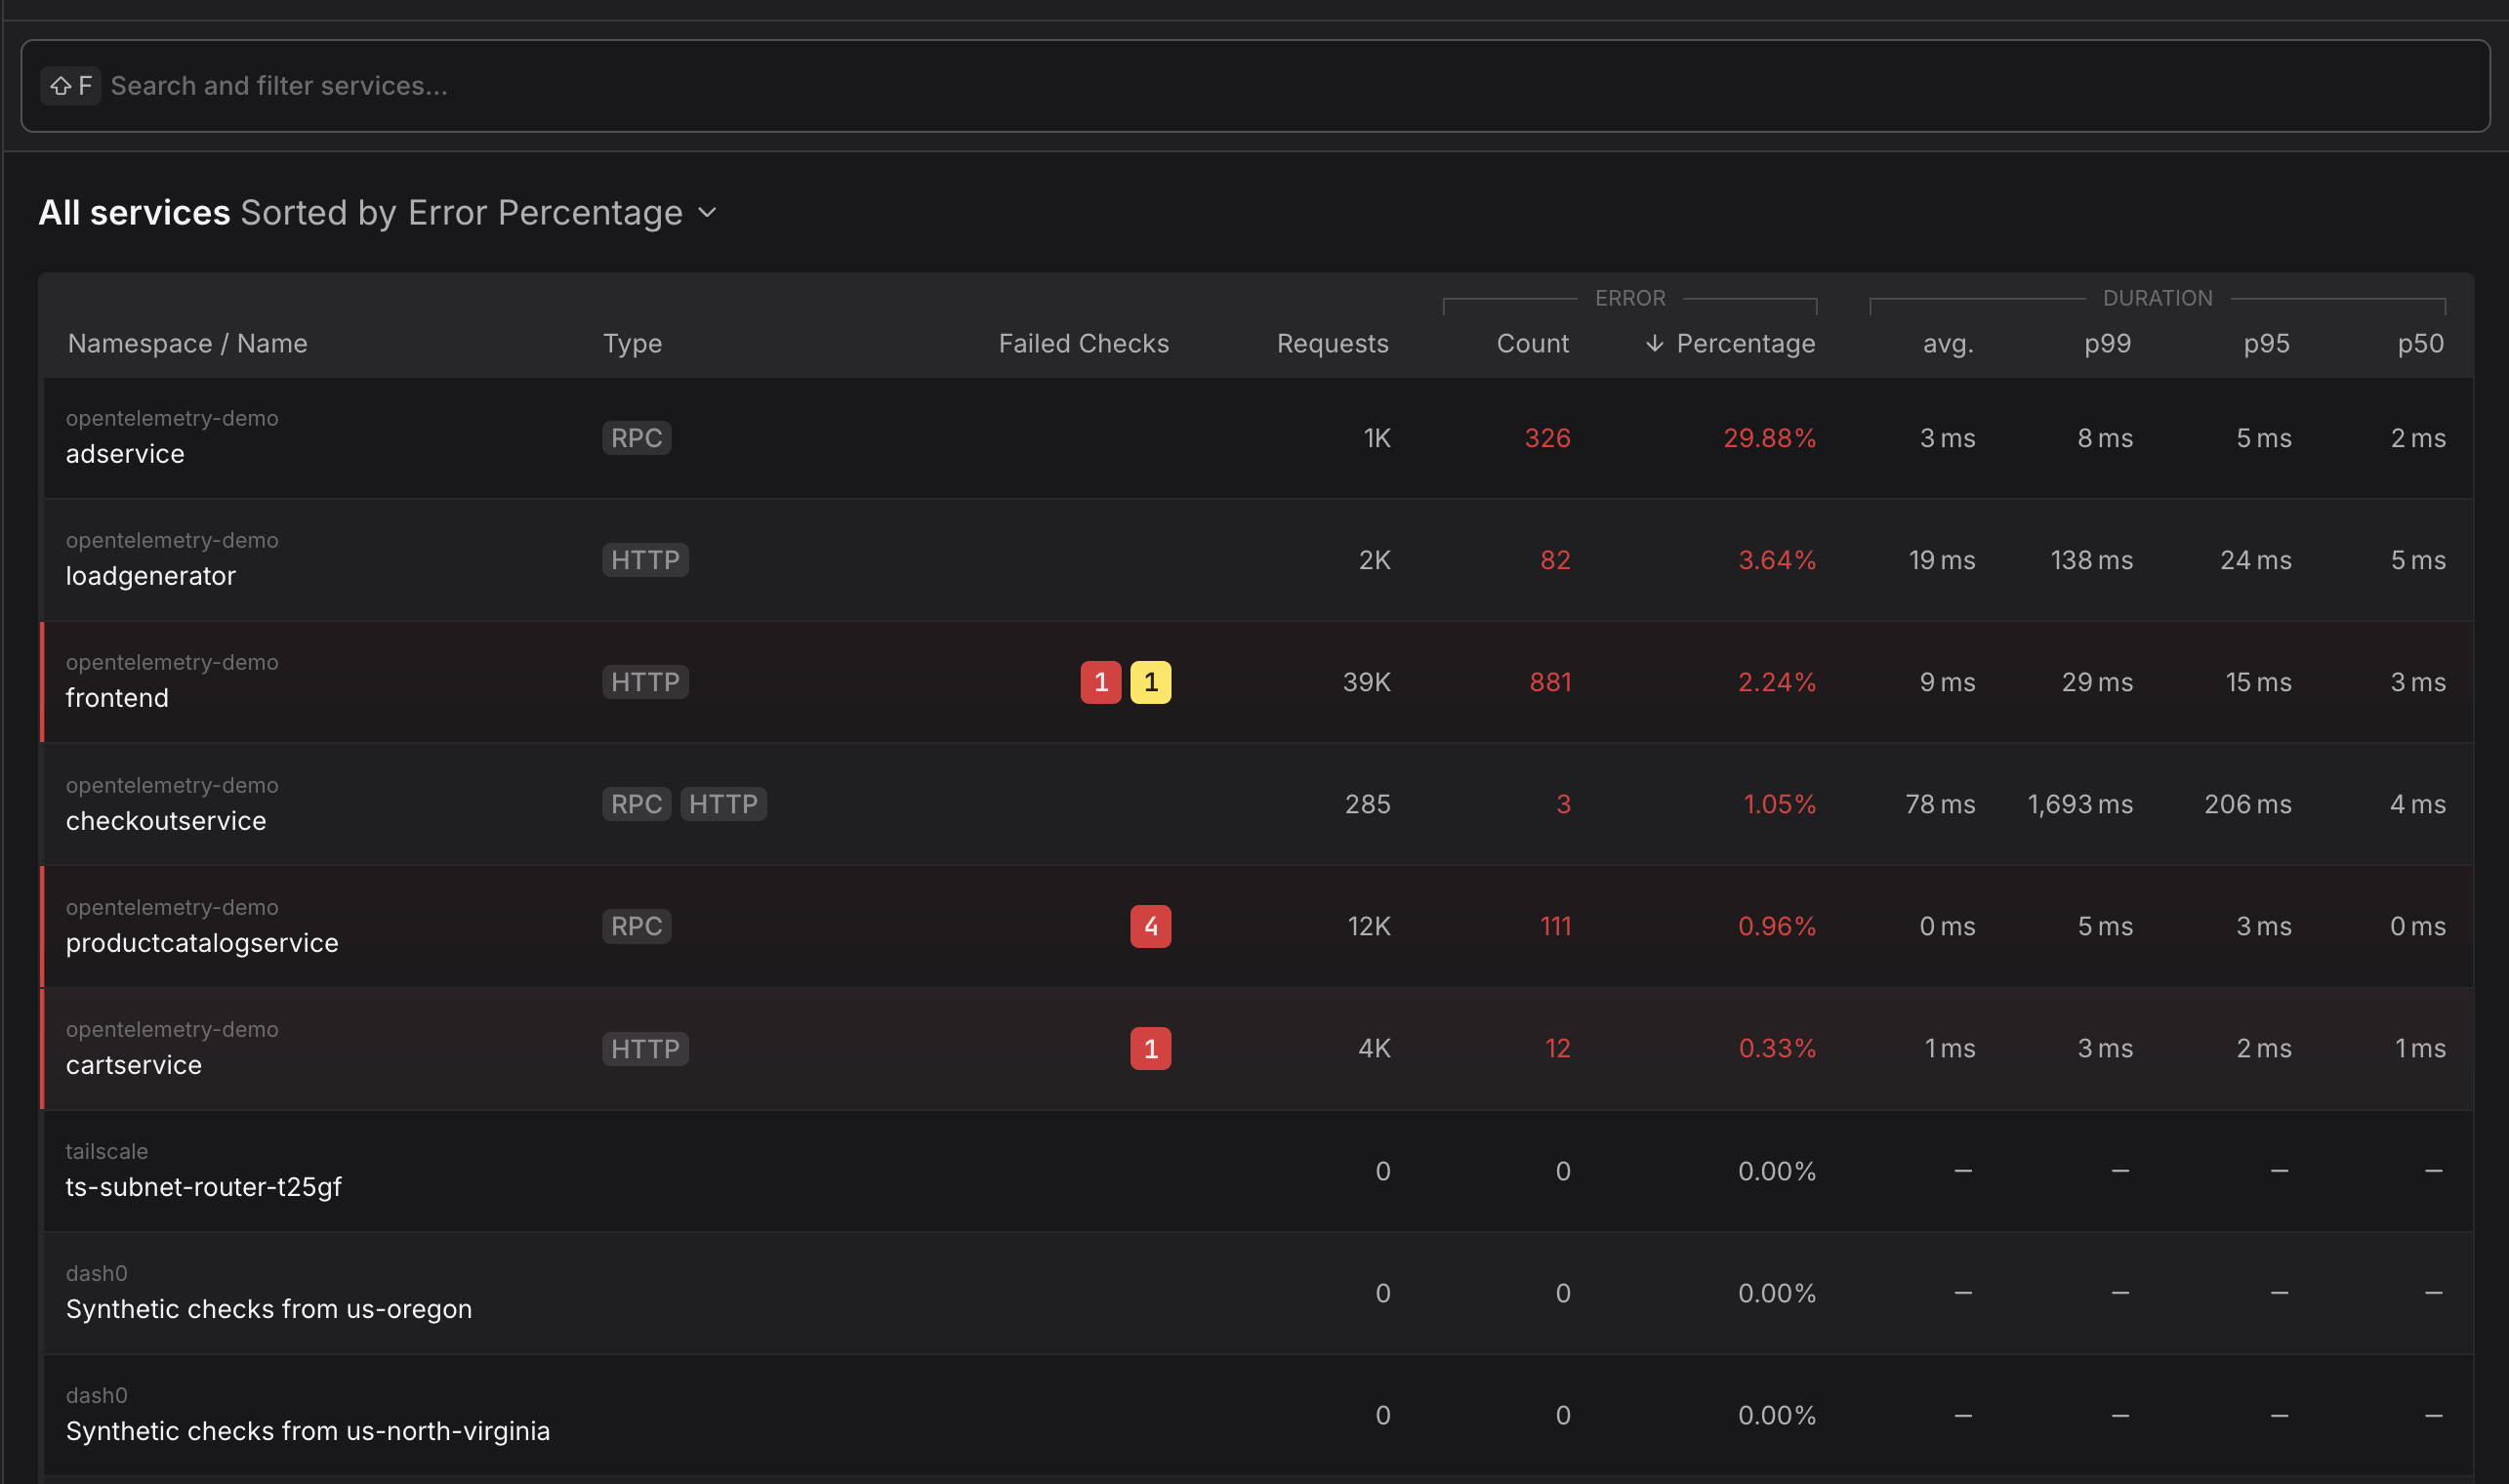
The Service Catalog is your operational command center. It lists every service in your environment alongside key health indicators — request rates, error percentages, and latency percentiles (P50, P95, P99). When something goes wrong, the catalog lets you sort and search to quickly surface the services that need attention.
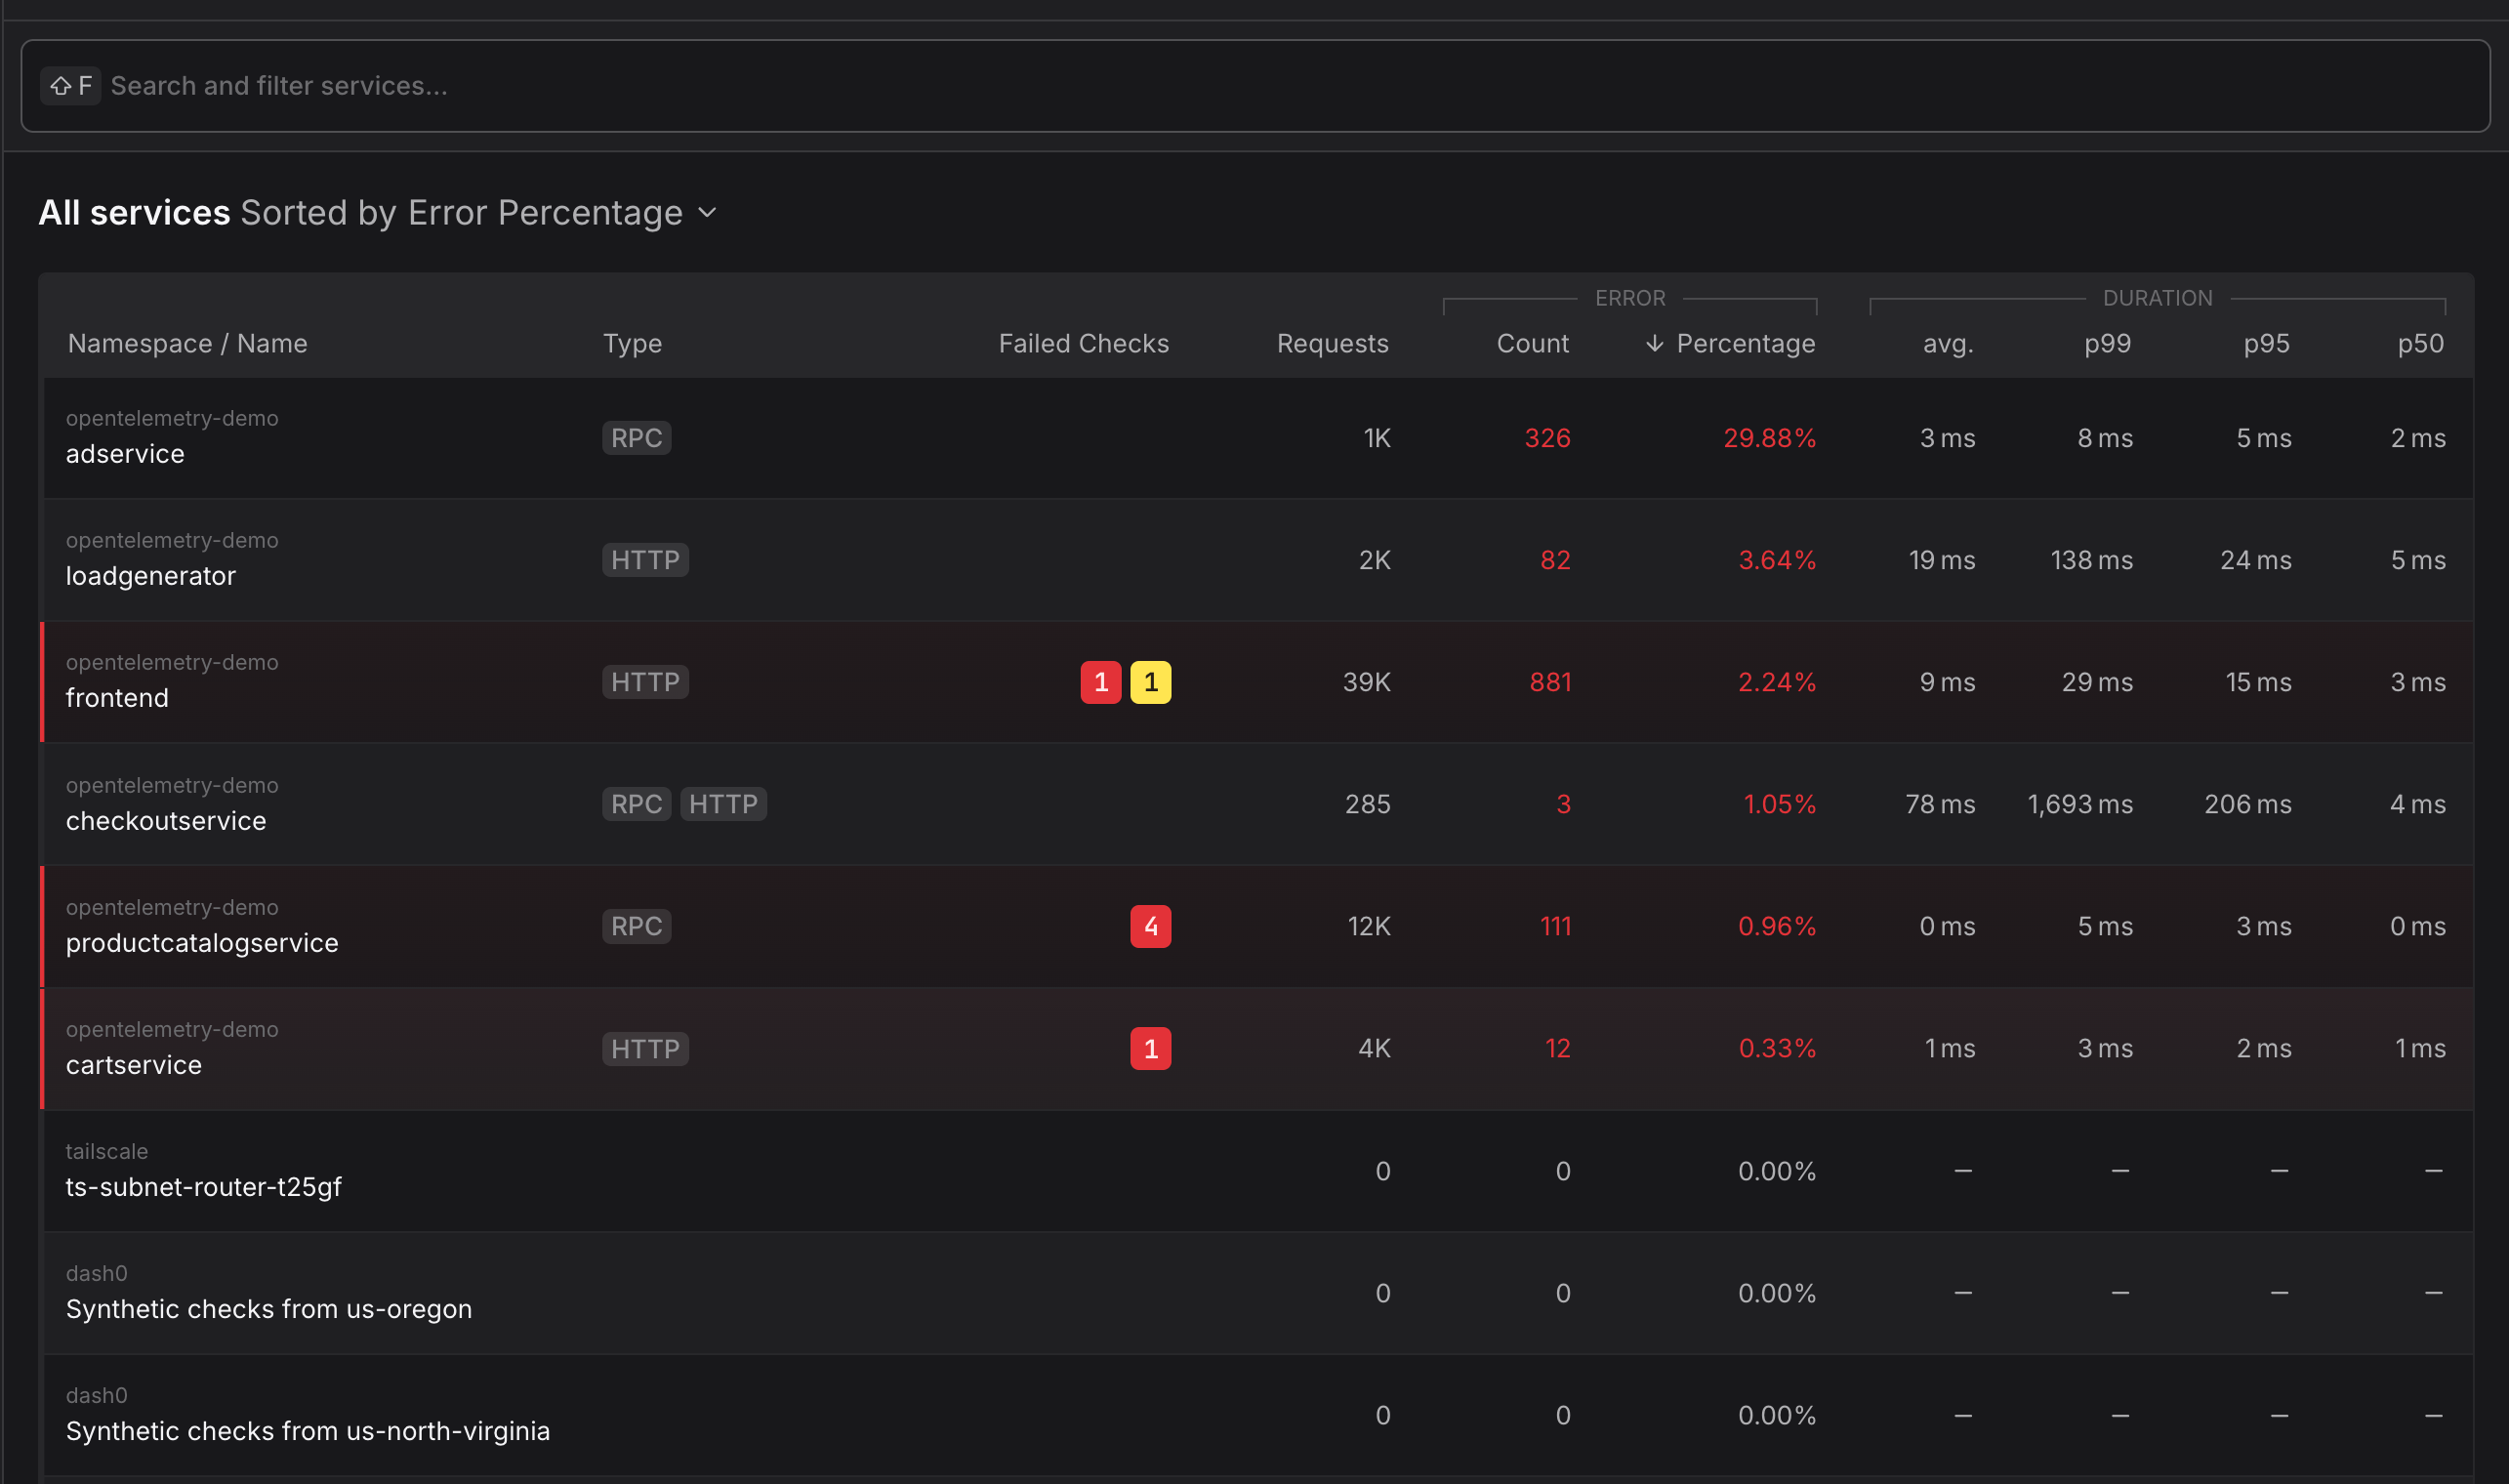
Drilling into any service reveals its endpoints, infrastructure details, dependencies, and all related telemetry (logs, traces, metrics, and checks) in a single place.
-
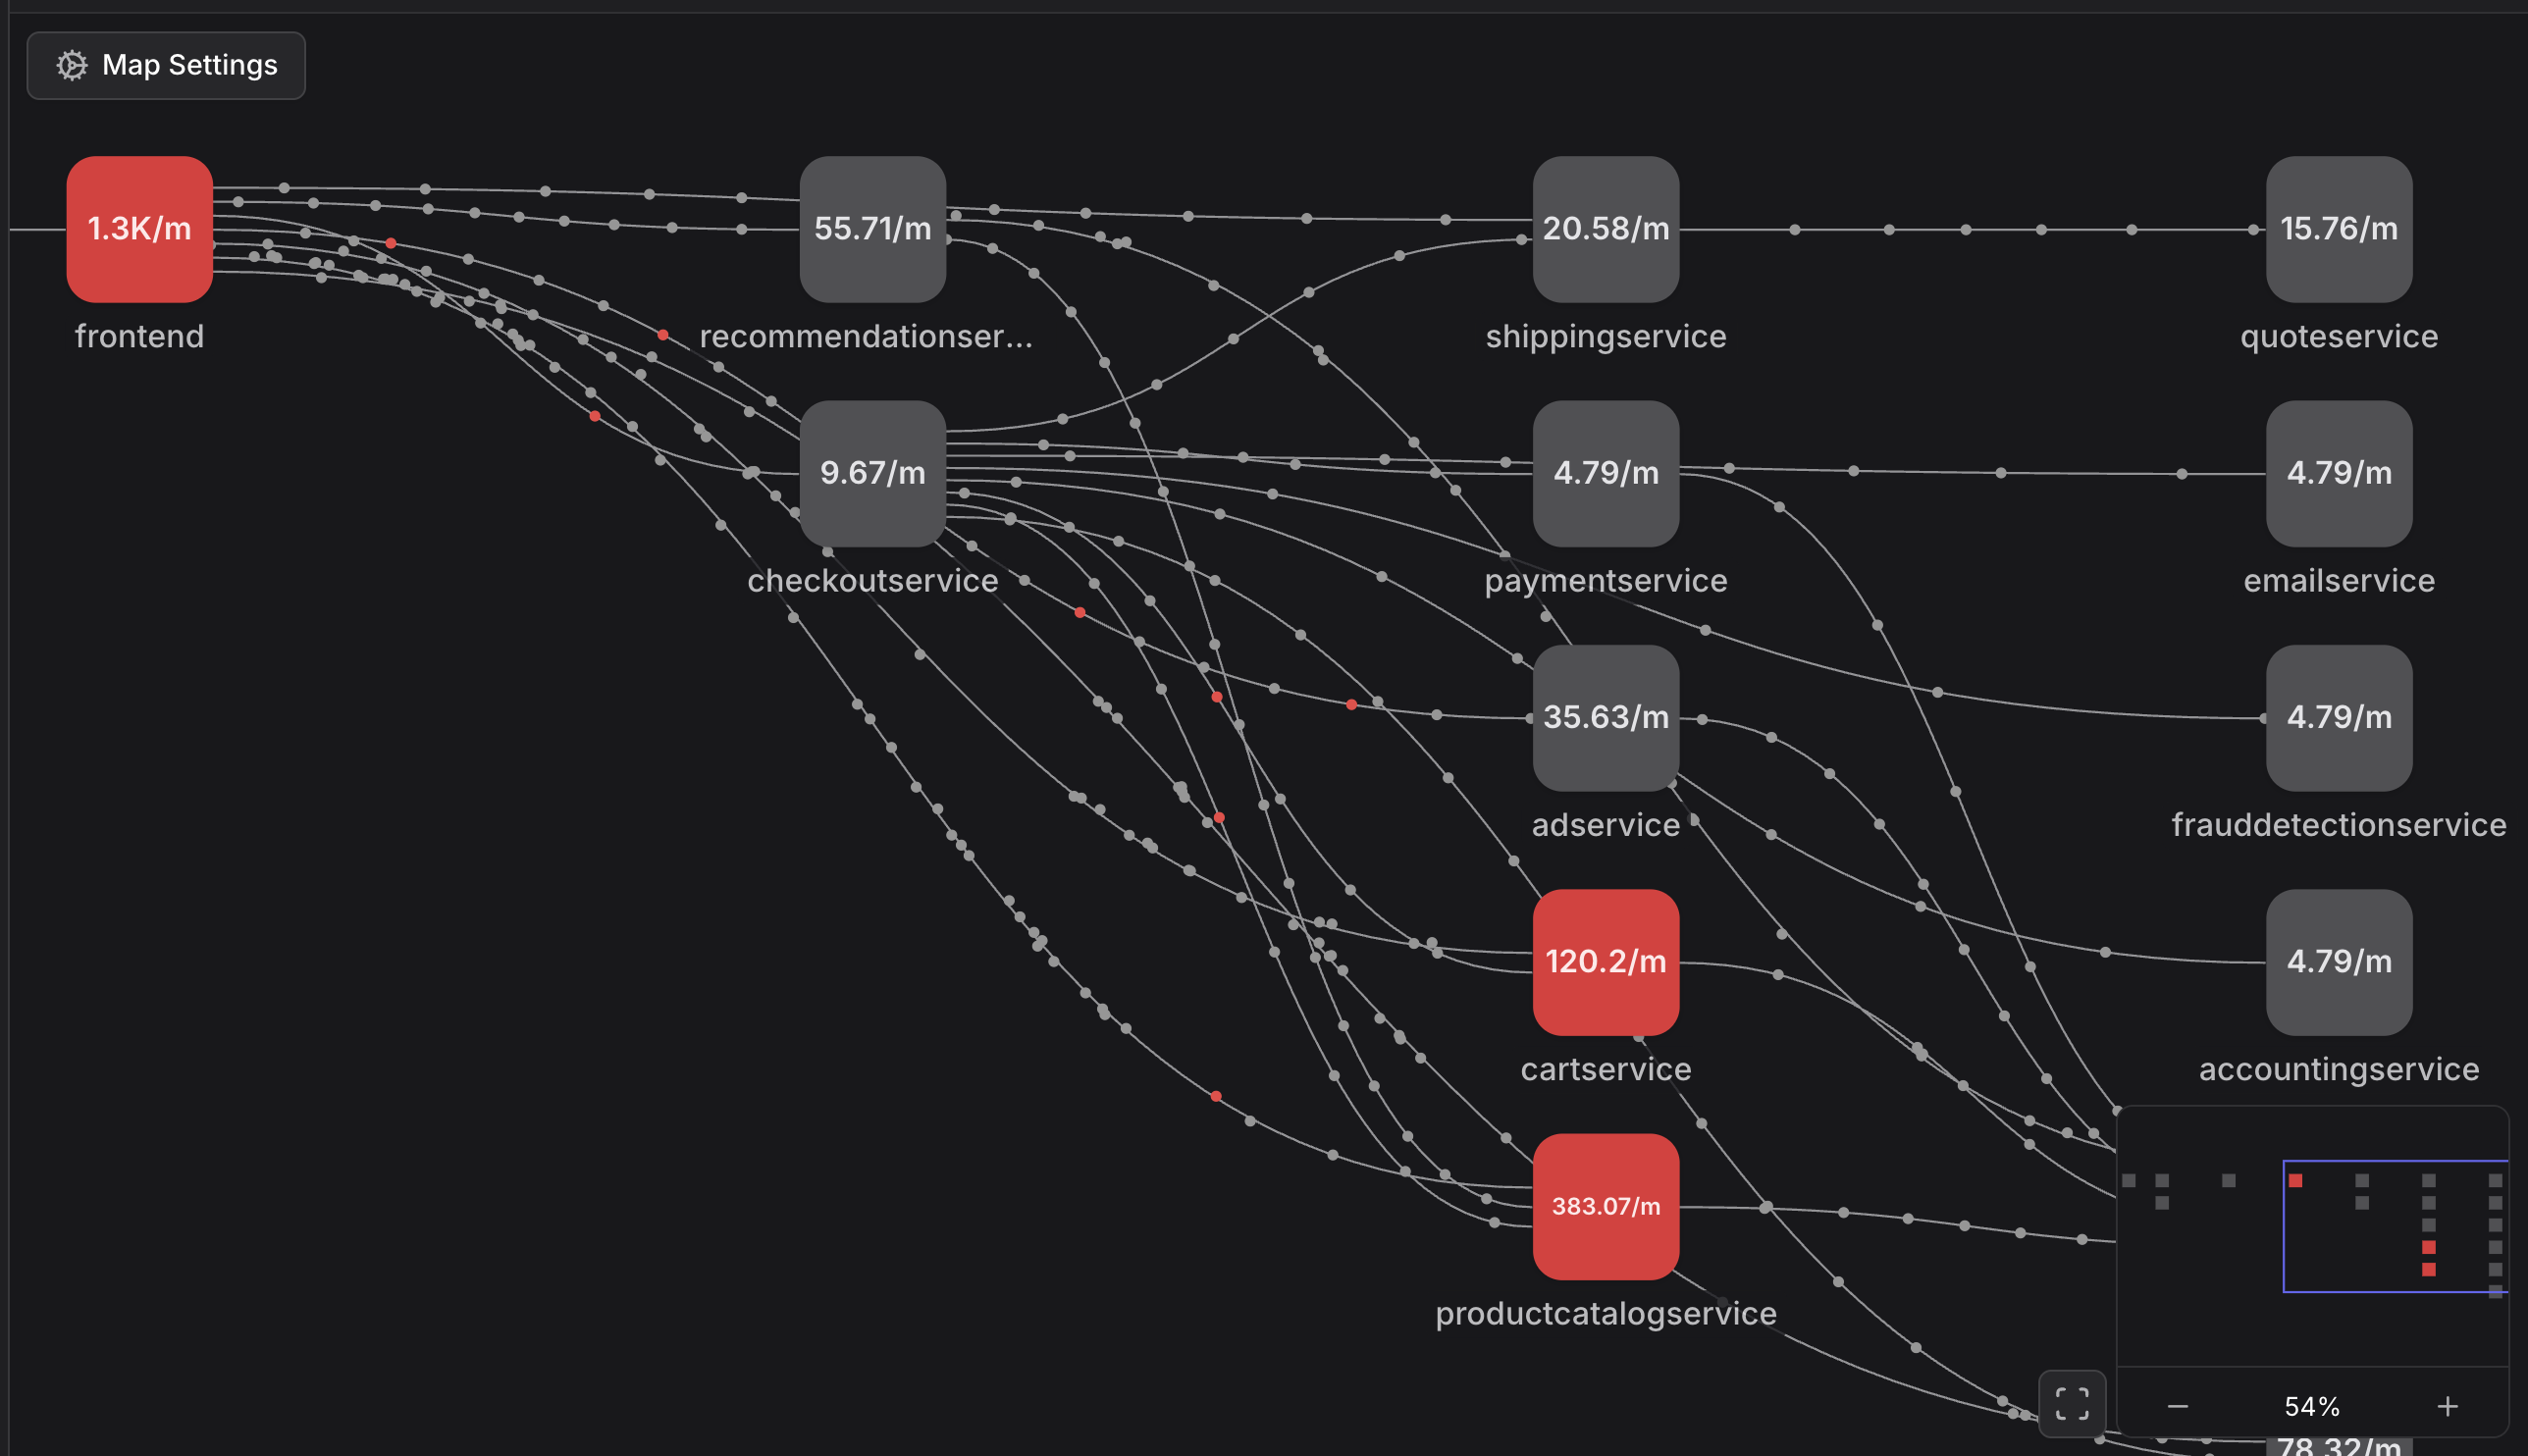
The Service Map is your architectural overview. It automatically discovers service relationships from OpenTelemetry traces and renders them as an interactive graph, showing you how requests flow through your system in real time. Nodes represent services, connections represent traffic, and color-coding shows health at a glance. You can customize the layout, toggle external dependencies, and even animate request volume across connections.

When to Use Which
Use the Service Catalog when you need to answer questions like:
- Which services have the highest error rates right now?
- How has this service's P99 latency changed over the past hour?
- What pods are running for this service, and are they healthy?
- Where are the logs and traces for this specific service?
Use the Service Map when you need to answer questions like:
- What does our overall system architecture look like?
- Which services depend on this failing database?
- Where are the bottlenecks in the request path from frontend to checkout?
- Is a downstream dependency causing cascading failures?
In practice, you'll move between both views during an investigation — the map helps you understand where the problem sits in your architecture, and the catalog gives you the detailed metrics to diagnose it.
Getting Started
Both views rely on services being properly instrumented with OpenTelemetry. Ensure your services emit traces with service.name and service.namespace attributes so Dash0 can accurately group them in the catalog and map their relationships.
To explore your services, navigate to Services in the primary navigation sidebar, where you can switch between the Catalog and Map views.
Next Steps
- Service Catalog — Search, sort, and drill into individual service health and telemetry
- Service Map — Visualize your system architecture and trace dependencies