
Last updated:
Sample Traces
Sampling reduces the volume of traces Dash0 stores while keeping the ones that matter. You define the rules, so you decide which traces to keep. A common setup keeps every error and slow trace and samples routine traces down to a target percentage, but that is one option among many. Spans are held briefly and evaluated together, so a keep-or-drop decision reflects the whole trace rather than any single span. This is tail sampling, and it can reduce trace volume by 90% or more without losing the traces you troubleshoot from.
Sampling applies to spans. Metrics you derive with signal-to-metrics conversion are produced at ingestion, so you keep those numbers even though the stored traces are sampled down. RED metrics are likewise calculated before sampling, so the request, error, and duration views in Dash0 reflect all of your traffic rather than only the sampled traces.
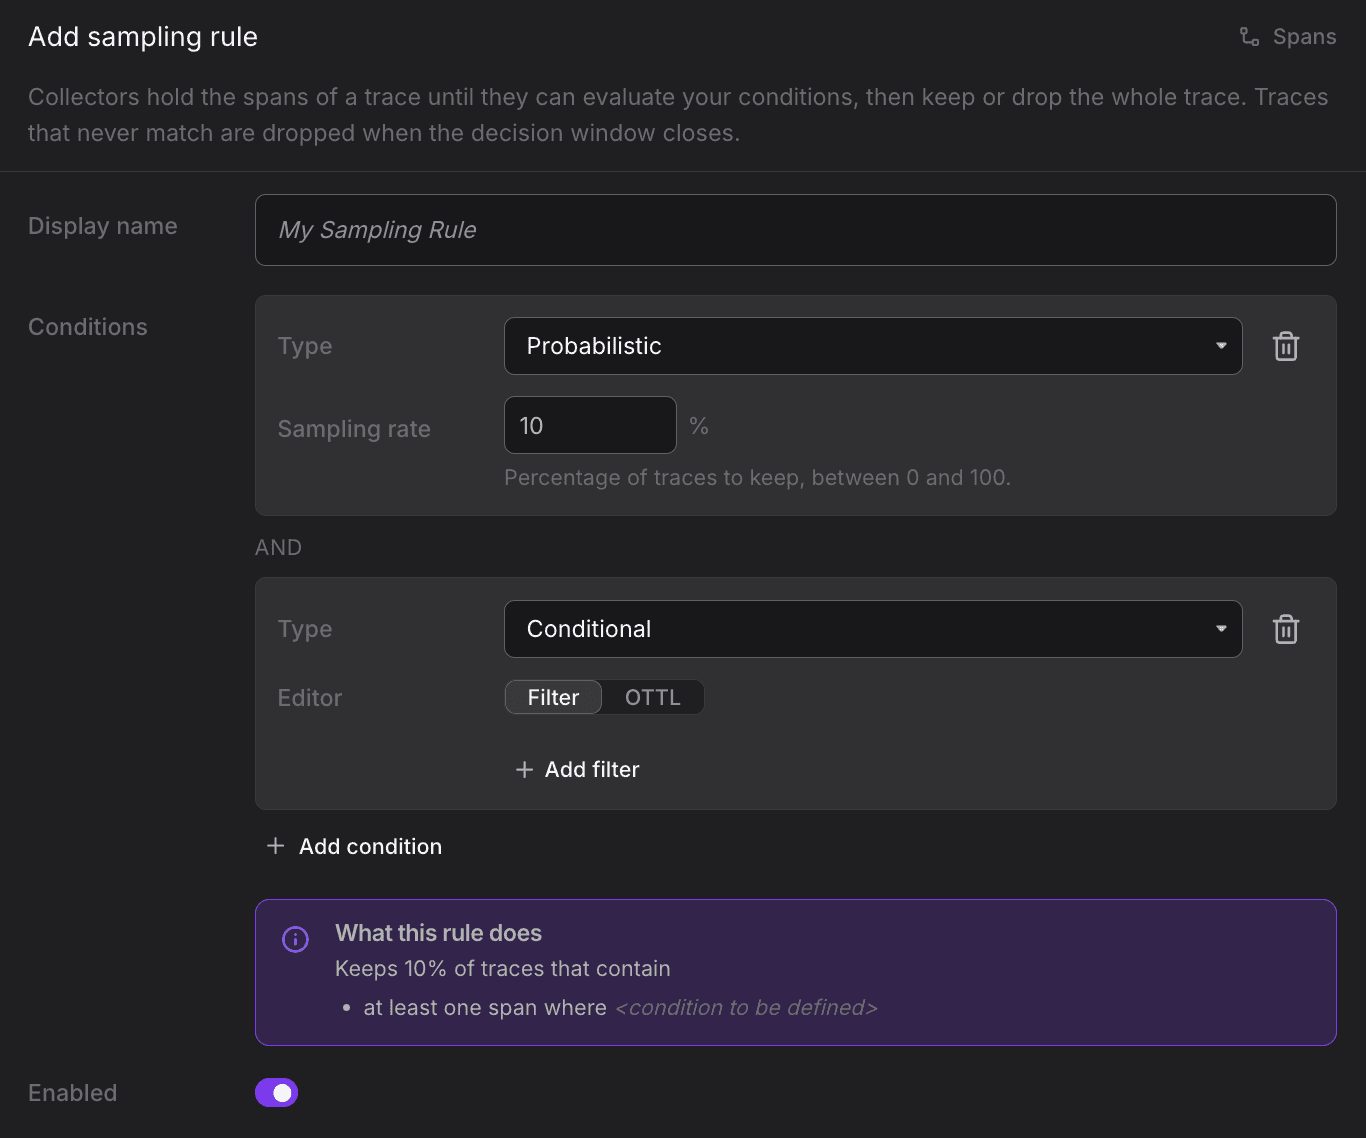
Add a Sampling Rule
- From the pipeline, open the Sampling stage for Spans and click Add sampling rule.
- Enter a Display name, for example
My Sampling Rule. - Under Conditions, choose a Type and fill in its inputs. The condition types are described below.
- Click Add condition to add another condition, or choose the All of… type to require several at once.
- Make sure Enabled is on, then click Save.
As you build the rule, the What this rule does panel restates it in plain language so you can confirm the behavior before saving.
Sampling is off for a dataset until it has at least one enabled sampling rule, and all traces pass through. As soon as one rule is enabled, a trace is kept only if a rule matches it, and traces that match no rule are dropped when their decision window closes. Your first rule therefore turns sampling on for the whole dataset. Make sure that rule, or a companion rule, keeps the traces you rely on, for example every error trace.
Condition Types
The Type dropdown offers four condition types.
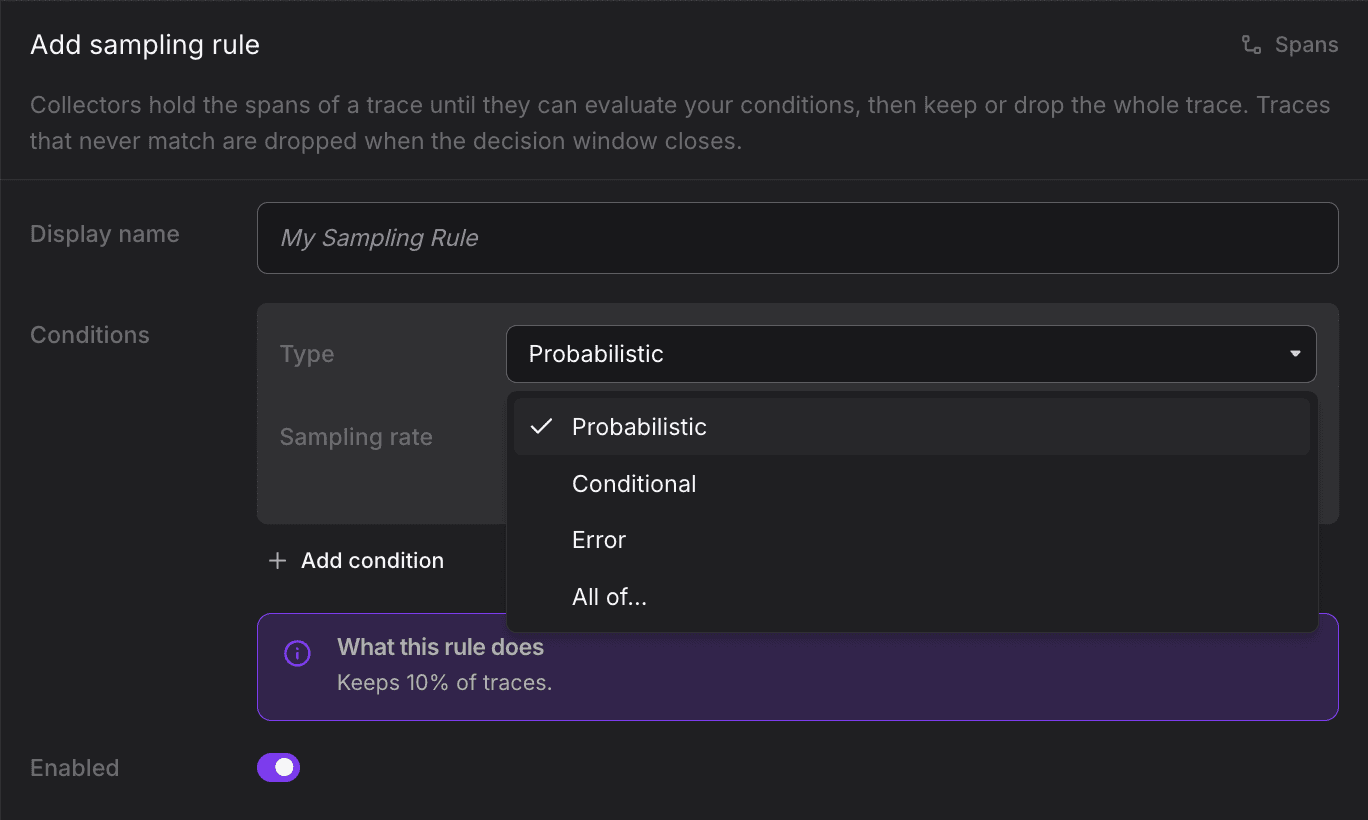
Probabilistic
Probabilistic conditions keep a fixed percentage of traces using a deterministic trace-ID hash, so the decision is consistent for every span of a trace. Use them for a baseline sampling rate. Set the Sampling rate to the percentage of traces to keep, between 0 and 100.
Conditional
Conditional conditions keep traces whose spans match a content-based condition. Use them to retain errors, latency outliers, and business-critical flows. Choose how to define the condition with the Editor toggle:
- Filter — build the condition with the same filter controls used elsewhere in Dash0. Click Add filter to add clauses.
- OTTL — write the condition in the OpenTelemetry Transformation Language. Reference span attributes as
attributes["..."], resource attributes asresource.attributes["..."], and span fields directly, for exampleattributes["http.status_code"] >= 500to keep server-error traces orresource.attributes["k8s.cluster.name"] == "production"to keep traces from the production cluster.
![Dash0 Add sampling rule form with a Conditional condition whose Editor is set to OTTL, showing the expression attributes["http.status_code"] >= 500](/_next/image?url=%2Fimages%2Fdocumentation%2Ftelemetry%2Fsignal-control%2Fsignal-control-add-sampling-rule-conditional-ottl.png&w=1920&q=75)
Error
Error conditions keep traces that contain an error. They need no further input.
All of…
All of… conditions require several conditions at once. Nest other condition types inside them, and a trace is kept only when all of the nested conditions match. For example, nest a Conditional rule that matches the production cluster with a Probabilistic rule set to 50% to keep half of your production traces.
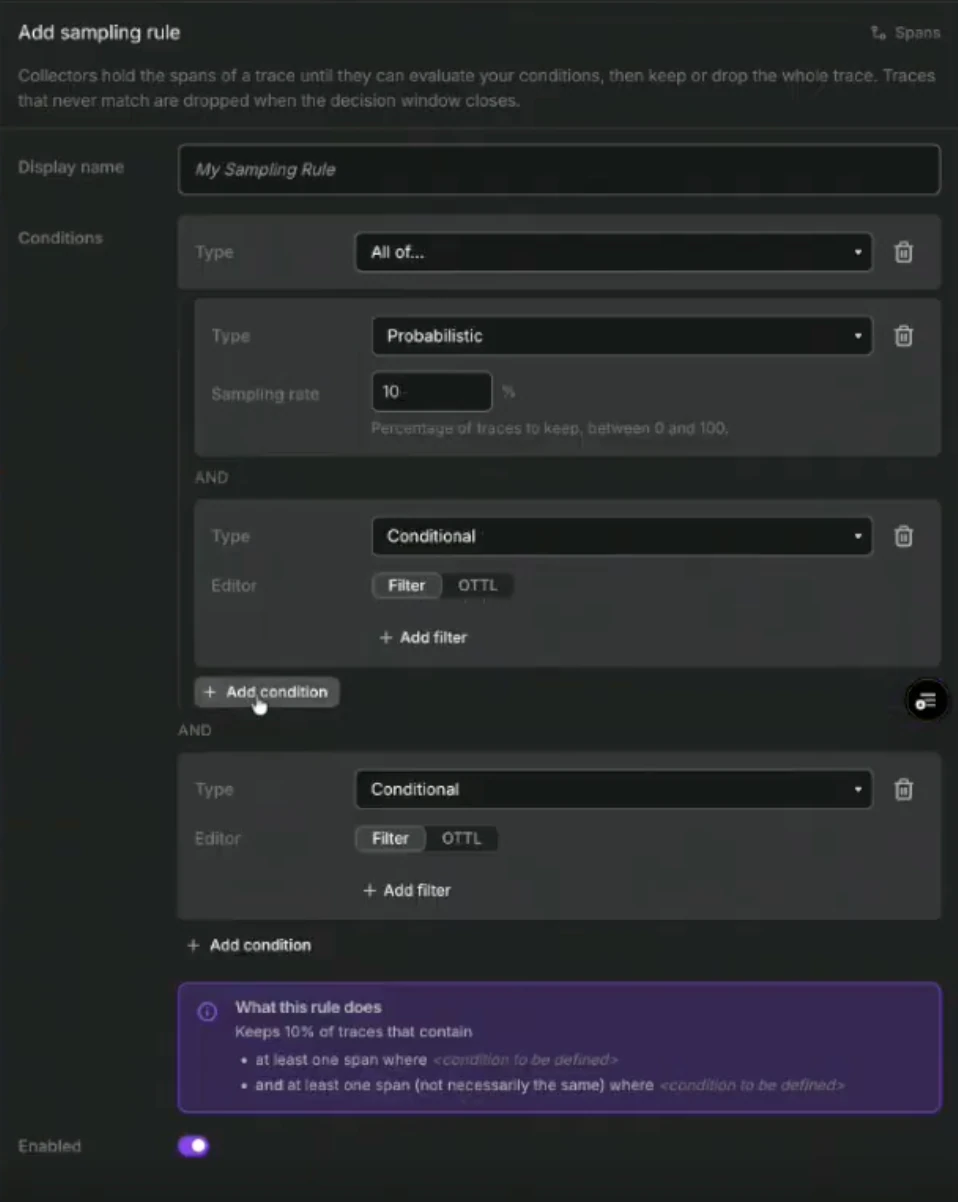
A typical rule set combines these: Conditional and Error conditions keep the errors and business-critical traces, and a Probabilistic condition reduces the remaining routine traffic to a baseline percentage.
Every span of a trace shares one keep-or-drop decision, so a trace is kept or dropped as a whole. Spans are buffered briefly while that decision is reached, and a trace is kept as soon as its conditions are satisfied.
Traces dropped by sampling cannot be recovered. Start with a conservative rate and confirm your error and latency rules keep the traces you rely on before lowering the baseline.
Sampling on the Edge
When you run SignalControl Edge, tail sampling happens inside your own network, on Kubernetes or without Kubernetes, so the dropped traces never leave your network and you save egress cost as well as storage. Because a single keep-or-drop decision covers a whole trace, ensure all spans of a trace are routed to the same dataset when sampling on the edge.
The rest of this section covers the standalone edge deployment: authoring rules through the API, and the dash0sampling processor and reservoir configuration.
Authoring Sampling Rules via the API
Send API requests to your region's API endpoint from the endpoint table, with an Authorization: Bearer <token> header. Creating sampling rules requires a token with the admin role. See Dash0 API for the general conventions, and the setup steps for a complete curl example.
Rules are created with POST /api/sampling-rules?dataset=<dataset>. A rule has a kind of Dash0Sampling, a metadata.name, and a spec with enabled, an optional display.name shown in the UI, one conditions tree, and an optional rateLimit.
The condition kinds map to the four UI types (ottl is the Conditional type's OTTL editor, and and is All of…):
probabilistic(Probabilistic): Keep a fixed fraction via a deterministic trace-ID hash.spec.rateis 0.0–1.0. Decided locally in the collector, with no coordination.ottl(Conditional): Keep traces matching an OTTL boolean expression inspec.ottl. Reference span fields withspan.and resource attributes withresource.attributes[...].error(Error): Keep traces with an error span.specis empty.and(All of…): Require all nested conditions.spec.conditionsis a non-empty list of the kinds above.
A rule may contain at most 32 ottl and error conditions across its tree. Probabilistic conditions are decided locally and do not count. The API does not reject a larger rule; Dash0 rejects it when loading the rules for your organization, and that rule stops matching. Keep every rule well within the limit. There is no fixed limit on the number of rules per dataset. See the limits table.
Keep every error trace:
{
  "kind": "Dash0Sampling",
  "metadata": {
    "name": "keep-errors"
  },
  "spec": {
    "enabled": true,
    "display": {
      "name": "Keep error traces"
    },
    "conditions": {
      "kind": "error",
      "spec": {}
    }
  }
}
Keep 50% of traces from the production cluster, combining an OTTL condition with a probabilistic one:
{
  "kind": "Dash0Sampling",
  "metadata": {
    "name": "production-baseline"
  },
  "spec": {
    "enabled": true,
    "display": {
      "name": "Production baseline 50%"
    },
    "conditions": {
      "kind": "and",
      "spec": {
        "conditions": [
          {
            "kind": "ottl",
            "spec": {
              "ottl": "resource.attributes[\"k8s.cluster.name\"] == \"production\""
            }
          },
          {
            "kind": "probabilistic",
            "spec": {
              "rate": 0.5
            }
          }
        ]
      }
    }
  }
}
Keep every slow checkout trace, but no more than 1000 per minute:
{
  "kind": "Dash0Sampling",
  "metadata": {
    "name": "slow-checkout"
  },
  "spec": {
    "enabled": true,
    "display": {
      "name": "Slow checkout traces"
    },
    "conditions": {
      "kind": "ottl",
      "spec": {
        "ottl": "span.name == \"POST /checkout\" and span.duration > 500ms"
      }
    },
    "rateLimit": {
      "rate": 1000
    }
  }
}
rateLimit is optional but recommended on any rule that can match a burst. rateLimit.rate caps traces kept per minute for the rule, so an outage that trips an error rule does not flood ingest. Very low limits (16 or below) are not guaranteed, and a probabilistic-only rule cannot set one.
Sampling Processor Configuration
Every field on dash0sampling:
| YAML key | Default | Description |
|---|---|---|
decision_maker_endpoint | required | gRPC host:port of the edge proxy, or the Dash0 sampling upstream in direct mode. |
decision_maker_headers | none | Headers on every gRPC call. Required in single mode: carry Authorization: Bearer <token> and Dash0-Dataset: <dataset>. Must be absent in multi mode. |
decision_maker_insecure | false | Disable TLS. Use true only for a plaintext local edge proxy. |
organization_mode | single | single looks rules up by dash0.dataset only (one org, implied by the token). multi also keys on dash0.org.technical.id. Standalone edge uses single. |
default_dataset | default | Dataset used when a span carries no dash0.dataset. Single mode only. |
reservoir | required | The span buffer. See the reservoir fields below. |
enable_batching | false | Batch satisfaction reports to the upstream instead of sending each immediately. |
max_batch_size | 500 | Max reports per batch. Only when enable_batching is true. |
max_batch_wait | 200ms | Max wait before flushing a partial batch. Only when enable_batching is true. |
decision_channel_max_size | 10000 | Buffer for incoming decisions. Raise if you see decision-processing lag. |
eviction_channel_size | 1000 | Buffer for spans leaving the reservoir toward the exporter. |
fallback_sample_ratio | 0.01 | Probabilistic keep ratio (0.0–1.0) used when the upstream is unreachable or has not delivered rules yet. 0.0 blocks until rules arrive; 1.0 keeps everything. |
fallback_min_connected_ratio | 1.0 | Fall back to probabilistic when the connected fraction of upstream instances drops below this. 1.0 falls back if any instance is disconnected; 0.0 only when fully disconnected. |
fallback_until_rules_received | true | Use the fallback ratio during startup until the first rules arrive, instead of blocking. |
metric_recorder | none | Optional dash0metricrecorder ID for sampling volume counters. Leave unset unless you specifically want the sampling _in/_out counters. |
debug | false | Verbose per-decision logging. High volume; debugging only. |
The Reservoir
The reservoir buffers spans while their trace waits for a decision. Pick a type by retention need and throughput:
reservoir.type | Best for | Trade-off |
|---|---|---|
memory | Short retention (5–15s), lowest latency | Bounded by max_memory_bytes |
serialized_memory | High throughput, moderate retention | Best balance for most workloads |
disk (default) | Long retention (60s+), large volumes | Needs data_dir on a fast SSD/NVMe |
disk is what the processor uses when type is unset, and it refuses to start without a data_dir. The reference configuration sets serialized_memory explicitly, which needs no storage and suits most workloads. Choose disk deliberately when you need long retention or volumes that exceed memory, and give it a dedicated fast volume.
Reservoir fields:
| YAML key | Default | Applies to | Description |
|---|---|---|---|
type | disk | all | memory, serialized_memory, or disk. |
buffer_duration | 60s | all | How long spans are held awaiting a decision. Must cover the expected decision latency. Too short drops spans early; too long raises memory. Typical 30–60s. |
max_memory_bytes | 104857600 (100 MB) | memory, serialized_memory | Memory cap; oldest traces are evicted when exceeded. |
estimated_bytes_per_span | 800 | memory | Per-span size estimate used for the memory calculation. |
data_dir | required for disk | disk | Directory for shard files. Use dedicated, fast storage. |
max_disk_bytes | 0 (unlimited) | disk | Total disk cap across shards. Default 0 means unlimited (age-based eviction only); set >0 to cap, e.g. 1073741824 (1 GiB). |
shard_count | 16; CPU count (memory) | all | Parallelism for writes. Defaults to 16 for every type except memory, which uses the CPU count. Raise if you see "ingest channel full". |
rotation_interval | 5s | disk | How often active files are sealed and become eligible for eviction. |
writer_buffer_size | 262144 (256 KB) | disk | Per-shard write buffer. |
ingest_channel_size | 100 | all | Per-shard ingest buffer. |
eviction_scan_send_timeout | 1s | all | How long eviction waits on a slow consumer before dropping a matched trace. |
Sizing rule of thumb: required storage ≈ spans/sec × bytes/span × buffer_duration, across the fleet. At 800 bytes per span, 100k spans/s over a 10s window is about 800 MB; split it across your collector instances.
Further Reading
-
About SignalControl. Overview of the full reduction pipeline and how the stages compose.
-
About SignalControl Edge. Run tail sampling inside your own network, on Kubernetes or standalone, to also cut egress cost.
-
About Tracing. How Dash0 ingests, stores, and explores traces and spans.
-
Convert Signals to Metrics. Derive metrics at ingestion so they survive trace sampling.