
Last updated:
Convert Signals to Metrics
Signal-to-metrics rules convert matching logs and spans into metric data points at ingestion, counted and aggregated before storage. When you only need the count, rate, or a numeric value derived from a high-volume signal, converting it to a metric preserves what you chart and alert on while storing a fraction of the volume.
Conversion runs at ingestion, so you keep the numbers you chart and alert on even as sampling reduces the stored traces. For request rate, error, and duration signals specifically, Dash0 also provides RED metrics calculated from your trace data.
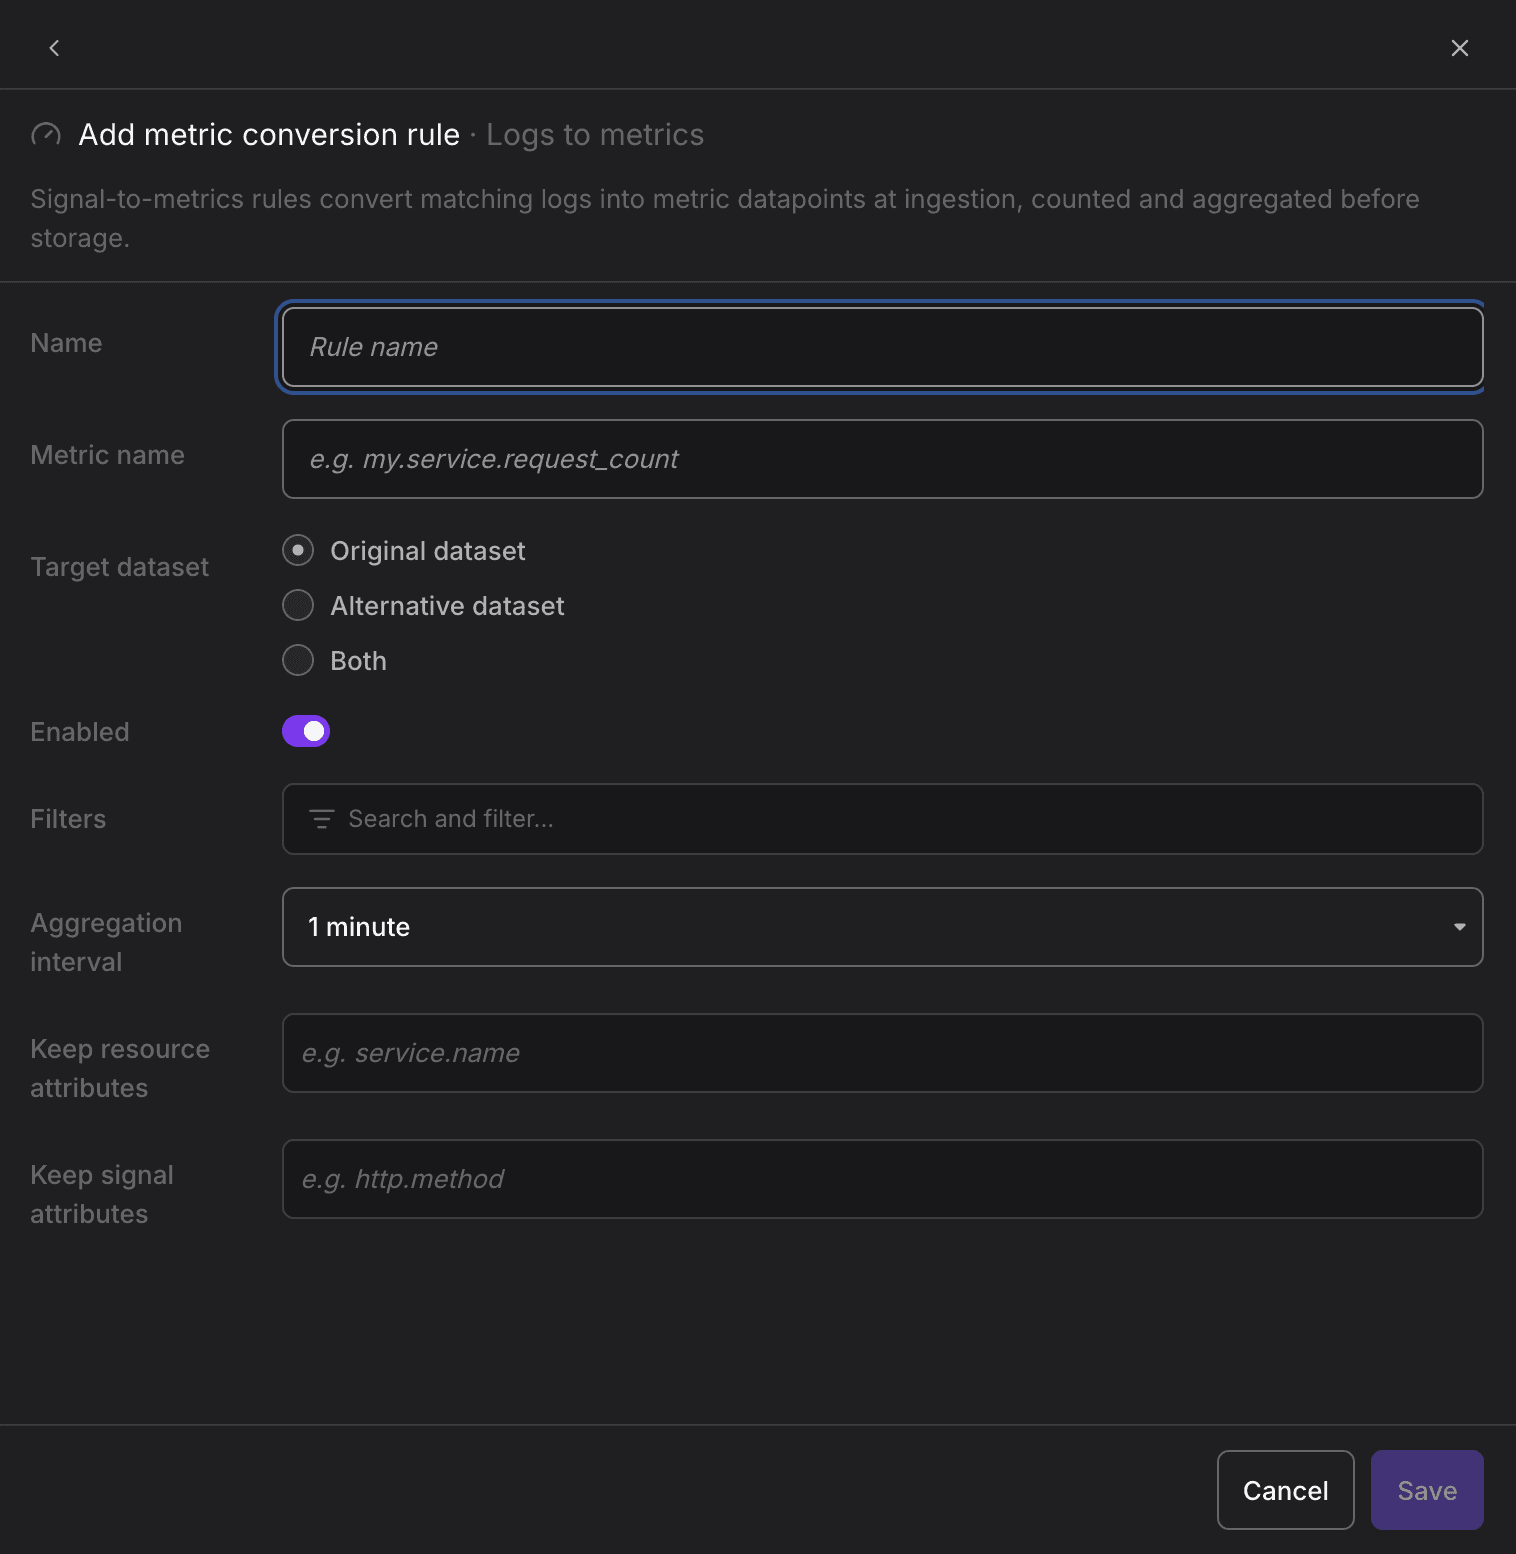
Add a Conversion Rule
- From the pipeline, open the Convert to metrics stage for the signal you want to convert and click Add conversion rule.
- Fill in the rule fields:
- Name: A name for the rule.
- Metric name: The name of the metric to produce, for example
my.service.request_count. - Target dataset: Where the derived metric is written. Original dataset writes it to the dataset the source signal arrived in. Alternative dataset writes it to another dataset of your organization, which you select in the field that appears, and is useful for collecting derived metrics from several datasets in one place or for giving them a different retention. Both writes it to both.
- Enabled: Activates the rule.
- Filters: Restricts the rule to the signals matching these attributes. Scope filters to the specific signals your use case needs. Matching every signal of a type is possible but rarely useful and generates unnecessary load, so avoid leaving filters empty.
- Aggregation interval: The window over which matching signals are counted and aggregated into a data point, for example 1 minute.
- Keep resource attributes: Resource attributes to retain as metric dimensions, for example
service.name. A service's identity isservice.nameplusservice.namespace, so keep both attributes if you want to retain the service as a dimension. - Keep signal attributes: Signal attributes to retain as metric dimensions, for example
http.method.
- Click Save.
Every attribute you keep becomes a metric dimension and adds to the metric's cardinality. Keep only the attributes you need to group or filter by, and avoid retaining high-cardinality attributes such as unbounded IDs, which produce a large number of time series and undermine the volume reduction. Set the attributes correctly here at conversion time rather than aggregating the metric down afterward.
Common Use Cases
- Count high-volume log events: Convert a frequent log line into a counter metric instead of storing every record.
- Derive request metrics from spans: Produce request counts or latency distributions before sampling reduces the raw traces.
- Track business events: Turn matching custom events (reported as logs) into metrics you can chart and alert on cheaply.
RED metrics are a built-in special case of signal-to-metrics: Dash0 automatically calculates request, error, and duration metrics for every operation span, meaning spans that carry a dash0.operation.name attribute after enrichment. Unless you need additional conditions, there is usually no need to create conversion rules that replicate what RED metrics already provide.
Signal to Metrics on the Edge
When you run SignalControl Edge, conversion runs inside your own network before telemetry leaves it. Spans produce an exponential histogram of duration; log records produce a monotonic-sum counter. This section covers the standalone edge deployment: authoring rules through the API, and the dash0signaltometrics connector configuration.
Authoring Rules via the API
Send API requests to your region's API endpoint from the endpoint table, with an Authorization: Bearer <token> header. See Dash0 API for the general conventions.
Create a single rule with POST /api/signal-to-metrics?dataset=<dataset>, which takes one definition. To upsert many at once, use PUT /api/import/signal-to-metrics?dataset=<dataset> with a { "items": [...] } body of 1 to 500 definitions, applied atomically: if any item fails, none are written. The spec:
| Field | Required | Description |
|---|---|---|
enabled | yes | Whether the rule is active. |
display.name | yes | Human-readable name. |
match.signal | yes | spans or logs. |
match.filters | yes | A list of attribute filters (see Filter Operators). An empty list matches every signal of the type. |
output.name | yes | Name of the generated metric. |
output.interval | yes | Emission interval, e.g. 60s. |
output.description | no | Metric description metadata. |
output.keepResourceAttributes | no | Key matchers selecting which resource attributes to copy onto the metric's resource. |
output.keepSignalAttributes | no | Key matchers selecting which span/log attributes to copy onto the metric's data points. |
targetDatasetMode | no | original (default), alternative, or both. These match the Target dataset options in the UI. alternative and both require alternativeDatasetId, the ID of the dataset to write to. |
Span latency for a specific route, keeping the route and environment as dimensions:
{
  "kind": "Dash0SignalToMetrics",
  "metadata": {
    "name": "checkout-latency"
  },
  "spec": {
    "enabled": true,
    "display": {
      "name": "Checkout Service Latency"
    },
    "match": {
      "signal": "spans",
      "filters": [
        {
          "key": "service.name",
          "operator": "is",
          "value": "checkout-service"
        },
        {
          "key": "http.route",
          "operator": "starts_with",
          "value": "/api/v1/checkout"
        }
      ]
    },
    "output": {
      "name": "checkout.request.duration",
      "interval": "60s",
      "keepResourceAttributes": [
        {
          "operator": "is",
          "value": "deployment.environment"
        }
      ],
      "keepSignalAttributes": [
        {
          "operator": "is",
          "value": "http.route"
        }
      ]
    }
  }
}
Count error logs from a namespace:
{
  "kind": "Dash0SignalToMetrics",
  "metadata": {
    "name": "error-log-count"
  },
  "spec": {
    "enabled": true,
    "display": {
      "name": "Error log count"
    },
    "match": {
      "signal": "logs",
      "filters": [
        {
          "key": "k8s.namespace.name",
          "operator": "is",
          "value": "payments"
        },
        {
          "key": "otel.log.severity.text",
          "operator": "is_one_of",
          "values": [
            "ERROR",
            "FATAL"
          ]
        }
      ]
    },
    "output": {
      "name": "payments.error.logs",
      "interval": "60s"
    }
  }
}A kept attribute produces a separate time series per distinct value. Avoid keeping high-cardinality attributes such as user.id or trace.id.
Connector Configuration
dash0signaltometrics reads its rules from the settings extension, so no rules go in the collector config. It converts traces and logs, so place it in the exporters of both a traces pipeline and a logs pipeline to cover both rule types. Its own knobs:
| YAML key | Default | Description |
|---|---|---|
default_dataset | default | Dataset used when a signal carries no dash0.dataset. |
metrics_flush_interval | 60s | How often generated metrics are exported. |
cache_expiration | 60s | How long the compiled ruleset is cached; rule edits take effect within this window without a restart. Range 10s–1h. |
max_time_series | 30000 | In-memory series cap. |
metric_recorder | none | Optional dash0metricrecorder ID. |
Further Reading
-
About SignalControl. Overview of the full reduction pipeline and how the stages compose.
-
Aggregate Time Series. Reduce the cardinality and frequency of stored metrics.
-
Filter Out Spam. Drop noisy records before they reach the conversion stage.
-
Sample Traces. Reduce trace volume while keeping the metrics you derived at ingestion.