
Last updated:
About SignalControl
SignalControl is a rule-based pipeline that reduces the volume of telemetry Dash0 stores, without compromising the observability you rely on. Each signal you send (logs, metrics, spans, and web events) passes through a series of stages that drop noise, convert high-volume signals into compact metrics, sample traces by rules you define, and roll up high-cardinality time series. The result is lower volume while the data that matters for troubleshooting, dashboards, and alerting stays intact.
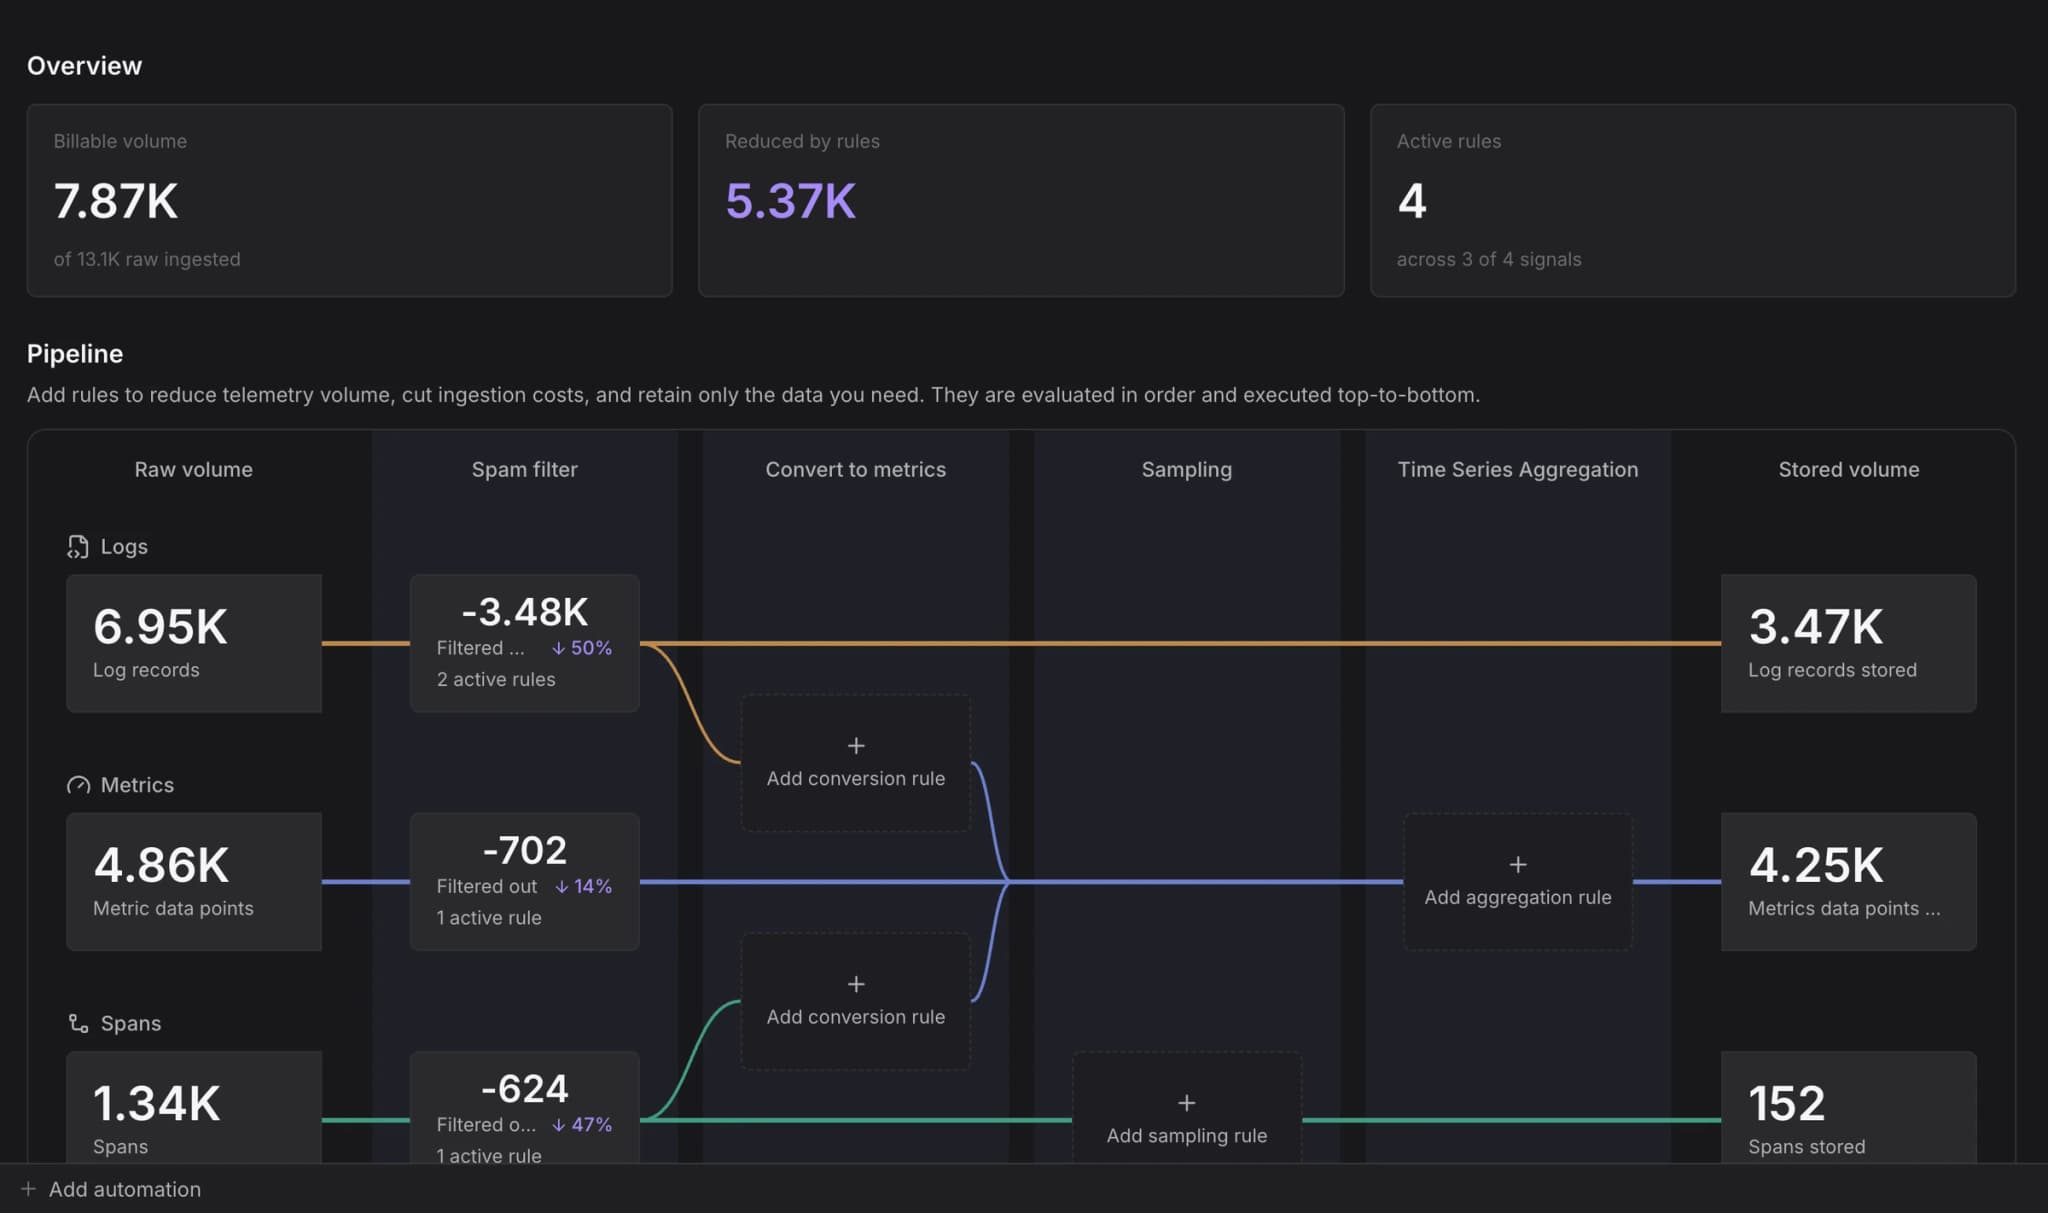
You add rules from the SignalControl page, where the pipeline visualizes how much volume each stage removes for every signal type.
SignalControl can also run inside your own network with SignalControl Edge, which applies spam filtering, signal-to-metrics conversion, and tail sampling before telemetry leaves your network. That cuts egress cost in addition to ingest and storage cost. Time series aggregation always runs in Dash0.
The Pipeline
Every signal flows from Raw volume on the left to Stored volume on the right. Between them sit the stages that reduce volume:
- Spam filter: Permanently drops noisy, low-value telemetry before it costs anything downstream. Applies to logs, metrics, spans, and web events. More here...
- Convert to metrics: Turns matching logs and spans into compact metric data points, counted and aggregated at ingestion. Conversion runs before sampling, so metrics derived from spans reflect all traffic even when the traces are later sampled down. Ideal for keeping the numbers you chart or alert on without storing every raw record. More here...
- Sampling: Reduces trace volume with rules you define. A common setup keeps every error and slow trace and samples routine traces down to a target percentage. Spans are evaluated together, so the decision reflects the whole trace rather than any single span. Applies to spans. More here...
- Time Series Aggregation: Rolls up high-cardinality metrics into pre-aggregated series at ingestion, reducing time series volume before storage. Applies to metrics. More here...
The Overview at the top of the page summarizes the effect of all active rules:
- Stored volume: The volume Dash0 stores after every rule has been applied, shown against the raw volume ingested.
- Reduced by rules: The total volume removed by all active rules.
- Active rules: How many rules are currently enabled, and across how many signal types.
What Each Stage Reduces
The stages target different cost drivers, so they compose:
- Filtering and sampling reduce record and trace volume. Spam filters drop individual records; sampling drops whole traces while preserving errors and outliers.
- Signal-to-metrics reduces record volume by summarizing it. A high-volume log stream becomes a small number of metric data points you can still chart and alert on.
- Time series aggregation reduces cardinality and datapoint frequency. Spatial aggregation collapses many high-cardinality series into fewer pre-aggregated series, and temporal aggregation reduces how frequently data points are stored on the remaining metrics.
Telemetry dropped by a spam filter or by sampling cannot be recovered. Test rule conditions carefully before enabling them, especially in production datasets.
Further Reading
-
Filter Out Spam. Drop noisy, low-value logs, metrics, spans, and web events before they reach storage.
-
Convert Signals to Metrics. Turn high-volume logs and spans into compact metric data points at ingestion.
-
Sample Traces. Keep errors and slow traces while reducing routine traces to a target percentage.
-
Aggregate Time Series. Roll up high-cardinality metrics into pre-aggregated series to reduce time series volume.
-
About SignalControl Edge. Run spam filtering, signal-to-metrics conversion, and tail sampling inside your own network, on Kubernetes or standalone, to cut egress cost.