
Last updated:
GeoMap Definition
Displays metric data and event annotations on a geographic map with configurable projections, country-level grouping, and event pin visualization.
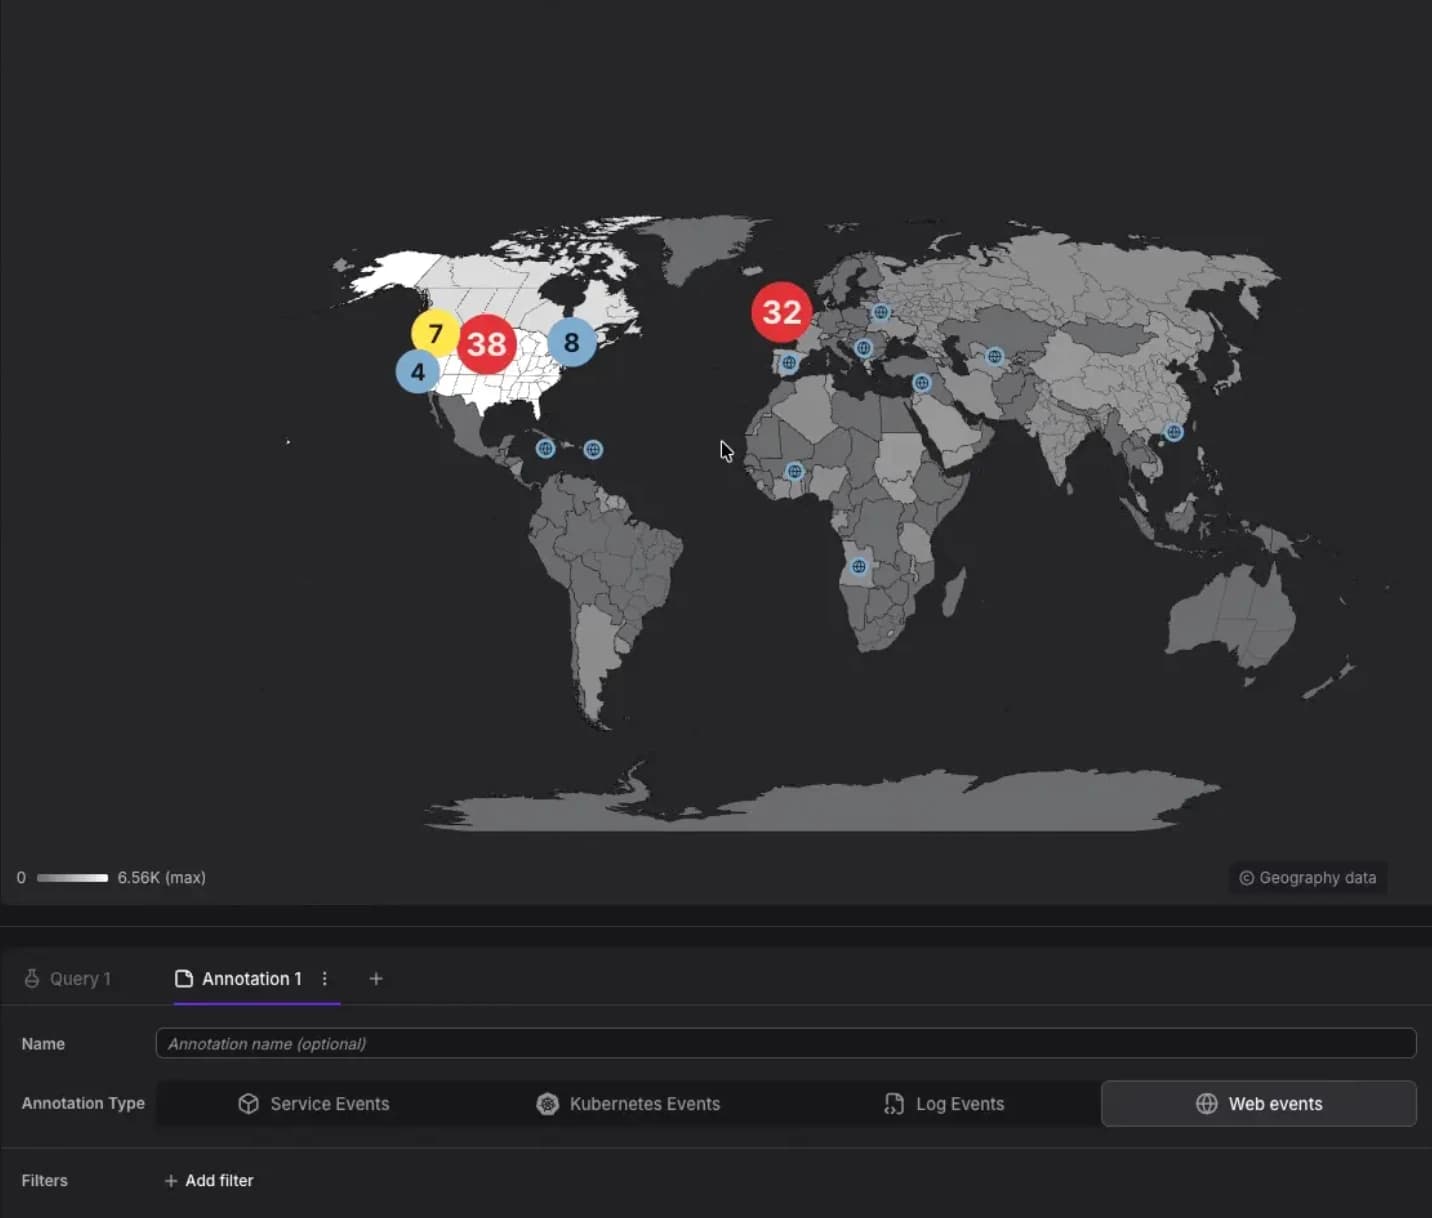
Features
- Metric visualization: Color countries by aggregated metric values
- Event pins: Display web events, logs, Kubernetes events, or any telemetry with geo attributes as pins on the map
- Pin clustering: Nearby events cluster into bubbles showing count and severity when zoomed out; split into individual pins when zoomed in
- Interactive tooltips: Click pins to view event details; hold Alt/Option to keep tooltips open and click through to underlying events
- City reference layer: Toggle to show major cities and towns for geographic orientation
- Zoom controls: Trackpad pinch-to-zoom on macOS, plus standard zoom controls
Kind: GeoMap
Adding Event Annotations to GeoMap
Event annotations appear as pins on the map, showing where your users experience errors, performance issues, or other events. The pins use the same markers, colors, and severity indicators as timeline event annotations.
To enable event pins:
- Open the GeoMap panel in edit mode
- Scroll to the Annotation settings below the query editor
- Click Add Annotation
- Select an Annotation type (Web Events, Kubernetes Events, Service Events, or Log Events)
- Configure filters to scope the events
- Save the panel
Event pins resolve from standard OpenTelemetry geo attributes defined in the OpenTelemetry semantic conventions for geo attributes. If your telemetry includes exact coordinates and locality data, pins render at precise locations; otherwise they resolve to country or region level.
Enable the Show Cities toggle to overlay city reference points when panning and zooming below country level.
Interacting with Event Pins
- Zoom out: Nearby pins cluster into a single bubble that grows with event count and takes the most severe color
- Zoom in: Clusters split apart into individual pins
- Click a pin: Opens a tooltip with event details
- Alt/Option + Click: Pins the tooltip open so you can click through to underlying events
- Trackpad pinch (macOS): Zoom directly on the map without zooming the entire page
Spec Properties
| Property | Type | Required | Description |
|---|---|---|---|
show | string | Yes | |
groupBy | array of string | Yes | |
filter | array | No | |
sortGroups | string — enum: world, map, geo | No | |
sortItems | string — enum: world, map, geo | No | |
format | timeFormatOptions | percentFormatOptions | decimalFormatOptions | bytesFormatOptions | bytesPerSecondFormatOptions | throughputFormatOptions | currencyFormatOptions | temperatureFormatOptions | No | Value format configuration. Choose one of: time, percent, decimal, bytes, bytes/s, throughput, currency, or temperature. |
legend | object with keys: showLegend, position, sort | No | |
visual | object with keys: strokeWidth, enableZoom, showGraticule, projectionType, initialX, initialY, initialZoomLevel | No | |
dash0Extensions | object with keys: maxTimeSeries | No |
Shared Definitions
filterCriteria
Type: array
attributeFilter
| Property | Type | Required |
|---|---|---|
key | string | Yes |
operator | string — enum: is, is_not, gt, lt, gte, lte, matches, does_not_match, contains, does_not_contain, starts_with, does_not_start_with, ends_with, does_not_end_with, is_set, is_not_set, is_one_of, is_not_one_of, is_any | Yes |
value | string | No |
values | array of string | No |
formatOptions
Value format configuration. Choose one of: time, percent, decimal, bytes, bytes/s, throughput, currency, or temperature.
One of: timeFormatOptions | percentFormatOptions | decimalFormatOptions | bytesFormatOptions | bytesPerSecondFormatOptions | throughputFormatOptions | currencyFormatOptions | temperatureFormatOptions
timeFormatOptions
Format options for displaying time duration values.
| Property | Type | Required |
|---|---|---|
unit | string — enum: nanosecond, microsecond, milliseconds, seconds, minutes, hours, days, weeks, months, years | Yes |
decimalPlaces | number | No |
percentFormatOptions
Format options for displaying percentage values.
| Property | Type | Required |
|---|---|---|
unit | string — enum: percent, percent-decimal, % | Yes |
decimalPlaces | number | No |
decimalFormatOptions
Format options for displaying plain decimal numbers.
| Property | Type | Required |
|---|---|---|
unit | string — enum: decimal | Yes |
decimalPlaces | number | No |
shortValues | boolean | No |
bytesFormatOptions
Format options for displaying byte values.
| Property | Type | Required |
|---|---|---|
unit | string — enum: bytes | Yes |
decimalPlaces | number | No |
shortValues | boolean | No |
base | string — enum: decimal, binary | No |
bytesPerSecondFormatOptions
Format options for displaying byte rate values (bytes per second).
| Property | Type | Required |
|---|---|---|
decimalPlaces | number | No |
shortValues | boolean | No |
base | string — enum: decimal, binary | No |
unit | string — enum: bytes/s, bytes/sec | Yes |
throughputFormatOptions
Format options for displaying throughput/rate values.
| Property | Type | Required |
|---|---|---|
unit | string — enum: counts/sec, events/sec, messages/sec, ops/sec, packets/sec, reads/sec, records/sec, errors/sec, requests/sec, rows/sec, writes/sec, /m, /s | Yes |
decimalPlaces | number | No |
shortValues | boolean | No |
currencyFormatOptions
Format options for displaying monetary/currency values.
| Property | Type | Required |
|---|---|---|
unit | string — enum: currency-usd, currency-eur, currency-cny, currency-jpy | Yes |
decimalPlaces | number | No |
shortValues | boolean | No |
temperatureFormatOptions
Format options for displaying temperature values.
| Property | Type | Required |
|---|---|---|
unit | string — enum: celsius, fahrenheit | Yes |
decimalPlaces | number | No |
shortValues | boolean | No |
sortConfiguration
Sorting configuration for table or list displays.
| Property | Type | Required |
|---|---|---|
sortField | string | null | No |
sortDirection | string — enum: asc, desc | No |