Last updated: July 14, 2026
TimeSeriesChart Definition
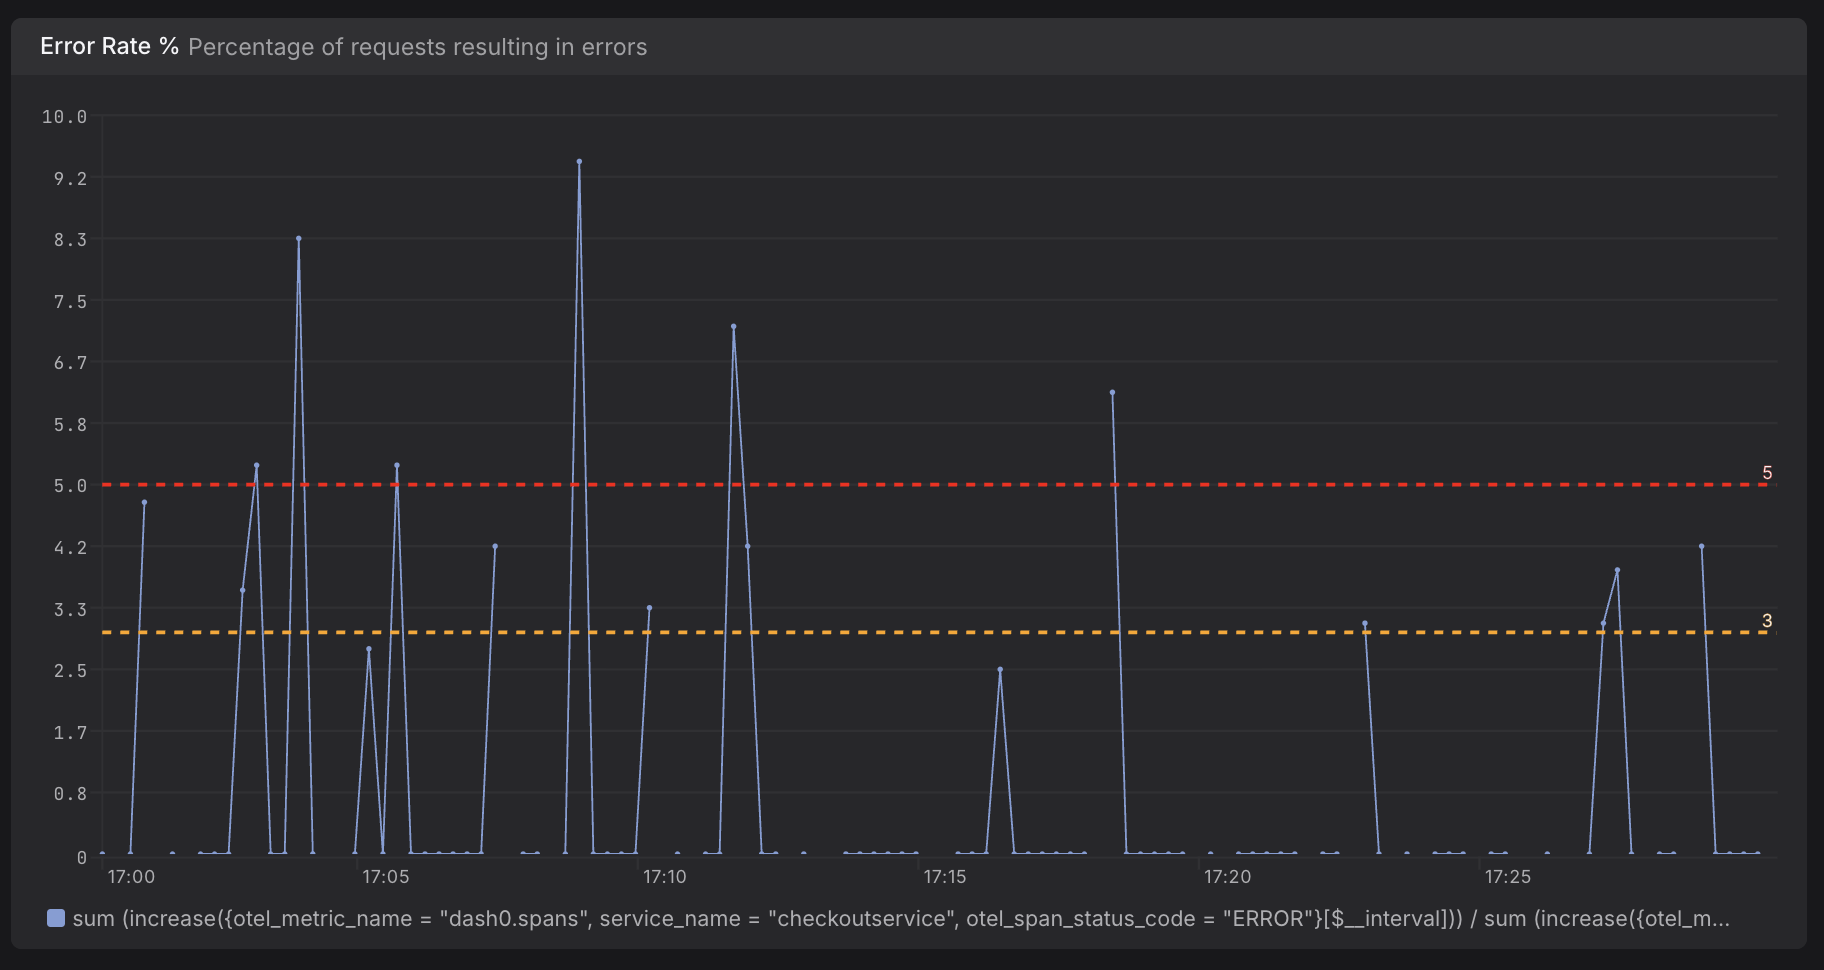
Displays metric data as a time series line or bar chart with optional legend, thresholds, and Y-axis configuration.
Kind: TimeSeriesChart
Spec Properties
| Property | Type | Required | Description |
|---|---|---|---|
legend | object with keys: showLegend, position, mode, sort | No | |
yAxis | object with keys: show, label, format, maxDesiredDataPoints, min, max, showOnlyMaxScale | No | |
thresholds | object — Configuration for color-coding values based on threshold boundaries. | No | Configuration for color-coding values based on threshold boundaries. |
visual | object with keys: display, lineWidth, areaOpacity, palette, stack, connectNulls | No | |
querySettings | array of object | No | |
dash0Extensions | object with keys: maxTimeSeries, yAxis | No |
Shared Definitions
sortConfiguration
Sorting configuration for table or list displays.
| Property | Type | Required |
|---|---|---|
sortField | string | null | No |
sortDirection | string — enum: asc, desc | No |
formatOptions
Value format configuration. Choose one of: time, percent, decimal, bytes, bytes/s, throughput, currency, or temperature.
One of: timeFormatOptions | percentFormatOptions | decimalFormatOptions | bytesFormatOptions | bytesPerSecondFormatOptions | throughputFormatOptions | currencyFormatOptions | temperatureFormatOptions
timeFormatOptions
Format options for displaying time duration values.
| Property | Type | Required |
|---|---|---|
unit | string — enum: nanosecond, microsecond, milliseconds, seconds, minutes, hours, days, weeks, months, years | Yes |
decimalPlaces | number | No |
percentFormatOptions
Format options for displaying percentage values.
| Property | Type | Required |
|---|---|---|
unit | string — enum: percent, percent-decimal, % | Yes |
decimalPlaces | number | No |
decimalFormatOptions
Format options for displaying plain decimal numbers.
| Property | Type | Required |
|---|---|---|
unit | string — enum: decimal | Yes |
decimalPlaces | number | No |
shortValues | boolean | No |
bytesFormatOptions
Format options for displaying byte values.
| Property | Type | Required |
|---|---|---|
unit | string — enum: bytes | Yes |
decimalPlaces | number | No |
shortValues | boolean | No |
base | string — enum: decimal, binary | No |
bytesPerSecondFormatOptions
Format options for displaying byte rate values (bytes per second).
| Property | Type | Required |
|---|---|---|
decimalPlaces | number | No |
shortValues | boolean | No |
base | string — enum: decimal, binary | No |
unit | string — enum: bytes/s, bytes/sec | Yes |
throughputFormatOptions
Format options for displaying throughput/rate values.
| Property | Type | Required |
|---|---|---|
unit | string — enum: counts/sec, events/sec, messages/sec, ops/sec, packets/sec, reads/sec, records/sec, errors/sec, requests/sec, rows/sec, writes/sec, /m, /s | Yes |
decimalPlaces | number | No |
shortValues | boolean | No |
currencyFormatOptions
Format options for displaying monetary/currency values.
| Property | Type | Required |
|---|---|---|
unit | string — enum: currency-usd, currency-eur, currency-cny, currency-jpy | Yes |
decimalPlaces | number | No |
shortValues | boolean | No |
temperatureFormatOptions
Format options for displaying temperature values.
| Property | Type | Required |
|---|---|---|
unit | string — enum: celsius, fahrenheit | Yes |
decimalPlaces | number | No |
shortValues | boolean | No |
maxDesiredDataPoints
Maximum number of data points to display in the widget (0–1000). Lower values improve performance, higher values increase resolution. Null means use the default.
One of: number | null
thresholdOptions
Configuration for color-coding values based on threshold boundaries.
| Property | Type | Required |
|---|---|---|
mode | string — enum: percent, absolute | No |
defaultColor | string | No |
max | number | No |
steps | array of stepOptions | No |
stepOptions
A single threshold step defining a boundary value, color, and optional label.
| Property | Type | Required |
|---|---|---|
value | number | Yes |
color | string | No |
name | string | No |
paletteModeOptions
Color palette mode for the chart. 'auto' selects colors automatically, 'categorical' uses a fixed color set for distinguishing series, 'schemeDark2' uses the Dark2 color scheme, and 'error' uses red-toned colors for error-related visualizations.
Type: string
Values: auto, categorical, schemeDark2, error